|
|
|
Ferromagnetic transition of a spin–orbit coupled dipolar Fermi gas at finite temperature |
| Xue-Jing Feng(冯雪景) and Lan Yin(尹澜)† |
| School of Physics, Peking University, Beijing 100871, China |
|
|
|
|
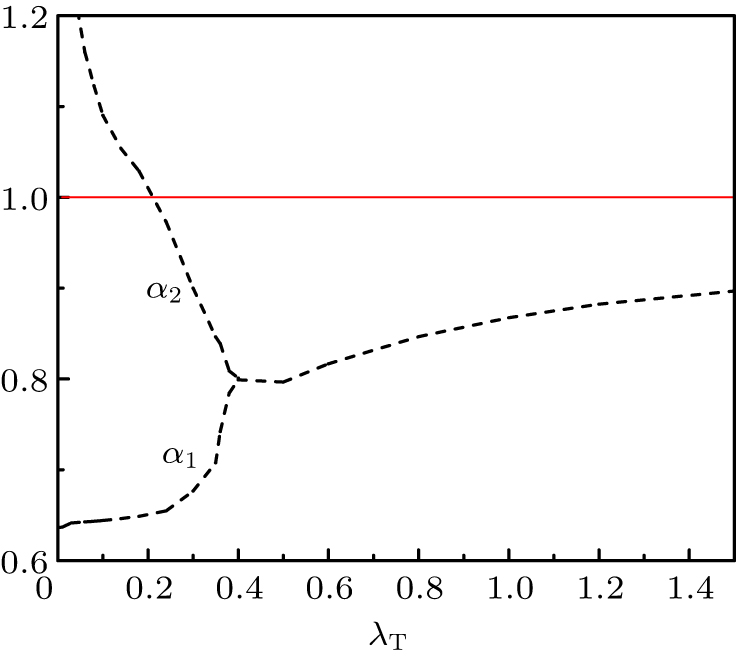
Abstract We study the ferromagnetic transition of a two-component homogeneous dipolar Fermi gas with 1D spin–orbit coupling (SOC) at finite temperature. The ferromagnetic transition temperature is obtained as functions of dipolar constant λd, spin–orbit coupling constant λSOC and contact interaction constant λs. It increases monotonically with these three parameters. In the ferromagnetic phase, the Fermi surfaces of different components can be deformed differently. The phase diagrams at finite temperature are obtained.
|
Received: 15 May 2020
Revised: 29 June 2020
Accepted manuscript online: 28 July 2020
|
| Fund: the National Key Research and Development Project of China (Grant No. 2016YFA0301501). |
|
Corresponding Authors:
†Corresponding author. E-mail: yinlan@pku.edu.cn
|
Cite this article:
Xue-Jing Feng(冯雪景) and Lan Yin(尹澜) Ferromagnetic transition of a spin–orbit coupled dipolar Fermi gas at finite temperature 2020 Chin. Phys. B 29 110306
|
| [1] |
|
| [2] |
Davis K B, Mewes M O, Andrews M R, van Druten N J, Durfee D S, Kurn D M, Ketterle W 1995 Phys. Rev. Lett. 75 3969 DOI: 10.1103/PhysRevLett.75.3969 |
| [3] |
Ni K K, Ospelkaus S, de Miranda M H G, Pe’Er A, Neyenhuis B, Zirbel J J, Kotochigova S, Julienne P S, Jin D S, Ye J 2008 Science 322 231 DOI: 10.1126/science.1163861 |
| [4] |
Bo Y, Moses S A, Bryce G, Covey J P, Hazzard K R A, Ana Maria R, Jin D S, Jun Y 2013 Nature 501 521 DOI: 10.1038/nature12483 |
| [5] |
Chotia A, Neyenhuis B, Moses S A, Yan B, Covey J P, Foss-Feig M, Rey A M, Jin D S, Ye J 2012 Phys. Rev. Lett. 108 080405 DOI: 10.1103/PhysRevLett.108.080405 |
| [6] |
Ni K K, Ospelkaus S, Wang D, Quéméner G, Neyenhuis B, de Miranda M H G, Bohn J L, Ye J, Jin D S 2010 Nature 464 1324 DOI: 10.1038/nature08953 |
| [7] |
|
| [8] |
|
| [9] |
|
| [10] |
|
| [11] |
|
| [12] |
|
| [13] |
|
| [14] |
|
| [15] |
|
| [16] |
|
| [17] |
|
| [18] |
|
| [19] |
|
| [20] |
|
| [21] |
|
| [22] |
|
| [23] |
|
| [24] |
|
| [25] |
Jo G B, Lee Y R, Choi J H, Christensen C A, Kim T H, Thywissen J H, Pritchard D E, Ketterle W 2009 Science 325 1521 DOI: 10.1126/science.1177112 |
| [26] |
Valtolina G, Scazza F, Amico A, Burchianti A, Recati A, Enss T, Inguscio M, Zaccanti M, Roati G 2017 Nat. Phys. 13 704 DOI: 10.1038/nphys4108 |
| [27] |
|
| [28] |
|
| [29] |
|
| [30] |
|
| [31] |
|
| [32] |
|
| [33] |
|
| [34] |
|
| [35] |
|
| [36] |
|
| [37] |
|
| [38] |
|
| [39] |
|
| No Suggested Reading articles found! |
|
|
Viewed |
|
|
|
Full text
|
|
|
|
|
Abstract
|
|
|
|
|
Cited |
|
|
|
|
Altmetric
|
|
blogs
Facebook pages
Wikipedia page
Google+ users
|
Online attention
Altmetric calculates a score based on the online attention an article receives. Each coloured thread in the circle represents a different type of online attention. The number in the centre is the Altmetric score. Social media and mainstream news media are the main sources that calculate the score. Reference managers such as Mendeley are also tracked but do not contribute to the score. Older articles often score higher because they have had more time to get noticed. To account for this, Altmetric has included the context data for other articles of a similar age.
View more on Altmetrics
|
|
|