| CONDENSED MATTER: STRUCTURAL, MECHANICAL, AND THERMAL PROPERTIES |
Prev
Next
|
|
|
Covalent coupling of DNA bases with graphene nanoribbon electrodes: Negative differential resistance, rectifying, and thermoelectric performance |
| Peng-Peng Zhang(张鹏鹏)1, Shi-Hua Tan(谭仕华)1,†, Xiao-Fang Peng(彭小芳)1,‡, and Meng-Qiu Long(龙孟秋)2 |
1 Hunan Provincial Key Laboratory of Materials Surface or Interface Science and Technology, Central South University of Forestry and Technology, Changsha 410004, China
2 School of Physics and Electronics, Central South University, Changsha 410083, China |
|
|
|
|
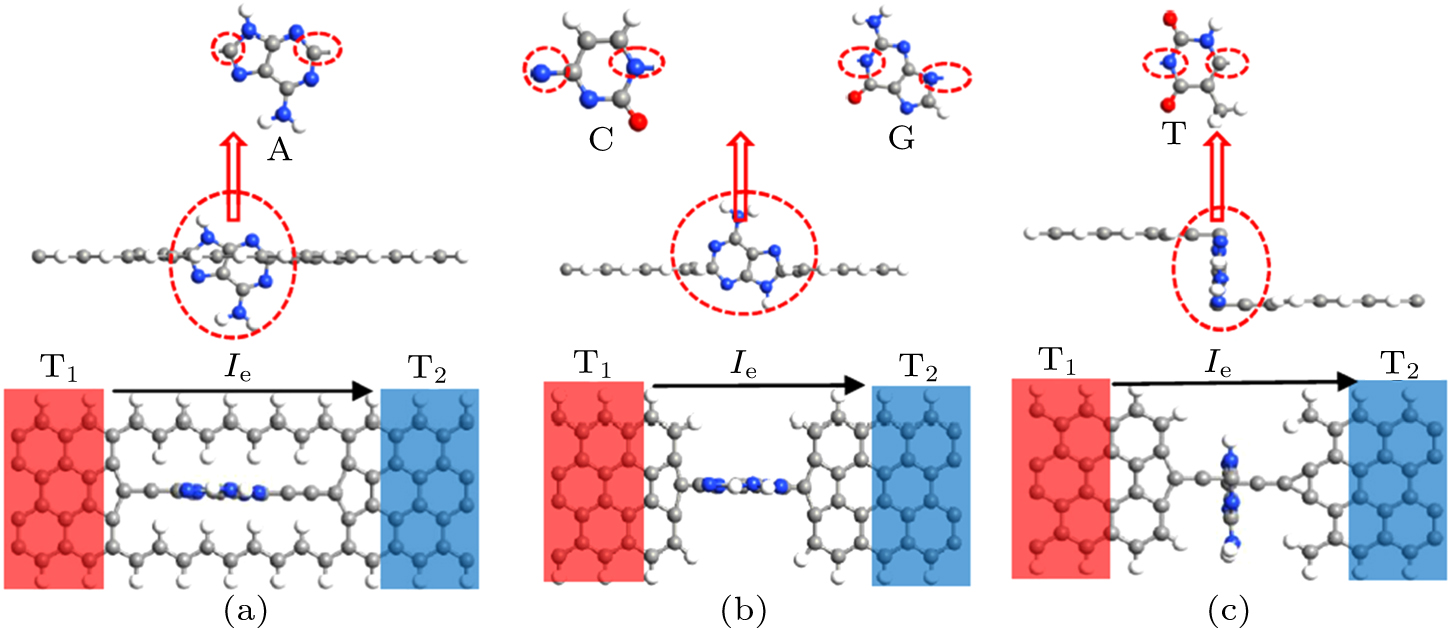
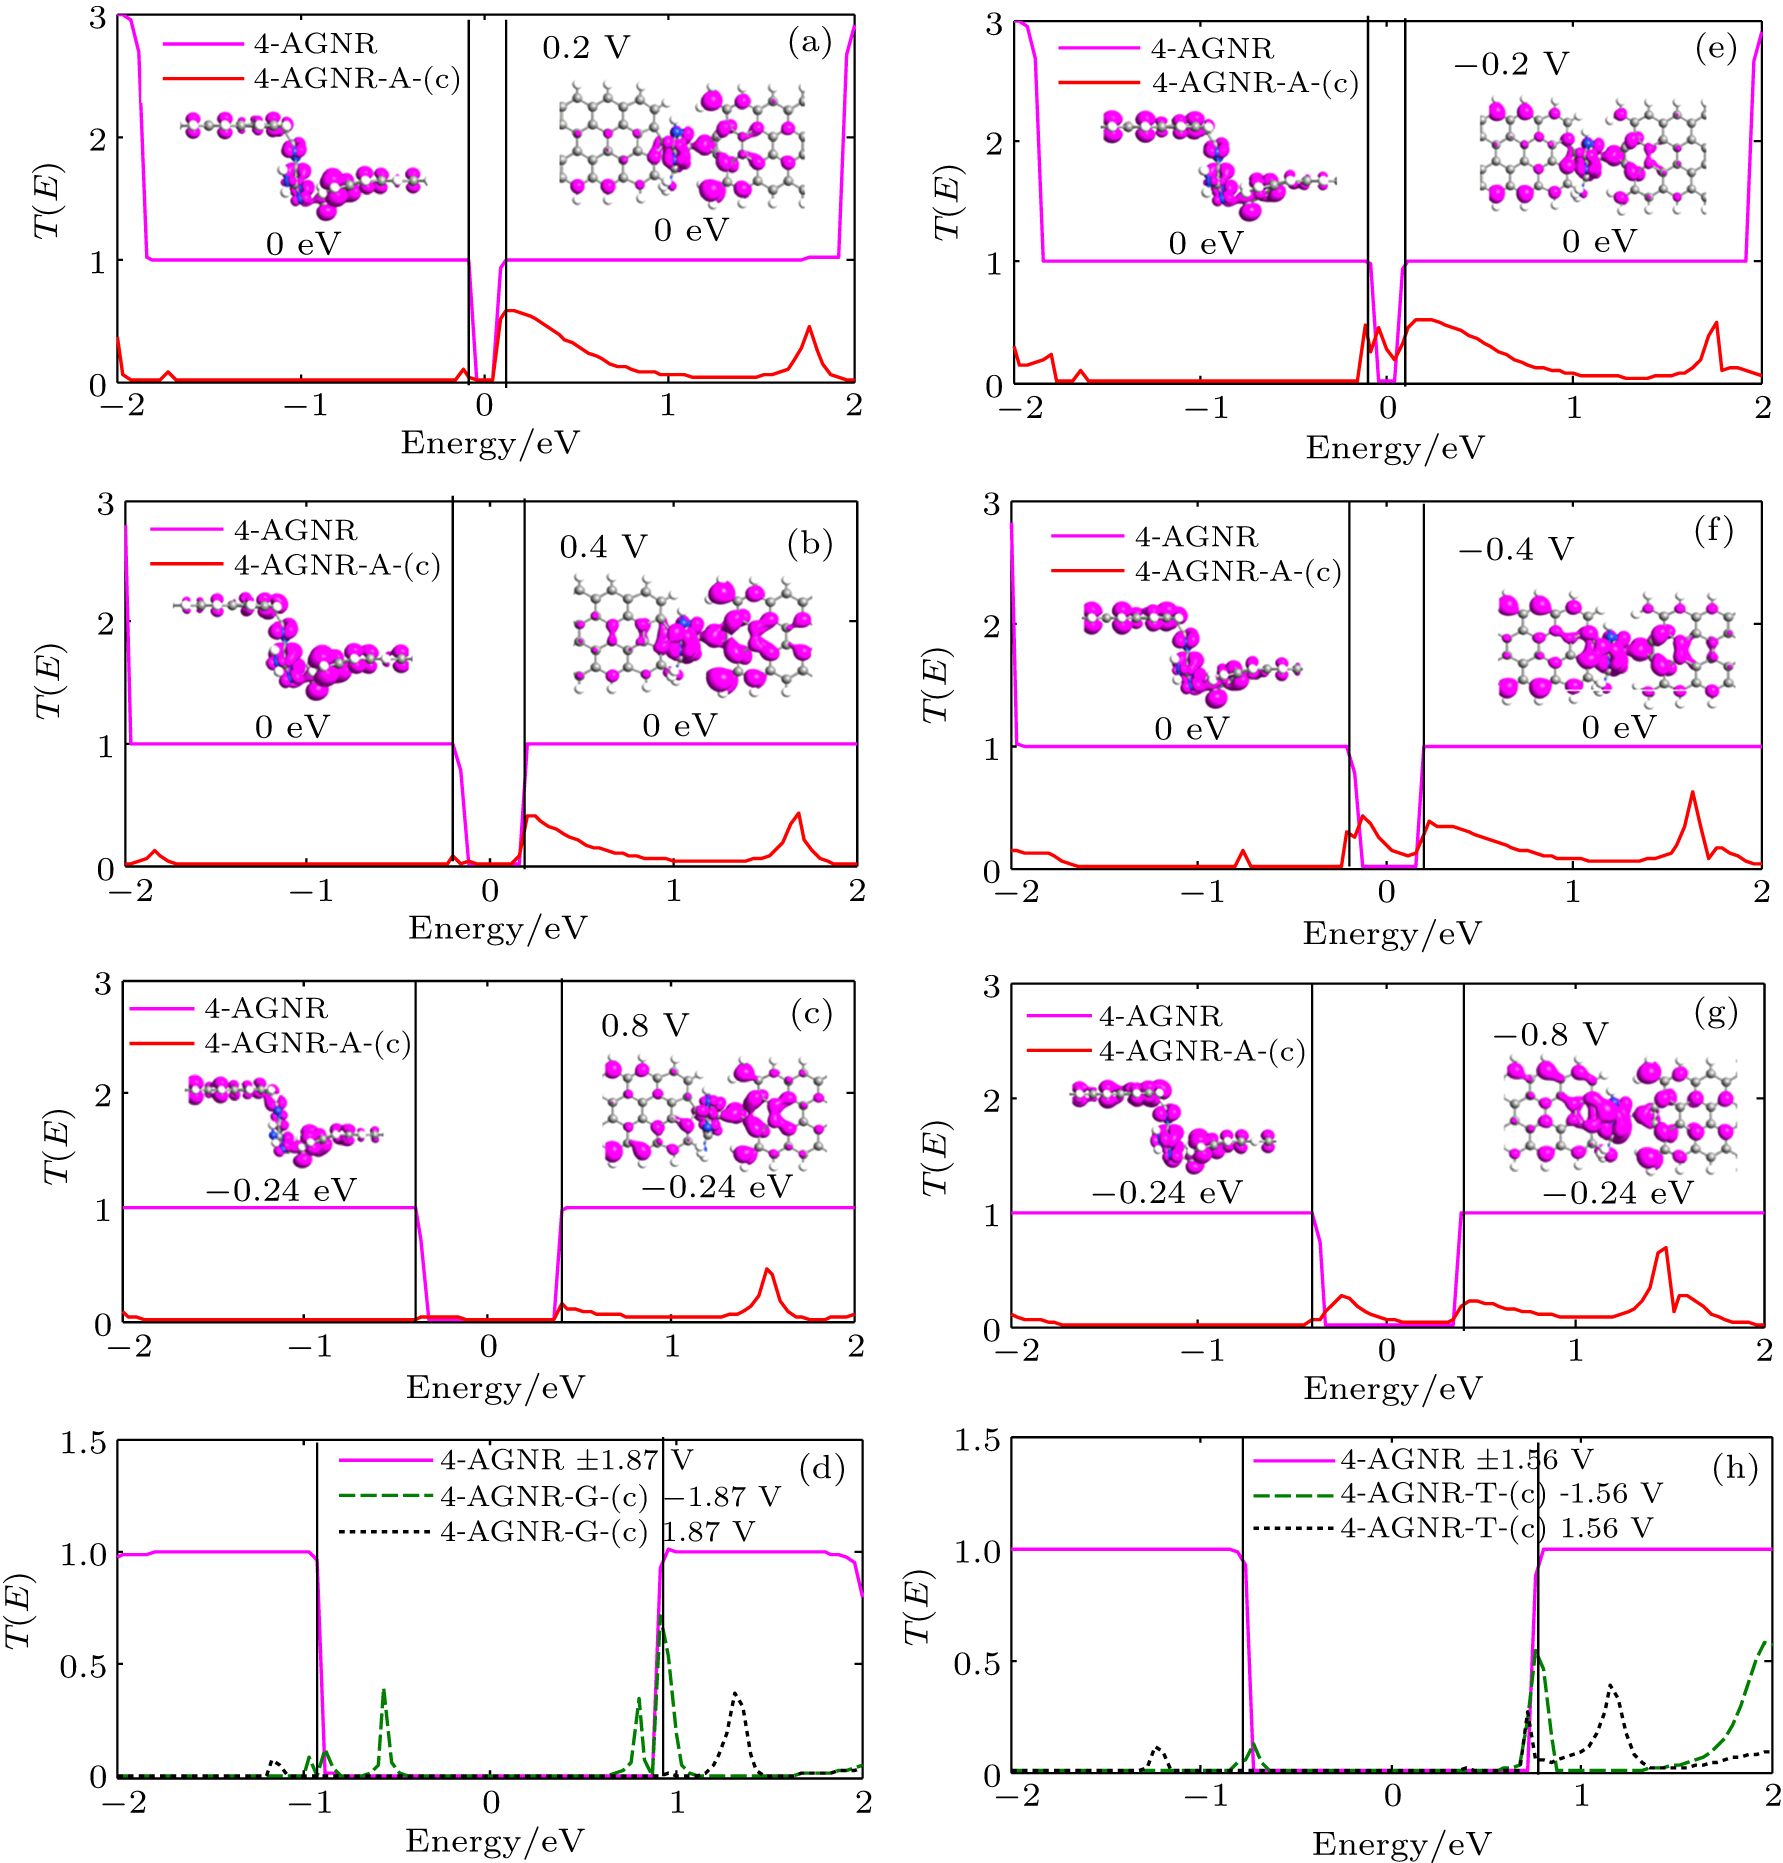
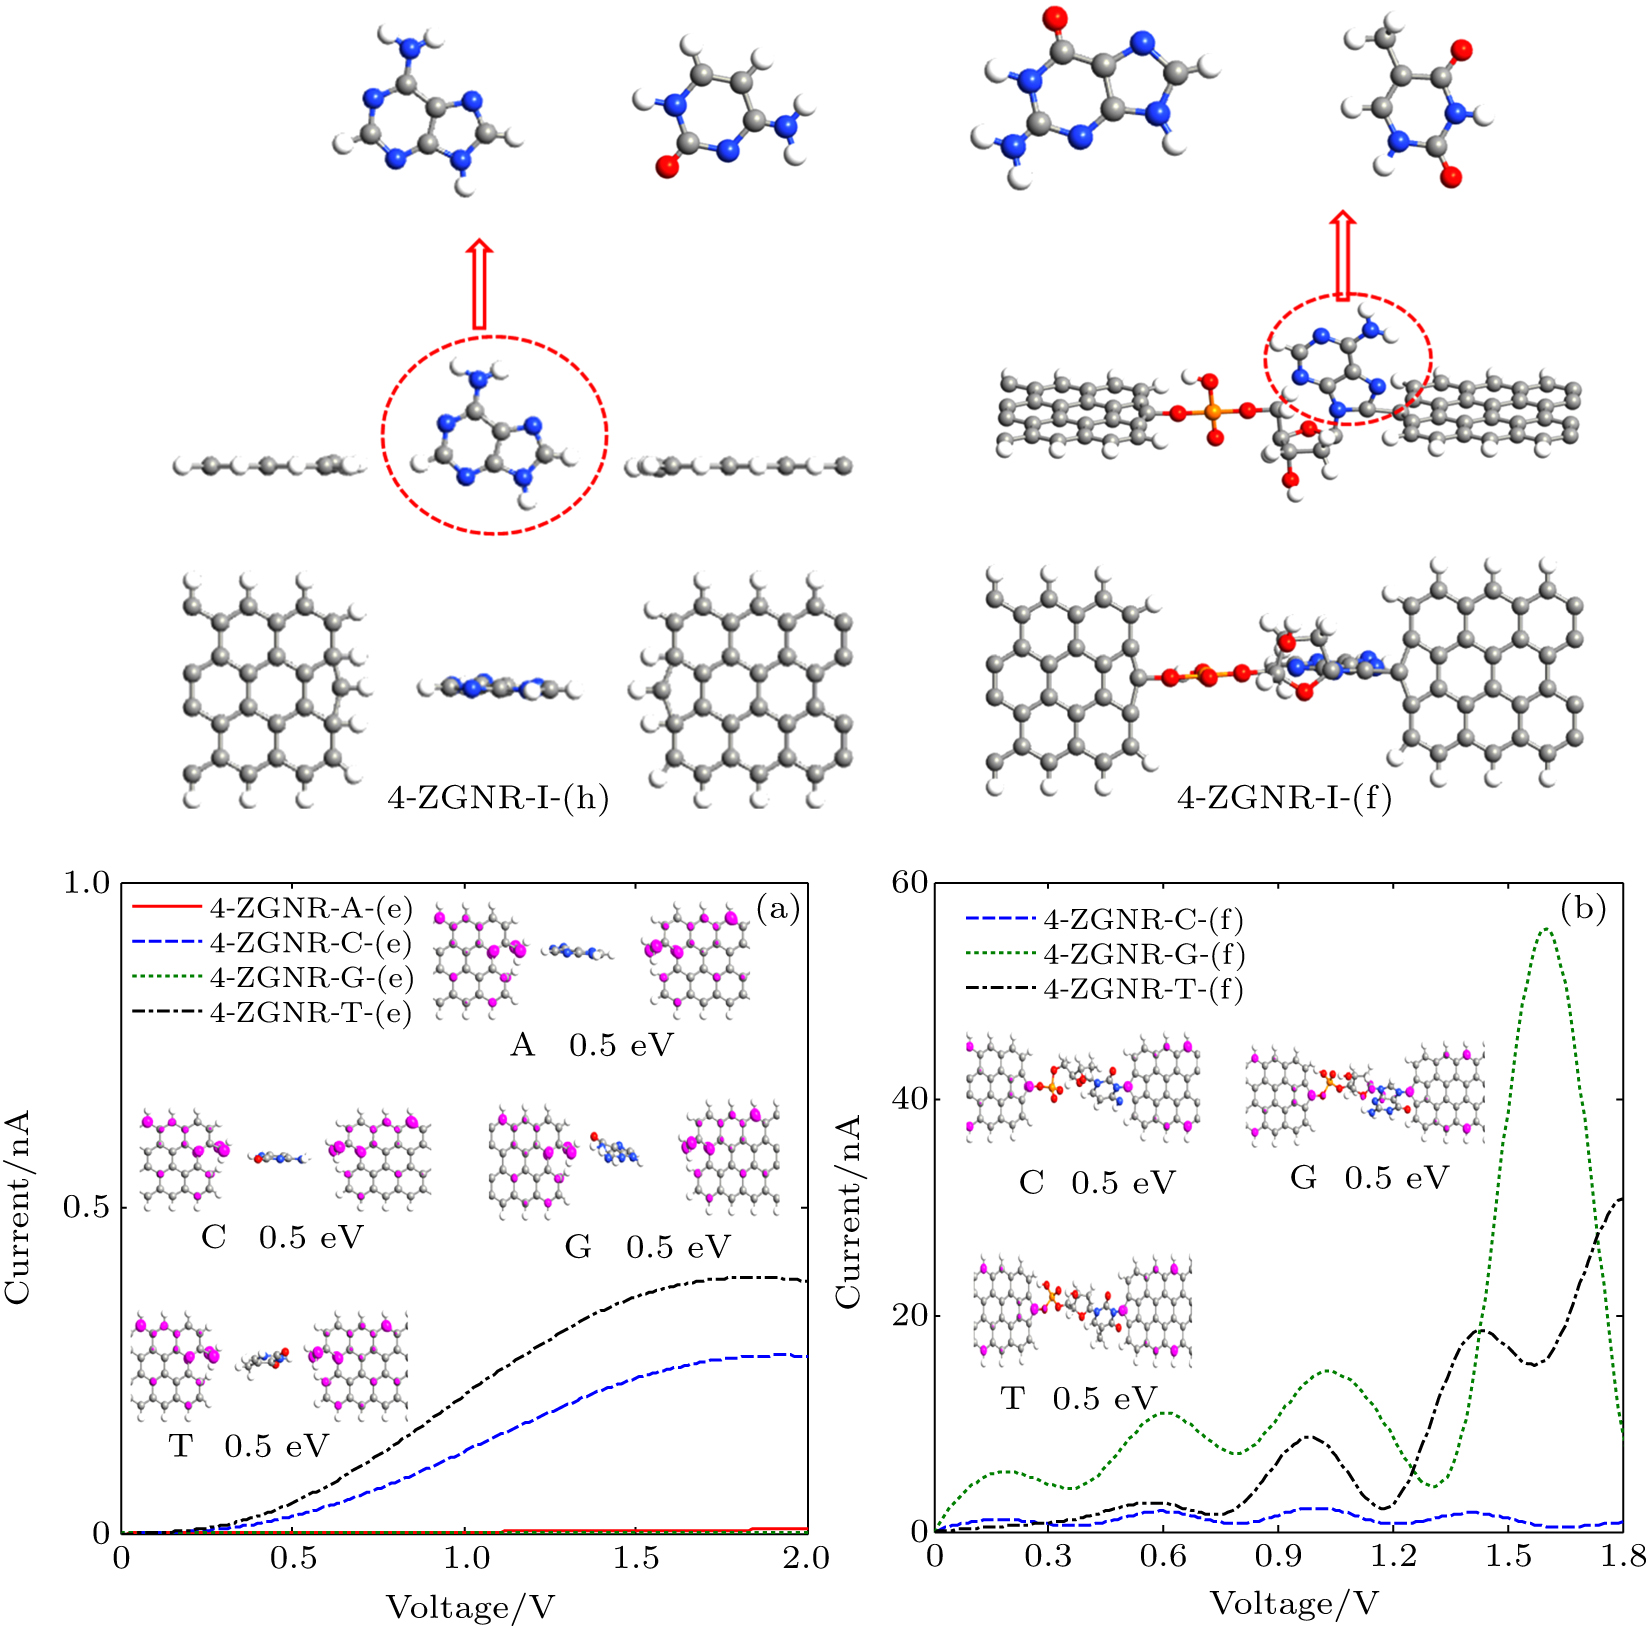
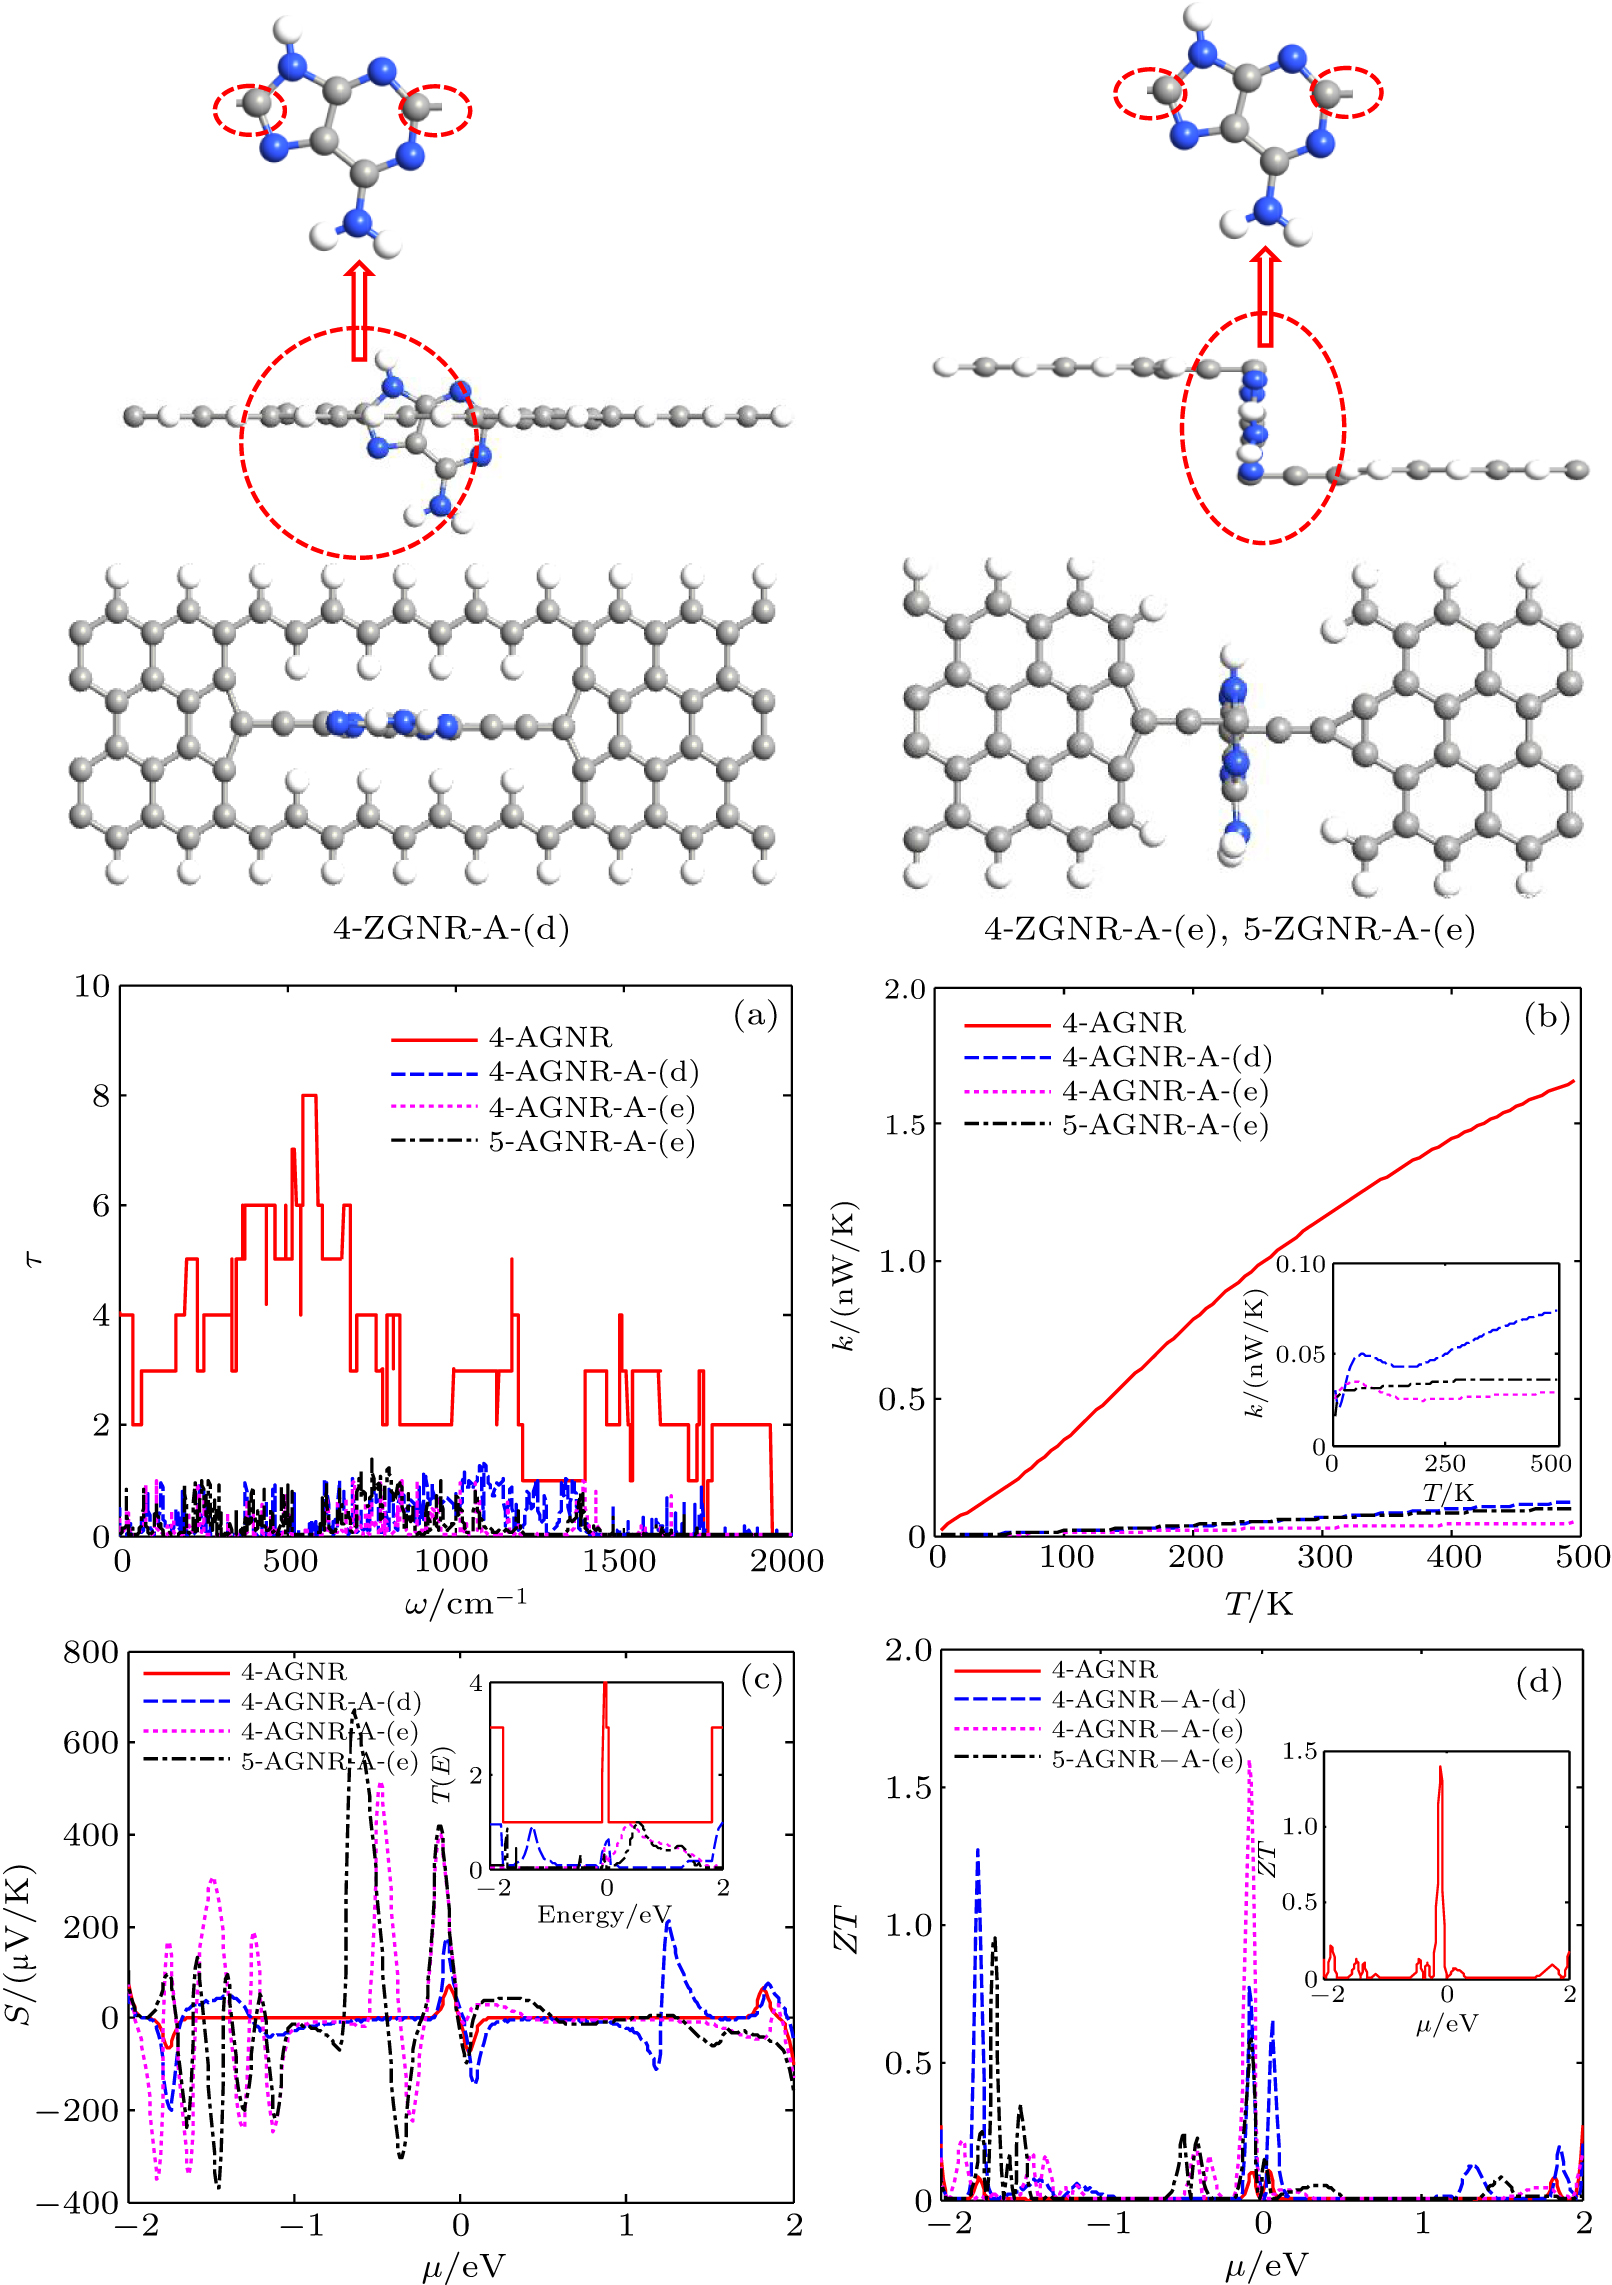
Abstract By applying nonequilibrium Green’s functions in combination with the density-functional theory, we investigate the electronic, thermal, and thermoelectric properties of four kinds of bases in DNA perpendicularly coupling between two ZGNR electrodes. The results show that the electron transport is highly sensitive to different base-ZGNR coupling geometries, and the system can present large rectifying and negative differential resistance effects. Moreover, the fluctuations of electronic transmission and super-low thermal conductance result in significant enhancement of the thermoelectric figure of merit (ZT): the ZT will be over 1.4 at room temperature, and over 1.6 at 200 K. The results show that the base-ZGNR coupling devices can present large rectifying, negative differential resistance, and enhanced thermoelectric effects.
|
Received: 16 June 2020
Revised: 18 July 2020
Accepted manuscript online: 28 July 2020
|
|
PACS:
|
68.65.-k
|
(Low-dimensional, mesoscopic, nanoscale and other related systems: structure and nonelectronic properties)
|
| |
44.10.+i
|
(Heat conduction)
|
| |
65.80.Ck
|
(Thermal properties of graphene)
|
| |
81.05.ue
|
(Graphene)
|
|
|
Corresponding Authors:
†Corresponding author. E-mail: shtan@csuft.edu.cn
|
| About author: †Corresponding author. E-mail: shtan@csuft.edu.cn ‡Corresponding author. E-mail: xiaofangpeng11@163.com * Project supported by the National Natural Science Foundation of China (Grant Nos. 11704417 and 11247030), the Natural Science Foundation of Hunan Province, China (Grant No. 2019JJ40532), and the Talent Introducing Foundation of Central South University of Forestry and Technology (Grant No. 1040160). |
Cite this article:
Peng-Peng Zhang(张鹏鹏), Shi-Hua Tan(谭仕华)†, Xiao-Fang Peng(彭小芳)‡, and Meng-Qiu Long(龙孟秋) Covalent coupling of DNA bases with graphene nanoribbon electrodes: Negative differential resistance, rectifying, and thermoelectric performance 2020 Chin. Phys. B 29 106801
|
| [1] |
|
| [2] |
|
| [3] |
|
| [4] |
Yee S K, Sun J, Darancet P, Tilley T D, Majumdar A, Neaton J B 2011 ACS Nano 5 9256 DOI: 10.1021/nn203520v |
| [5] |
|
| [6] |
|
| [7] |
|
| [8] |
Geng H, Hu Y, Shuai Z, Xia K, Gao H, Chen K 2007 J. Phys. Chem. C 111 19098 DOI: 10.1021/jp077533f |
| [9] |
|
| [10] |
Kuang G, Chen S Z, Wang W, Lin T, Chen K, Shang X, Liu P N, Lin N 2016 J. Am. Chem. Soc. 138 11140 DOI: 10.1021/jacs.6b07416 |
| [11] |
Wu D, Cao X H, Chen S Z, Tang L M, Feng Y X, Chen K Q, Zhou W X 2019 J. Mater. Chem. A. 7 19037 DOI: 10.1039/C9TA04642A |
| [12] |
|
| [13] |
Li Q, Tang L, Zhang C et al. 2017 Appl. Phys. Lett. 111 171602 DOI: 10.1063/1.4998305 |
| [14] |
|
| [15] |
|
| [16] |
|
| [17] |
|
| [18] |
|
| [19] |
|
| [20] |
|
| [21] |
|
| [22] |
|
| [23] |
|
| [24] |
|
| [25] |
|
| [26] |
|
| [27] |
|
| [28] |
Xu Y F, Liu Z B, Zhang X L, Wang Y, Tian J G, Huang Y, Ma Y F, Zhang X Y, Y S 2009 Adv. Mater. 21 1275 DOI: 10.1002/adma.v21:12 |
| [29] |
|
| [30] |
|
| [31] |
Hang P H, Bahramy M S, Nagaosa N, Nikoli@@@ B K 2014 Nano Lett. 14 3779 DOI: 10.1021/nl500755m |
| [32] |
|
| [33] |
|
| [34] |
Zeng J, Chen K Q, He J, Fan Z Q, Zhang X J 2011 J. Appl. Phys. 109 124502 DOI: 10.1063/1.3600067 |
| [35] |
Zeng J, Chen K Q, He J, Zhang X J, Sun C Q 2011 J. Phys. Chem. C 115 25072 DOI: 10.1021/jp208248v |
| [36] |
He Y, Garnica M, Bischoff F, Ducke J, Bocquet M L, Batzill M, Auwärter W, Barth J V 2017 Nat. Chem. 9 33 DOI: 10.1038/nchem.2600 |
| [37] |
|
| [38] |
|
| [39] |
|
| [40] |
|
| [41] |
|
| [42] |
|
| [43] |
|
| [44] |
|
| [45] |
|
| [46] |
|
| [47] |
|
| [48] |
|
| [49] |
|
| [50] |
|
| [51] |
|
| [52] |
|
| [53] |
|
| [54] |
|
| [55] |
|
| [56] |
|
| [57] |
Chang S, Shuo H S, He J, Liang F, Zhang P, Li S 2010 Nano Lett. 10 1070 DOI: 10.1021/nl1001185 |
| [58] |
Huang S, He J, Chang S, Zhang P, Liang F, Li S, Chen X, Sankey O, Lindsay S 2010 Nano Lett. 5 868 DOI: 10.1007/s11671-010-9577-2 |
| [59] |
|
| [60] |
Pan C N, Xie Z X, Tang L M, Chen K Q 2012 Appl. Phys. Lett. 101 103115 DOI: 10.1063/1.4751287 |
| No Suggested Reading articles found! |
|
|
Viewed |
|
|
|
Full text
|
|
|
|
|
Abstract
|
|
|
|
|
Cited |
|
|
|
|
Altmetric
|
|
blogs
Facebook pages
Wikipedia page
Google+ users
|
Online attention
Altmetric calculates a score based on the online attention an article receives. Each coloured thread in the circle represents a different type of online attention. The number in the centre is the Altmetric score. Social media and mainstream news media are the main sources that calculate the score. Reference managers such as Mendeley are also tracked but do not contribute to the score. Older articles often score higher because they have had more time to get noticed. To account for this, Altmetric has included the context data for other articles of a similar age.
View more on Altmetrics
|
|
|