| CONDENSED MATTER: ELECTRONIC STRUCTURE, ELECTRICAL, MAGNETIC, AND OPTICAL PROPERTIES |
Prev
Next
|
|
|
Quantum anomalous Hall effect in twisted bilayer graphene quasicrystal |
| Zedong Li(李泽东) and Z F Wang(王征飞)† |
| 1 Hefei National Laboratory for Physical Sciences at the Microscale, CAS Key Laboratory of Strongly-Coupled Quantum Matter Physics, University of Science and Technology of China, Hefei 230026, China |
|
|
|
|
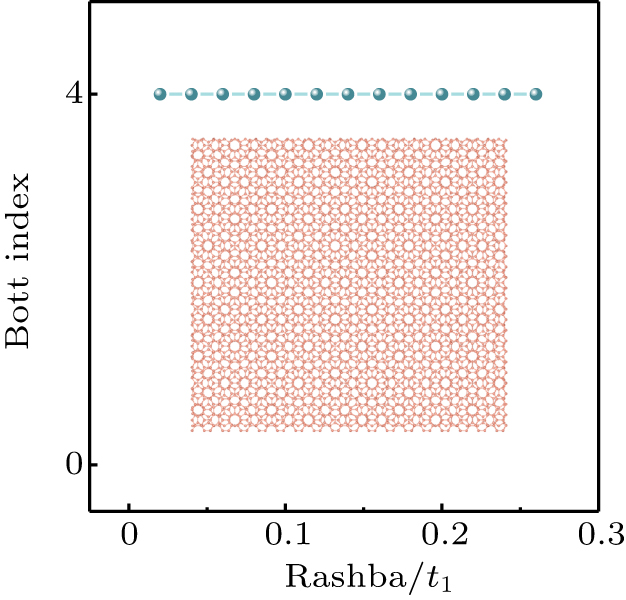
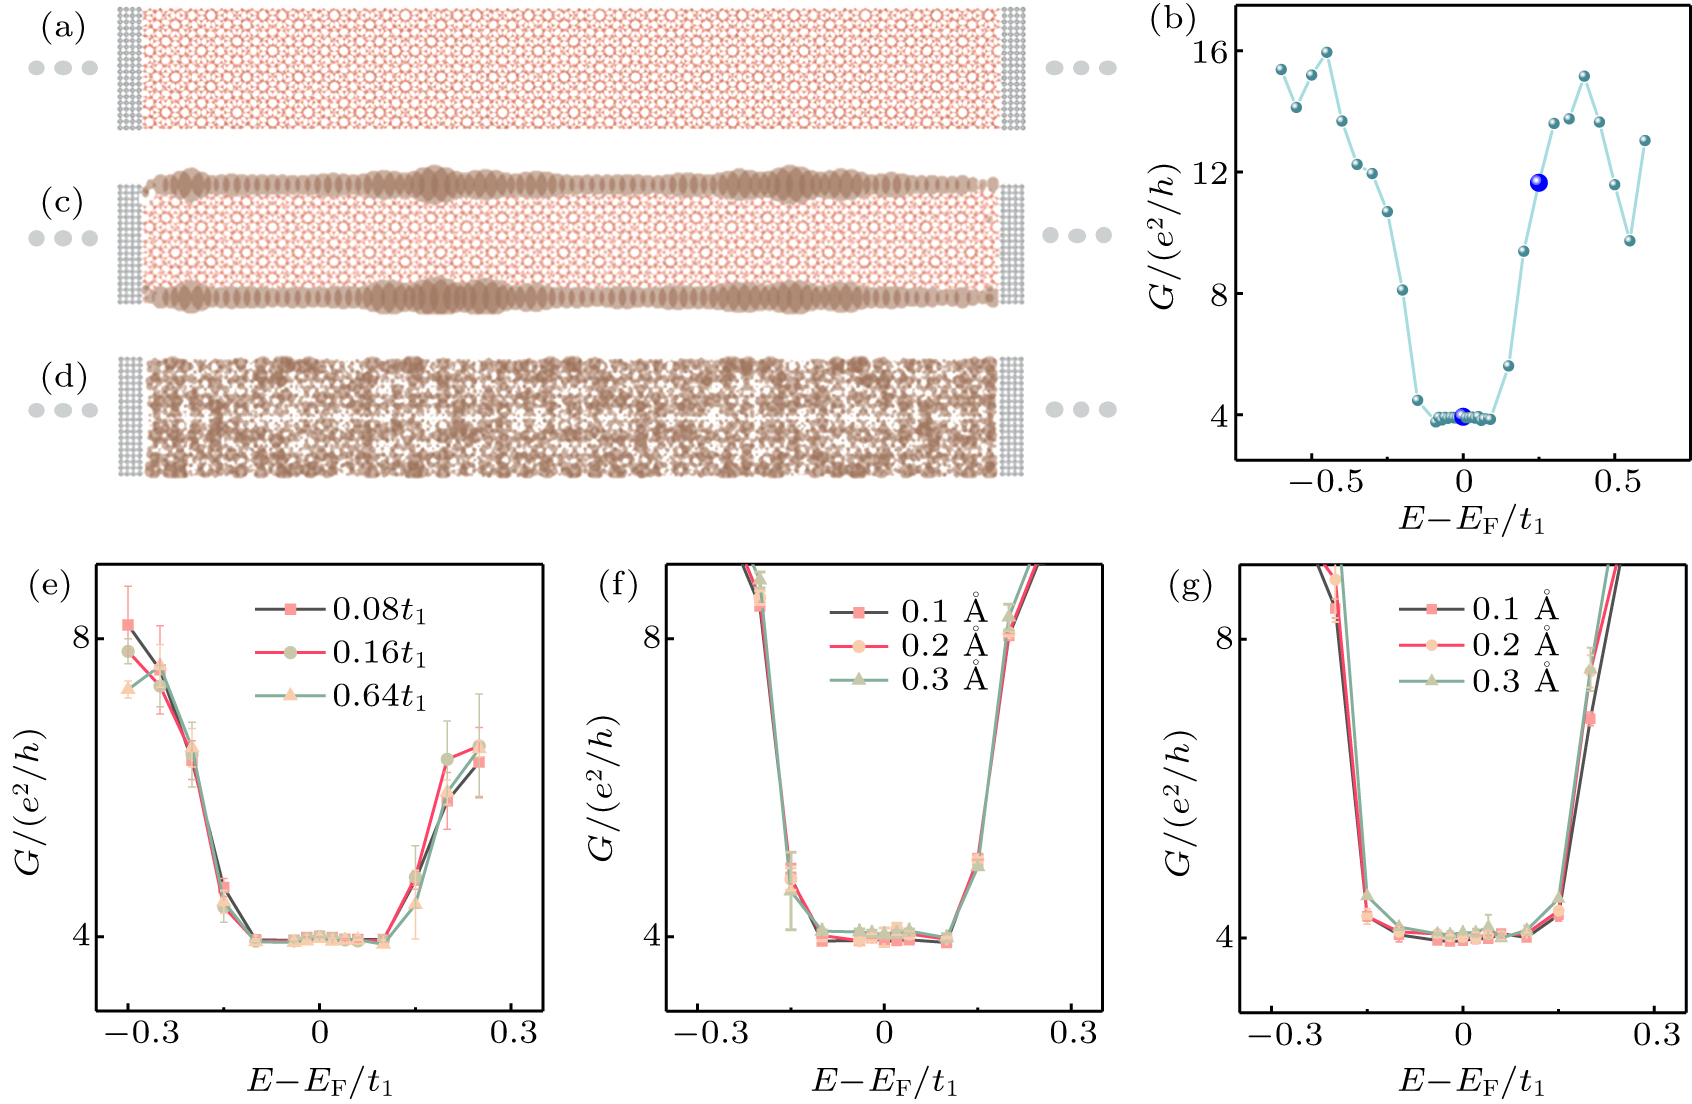
Abstract The nontrivial topology is investigated in a dodecagonal quasicrystal made of 30° twisted bilayer graphene (TBG). Based on tight-binding model with both exchange field and Rashba spin–orbit coupling, the topological index, chiral edge states, and quantum conductance are calculated to distinguish its unique topological phase. A high Bott index (B = 4) quantum anomalous Hall effect (QAHE) is identified in TBG quasicrystal, which is robust to a finite perturbation without closing the nontrivial gap. Most remarkably, we have found that the multiple Dirac cone replicas in TBG quasicrystal are only a spectra feature without generating extra chiral edge states. Our results not only propose a possible way to realize the QAHE in quasicrystal, but also identify the continuity of nontrivial topology in TBG between crystal and quasicrystal.
|
Received: 06 May 2020
Revised: 24 July 2020
Accepted manuscript online: 01 August 2020
|
|
PACS:
|
71.23.Ft
|
(Quasicrystals)
|
| |
73.43.Cd
|
(Theory and modeling)
|
| |
72.15.Cz
|
(Electrical and thermal conduction in amorphous and liquid metals and Alloys ?)
|
|
|
Corresponding Authors:
†Corresponding author. E-mail: zfwang15@ustc.edu.cn
|
| About author: †Corresponding author. E-mail: zfwang15@ustc.edu.cn * Project supported by the National Natural Science Foundation of China (Grant Nos. 11774325 and 21603210), the National Key Research and Development Program of China (Grant No. 2017YFA0204904), and Fundamental Research Funds for the Central Universities, China. |
Cite this article:
Zedong Li(李泽东) and Z F Wang(王征飞)† Quantum anomalous Hall effect in twisted bilayer graphene quasicrystal 2020 Chin. Phys. B 29 107101
|
| [1] |
|
| [2] |
|
| [3] |
|
| [4] |
|
| [5] |
|
| [6] |
|
| [7] |
|
| [8] |
|
| [9] |
|
| [10] |
|
| [11] |
|
| [12] |
|
| [13] |
|
| [14] |
|
| [15] |
Chang C Z, Zhang J, Feng X, Shen J, Zhang Z, Guo M, Li K, Ou Y, Wei P, Wang L L, Ji Z Q, Feng Y, Ji S, Chen X, Jia J, Dai X, Fang Z, Zhang S C, He K, Wang Y, Lu L, Ma X C, Xue Q K 2013 Science 340 167 DOI: 10.1126/science.1234414 |
| [16] |
|
| [17] |
|
| [18] |
|
| [19] |
|
| [20] |
|
| [21] |
|
| [22] |
|
| [23] |
|
| [24] |
|
| [25] |
|
| [26] |
|
| [27] |
|
| [28] |
|
| [29] |
|
| [30] |
|
| [31] |
|
| [32] |
|
| [33] |
|
| [34] |
|
| [35] |
Cao Y, Fatemi V, Demir A, Fang S, Tomarken S L, Luo J Y, Sanchez-Yamagishi J D, Watanabe K, Taniguchi T, Kaxiras E, Ashoori R C, Jarillo-Herrero P 2018 Nature 556 80 DOI: 10.1038/nature26154 |
| [36] |
Cao Y, Fatemi V, Fang S, Watanabe K, Taniguchi T, Kaxiras E, Jarillo-Herrero P 2018 Nature 556 43 DOI: 10.1038/nature26160 |
| [37] |
|
| [38] |
Ahn S J, Moon P, Kim T H, Kim H W, Shin H C, Kim E H, Cha H W, Kahng S J, Kim P, Koshino M, Son Y W, Yang C W, Ahn J R 2018 Science 361 782 DOI: 10.1126/science.aar8412 |
| [39] |
Yao W, Wang E, Bao C, Zhang Y, Zhang K, Bao K, Chan C K, Chen C, Avila J, Asensio M C, Zhu J, Zhou S 2018 Proc. Natl. Acad. Sci. USA 115 6928 DOI: 10.1073/pnas.1720865115 |
| [40] |
|
| [41] |
|
| [42] |
|
| [43] |
|
| [44] |
|
| [45] |
|
| [46] |
|
| No Suggested Reading articles found! |
|
|
Viewed |
|
|
|
Full text
|
|
|
|
|
Abstract
|
|
|
|
|
Cited |
|
|
|
|
Altmetric
|
|
blogs
Facebook pages
Wikipedia page
Google+ users
|
Online attention
Altmetric calculates a score based on the online attention an article receives. Each coloured thread in the circle represents a different type of online attention. The number in the centre is the Altmetric score. Social media and mainstream news media are the main sources that calculate the score. Reference managers such as Mendeley are also tracked but do not contribute to the score. Older articles often score higher because they have had more time to get noticed. To account for this, Altmetric has included the context data for other articles of a similar age.
View more on Altmetrics
|
|
|