| ELECTROMAGNETISM, OPTICS, ACOUSTICS, HEAT TRANSFER, CLASSICAL MECHANICS, AND FLUID DYNAMICS |
Prev
Next
|
|
|
Photoluminescence changes of C70 nanotubes induced by laser irradiation |
| Han-Da Wang(王汉达)1, De-Di Liu(刘德弟)1,†, Yang-Yang He(何洋洋)1, Hong-Sheng Jia(贾洪声)3,‡, Ran Liu(刘然)2, Bo Liu(刘波)2, Nai-Sen Yu(于乃森)1,4 , and Zhen-Yi Zhang(张振翼)1 |
1 School of Physics and Materials Engineering, Dalian Nationalities University, Dalian 116600, China
2 State Key Laboratory of Superhard Materials, Jilin University, Changchun 130012, China
3 Key Laboratory of Functional Materials Physics and Chemistry of the Ministry of Education, Jilin Normal University, Siping 136000, China
4 Guangxi Key Laboratory of Precision Navigation Technology and Application, Guilin University of Electronic Technology, Guilin 541004, China |
|
|
|
|
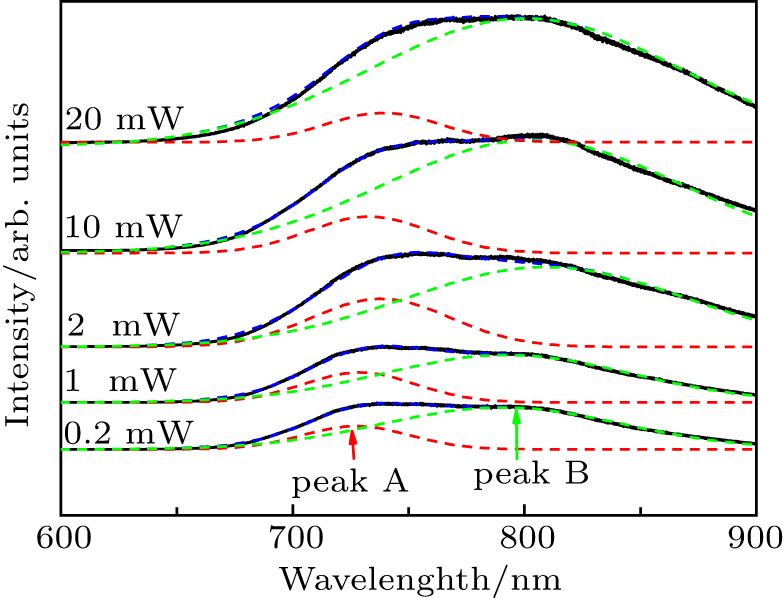
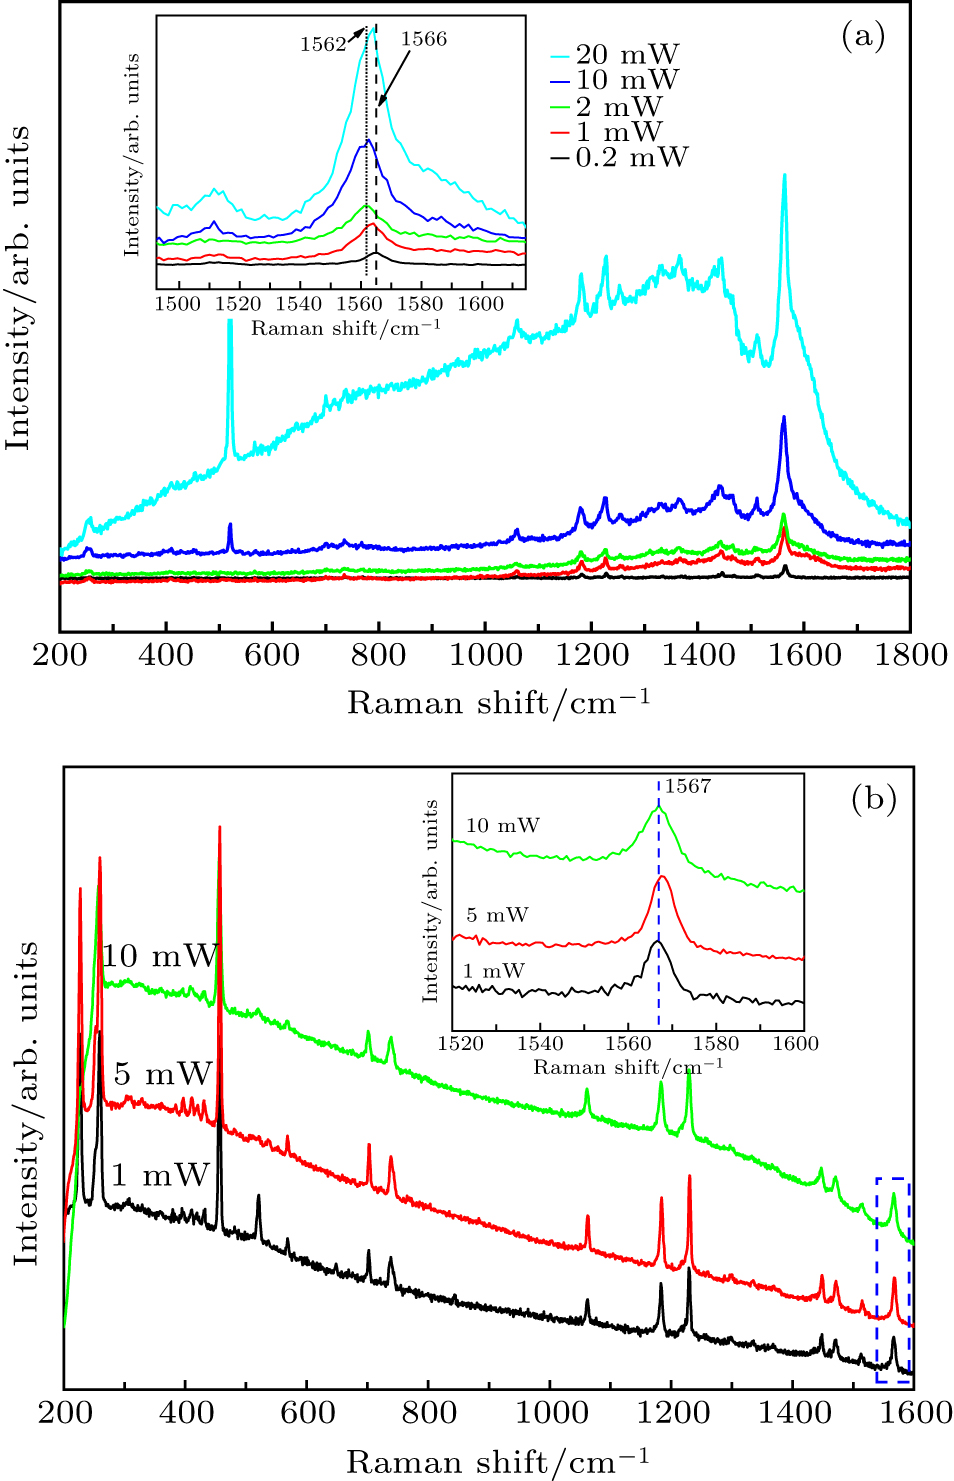
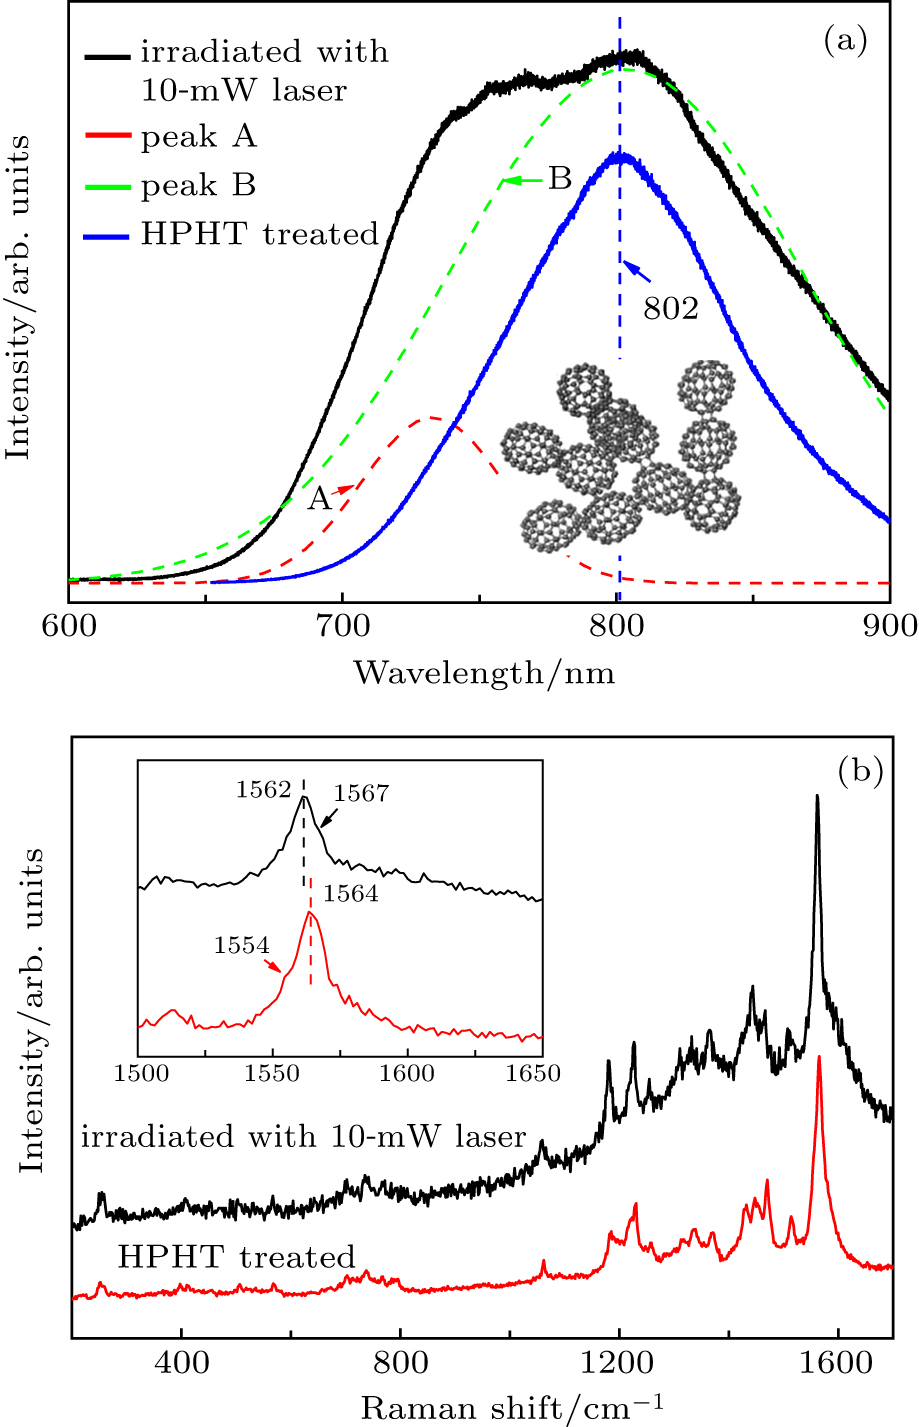
Abstract C70 nanotubes with a fcc lattice structure are polymerized through being irradiated by lasers with a wavelength of 514.5 nm at various power values. Raman spectra and photoluminescence (PL) spectra are employed to characterize the polymeric phases of the laser treated samples, showing that the disordered C70 oligomers are formed in the C70 nanotubes irradiated by such strong green lasers. Comparative studies further indicate that intermolecular bonds are formed between C70 molecules on the surface of nanotubes, which are similar to those formed under high pressure and high temperature (HPHT) conditions. And the content of intermolecular bonds increases obviously with the laser power increasing.
|
Received: 20 January 2020
Revised: 27 April 2020
Accepted manuscript online: 18 June 2020
|
|
PACS:
|
42.70.Gi
|
(Light-sensitive materials)
|
| |
68.35.Rh
|
(Phase transitions and critical phenomena)
|
| |
78.55.Hx
|
(Other solid inorganic materials)
|
| |
78.30.Na
|
(Fullerenes and related materials)
|
|
|
Corresponding Authors:
†Corresponding author. E-mail: liudedi@dlnu.edu.cn ‡Corresponding author. E-mail: iop84041@163.com
|
| About author: †Corresponding author. E-mail: liudedi@dlnu.edu.cn ‡Corresponding author. E-mail: iop84041@163.com * Project supported by the Natural Science Foundation of Liaoning Province, China (Grant Nos. 20180550100 and XLYC1807004), the National Natural Science Foundation of China (Grant No. 51772041), the Program for Dalian Excellent Talents, China (Grant No. 2017RQ148), and the Open Project of the Key Laboratory of Functional Materials Physics and Chemistry of the Ministry of Education, Jilin Normal University, China (Grant No. 20162016003). |
Cite this article:
Han-Da Wang(王汉达), De-Di Liu(刘德弟)†, Yang-Yang He(何洋洋), Hong-Sheng Jia(贾洪声)‡, Ran Liu(刘然), Bo Liu(刘波), Nai-Sen Yu(于乃森), and Zhen-Yi Zhang(张振翼) Photoluminescence changes of C70 nanotubes induced by laser irradiation 2020 Chin. Phys. B 29 104209
|
| [1] |
|
| [2] |
Briseno A L, Mannsfeld S C B, Ling M M, Liu S, Tseng R J, Reese C, Roberts M E, Yang Y, Wudl F, Bao Z 2006 Nature 444 913 DOI: 10.1038/nature05427 |
| [3] |
Wang L, Liu B B, Liu D D, Yao M G, Hou Y Y, Yu S D, Cui T, Li D M, Zou G T, Iwasiewicz A, Sundqvist B 2006 Adv. Mater. 18 1883 DOI: 10.1002/(ISSN)1521-4095 |
| [4] |
Geng J F, Zhou W Z, Skelton P, Yue W B, Kinloch I A, Windle A H, Johnson B F G 2008 J. Am. Chem. Soc. 130 2527 DOI: 10.1021/ja076392s |
| [5] |
|
| [6] |
Wang L, Liu B B, Li H, Yang W G, Ding Y, Sinogeikin S V, Meng Y, Liu Z X, Zeng X C, Mao W L 2012 Science 337 825 DOI: 10.1126/science.1220522 |
| [7] |
|
| [8] |
Wang L, Liu B B, Yu S D, Yao M G, Liu D D, Hou Y Y, Cui T, Zou G T 2006 Chem. Mater. 18 4190 DOI: 10.1021/cm060997q |
| [9] |
|
| [10] |
|
| [11] |
Liu D D, Cui W, Yu N S, Liu R, Liu D P, Xu Y B, Quan C S, Liu B, Li Q J, Liu B B 2014 CrystEngComm 16 3284 DOI: 10.1039/c3ce42201a |
| [12] |
|
| [13] |
|
| [14] |
Yao M G, Pischedda V, Mezouar M, Sundqvist B, Wagberg T, Debord R, San M A 2011 Phys. Rev B 84 144106 DOI: 10.1103/PhysRevB.84.144106 |
| [15] |
Liu D D, Yao M G, Li Q J, Cui W, Zou B, Cui T, Liu B B, Sundqvist B, Wagberg T 2011 CrystEngComm 13 3600 DOI: 10.1039/c0ce00953a |
| [16] |
Liu D D, Liu B B, Sundqvist B, Dong D P, Li Z H, Liu D P 2016 Sci. Rep. 6 38470 DOI: 10.1038/srep38470 |
| [17] |
|
| [18] |
|
| [19] |
Rao A M, Menon M, Wang K A, Eklund P C, Subbaswam K R, Cornett D S, Duncan M A, Amster I J 1994 Chem. Phys. Lett. 224 106 DOI: 10.1016/0009-2614(94)00497-8 |
| [20] |
Liu D D, Yao M G, Wang L, Li Q J, Cui W, Liu B, Liu R, Zou B, Cui T, Liu B B, Liu J, Sundqvist B, Wagberg T 2011 J. Phys. Chem. C 115 8918 DOI: 10.1021/jp2005666 |
| [21] |
|
| [22] |
|
| [23] |
Jishi R A, Mirie R M, Dresselhaus M S, Dresselhaus G, Eklaud P C 1993 Phys. Rev. B 48 5634 DOI: 10.1103/PhysRevB.48.5634 |
| [24] |
|
| [25] |
|
| No Suggested Reading articles found! |
|
|
Viewed |
|
|
|
Full text
|
|
|
|
|
Abstract
|
|
|
|
|
Cited |
|
|
|
|
Altmetric
|
|
blogs
Facebook pages
Wikipedia page
Google+ users
|
Online attention
Altmetric calculates a score based on the online attention an article receives. Each coloured thread in the circle represents a different type of online attention. The number in the centre is the Altmetric score. Social media and mainstream news media are the main sources that calculate the score. Reference managers such as Mendeley are also tracked but do not contribute to the score. Older articles often score higher because they have had more time to get noticed. To account for this, Altmetric has included the context data for other articles of a similar age.
View more on Altmetrics
|
|
|