| ELECTROMAGNETISM, OPTICS, ACOUSTICS, HEAT TRANSFER, CLASSICAL MECHANICS, AND FLUID DYNAMICS |
Prev
Next
|
|
|
Actively tunable polarization-sensitive multiband absorber based on graphene |
| Ai-Li Cao(曹爱利), Kun Zhang(张昆)†, Jia-Rui Zhang(张佳瑞), Yan Liu(刘燕), and Wei-Jin Kong(孔伟金)‡ |
| College of Physics Science, Center for Marine Observation and Communications, Qingdao University, Qingdao 266071, China |
|
|
|
|
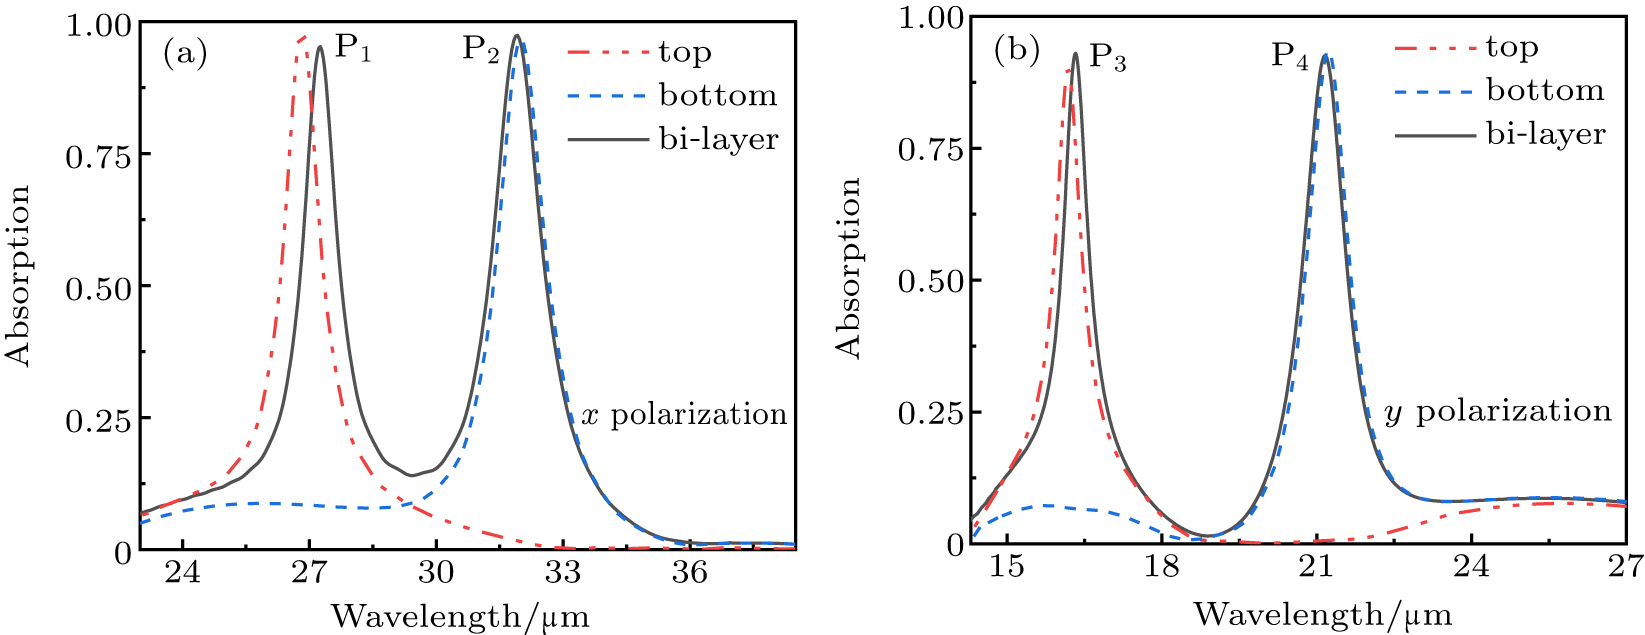
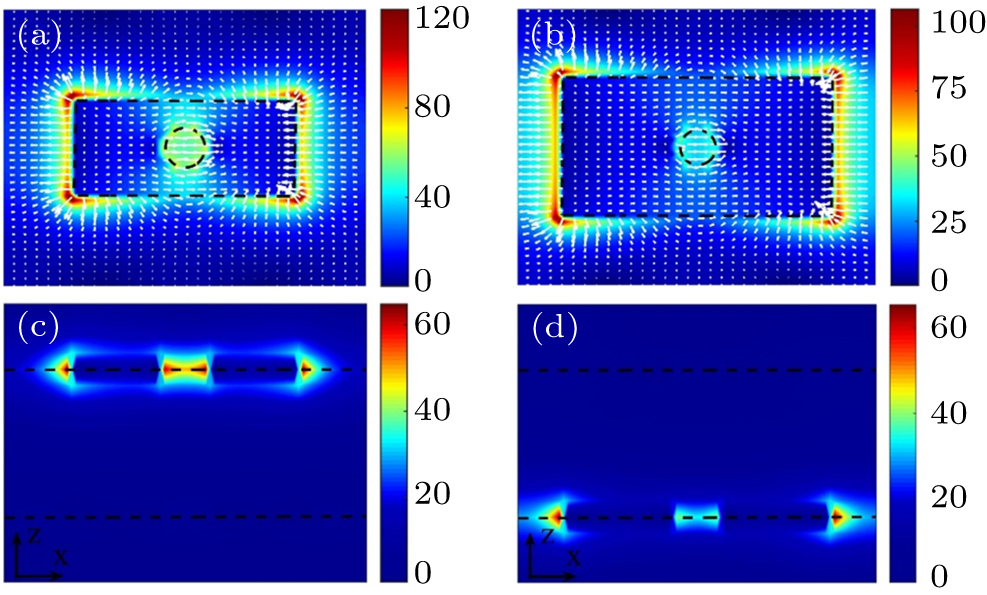
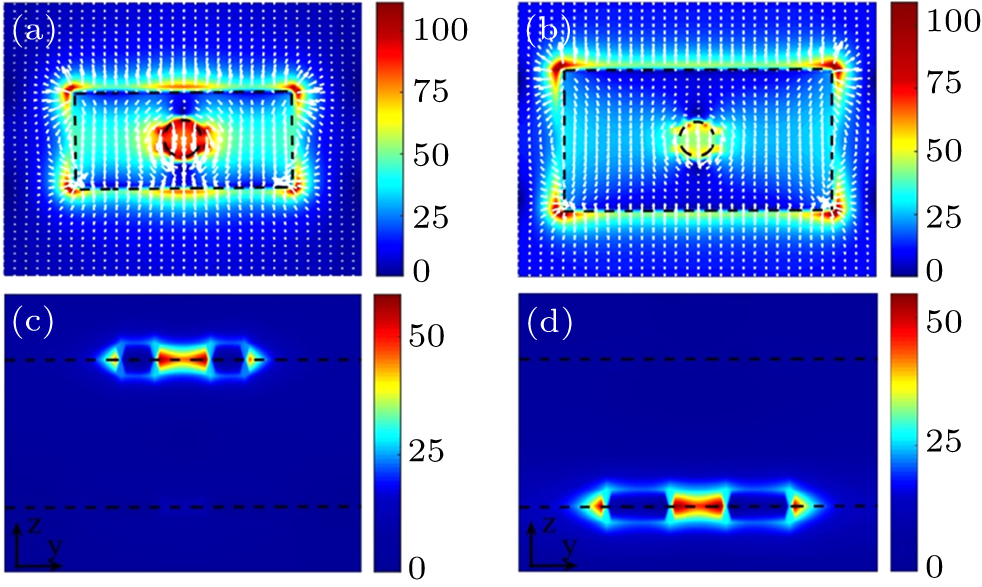
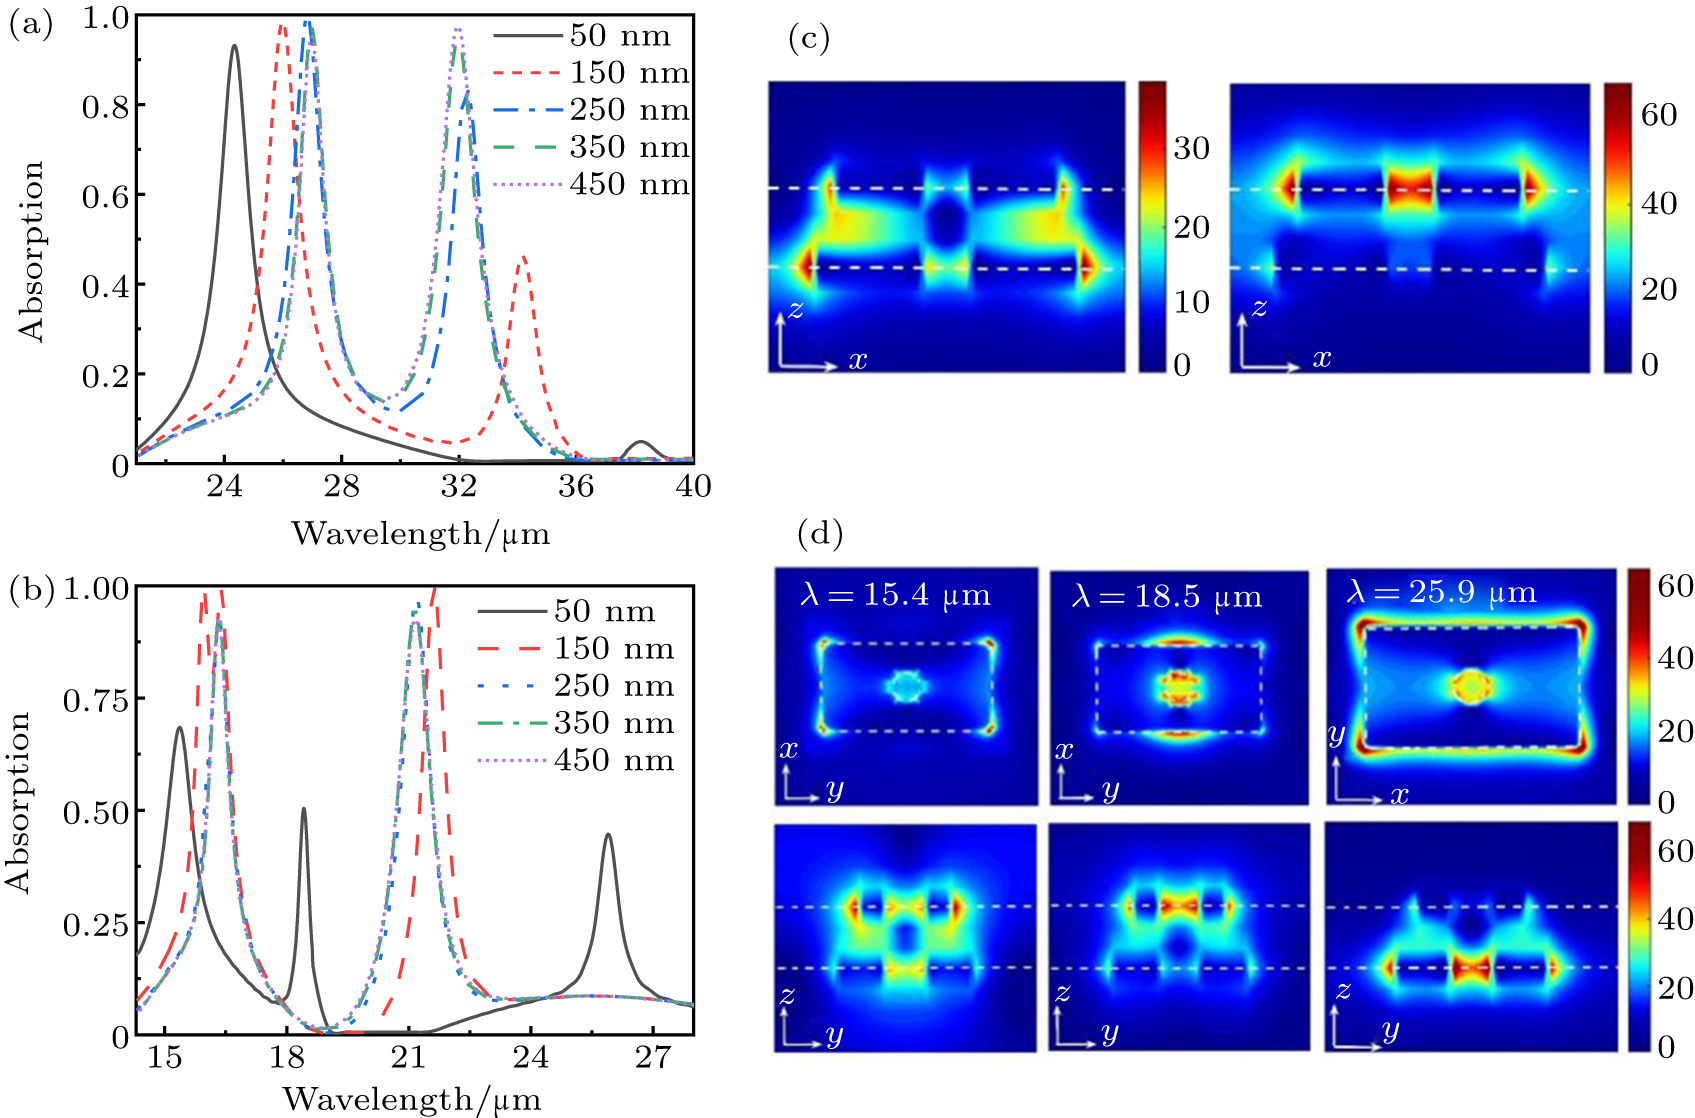
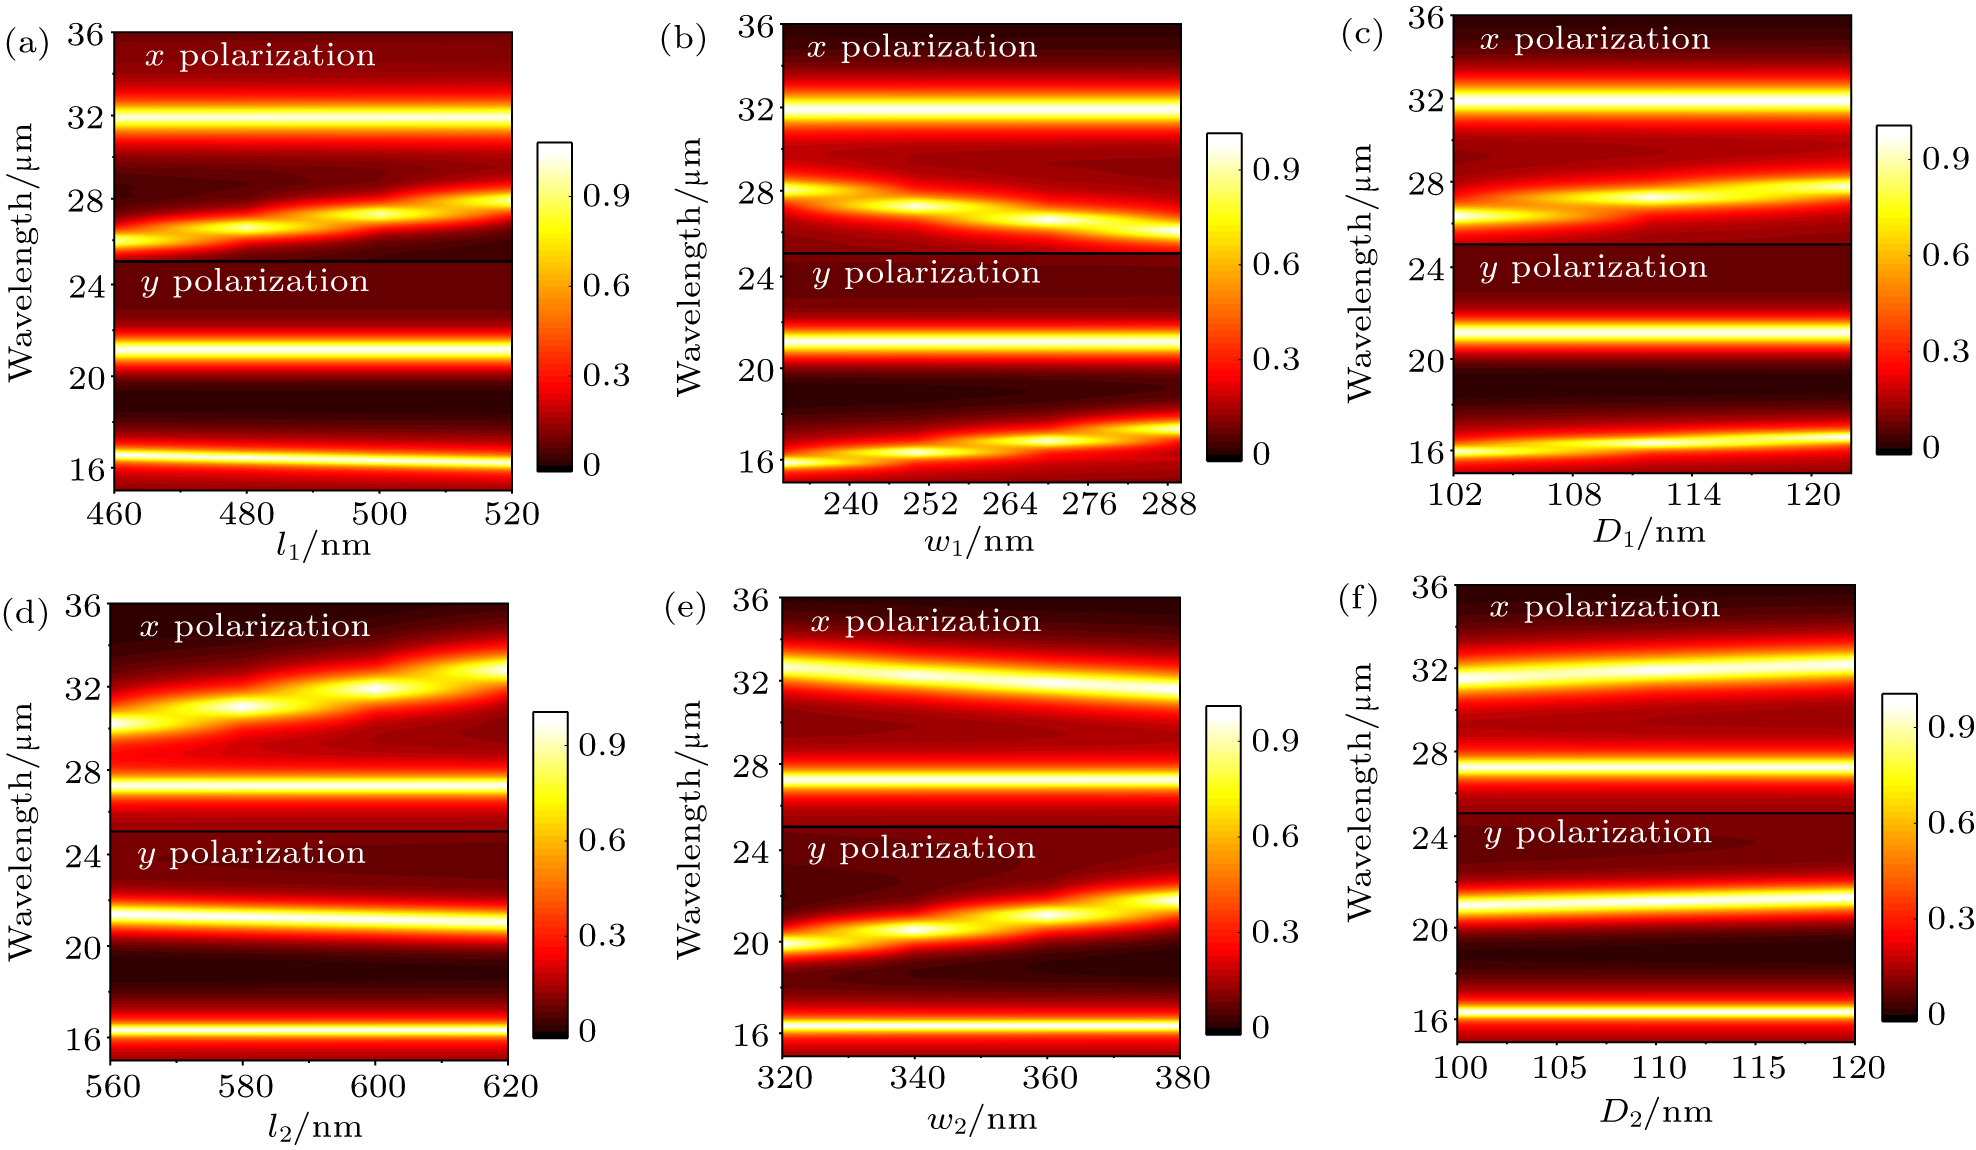
Abstract We design an actively tunable polarization-sensitive multiband absorber in the mid-infrared region, which consists of stacked graphene multilayers separated by dielectric layers on a metal mirror. Benefiting from the anisotropic structure, the absorber has dual absorption bands with almost perfect absorption at different wavelengths under the x and y polarizations. Analyzing the electric field amplitude distributions and the surface currents, we find that the absorption peaks under the same polarization are excited in the graphene layers independently. Therefore, more absorption bands can be achieved by increasing the graphene layers. Adjusting the Fermi energy of the graphene layers, the working wavelengths of the polarization-sensitive multiband absorbers can be tuned actively, and thus achieving a wide band regulation range. Besides, the peak number and the peak strength of the multiband absorber can be actively controlled by the polarization angle as well. We also propose a method to design an actively tunable polarization-sensitive multiband absorber, which may have potential applications in mid-infrared devices, such as polarization-sensitive filters and detectors.
|
Received: 03 July 2020
Revised: 12 August 2020
Accepted manuscript online: 09 September 2020
|
| Fund: the National Natural Science Foundation of China (Grant Nos. 11804178 and 11274188) and the Natural Science Foundation of Shandong Province, China (Grant No. ZR2018BA027). |
|
Corresponding Authors:
†Corresponding author. E-mail: zkun@qdu.edu.cn ‡Corresponding author. E-mail: kwjsd@163.com
|
Cite this article:
Ai-Li Cao(曹爱利), Kun Zhang(张昆), Jia-Rui Zhang(张佳瑞), Yan Liu(刘燕), and Wei-Jin Kong(孔伟金) Actively tunable polarization-sensitive multiband absorber based on graphene 2020 Chin. Phys. B 29 114205
|
| [1] |
|
| [2] |
|
| [3] |
|
| [4] |
Schurig D, Mock J J, Justice B J, Cummer S A, Pendry J B, Starr A F, Smith D R 2006 Science 314 977 DOI: 10.1126/science.1133628 |
| [5] |
|
| [6] |
|
| [7] |
|
| [8] |
Liu N, Mesch M, Weiss T, Hentschel M, Giessen H 2010 Nano Lett. 10 2342 DOI: 10.1021/nl9041033 |
| [9] |
|
| [10] |
|
| [11] |
|
| [12] |
Zhu J F, Ma Z F, Sun W J, Ding F, He Q, Zhou L, Ma Y G 2014 Appl. Phys. Lett. 105 021102 DOI: 10.1063/1.4890521 |
| [13] |
Novoselov K S, Fal’ko V I, Colombo L, Gellert P R, Schwab M G, Kim K 2012 Nature 490 192 DOI: 10.1038/nature11458 |
| [14] |
|
| [15] |
Novoselov K S, Jiang D, Schedin F, Booth T J, Khotkevich V V, Morozov S V, Geim A K 2005 Proc. Natl. Acad. Sci. USA 102 10451 DOI: 10.1073/pnas.0502848102 |
| [16] |
|
| [17] |
Sun P, You C L, Mahigir A, Liu T T, Xia F, Kong W J, Veronis G, Dowling J P, Dong L F, Yun M J 2018 Nanoscale 10 15564 DOI: 10.1039/C8NR02525H |
| [18] |
Fang Z Y, Wang Y M, Schlather A E, Liu Z, Ajayan P M, de Abajo F J G, Nordlander P, Zhu X, Halas N J 2014 Nano Lett. 14 299 DOI: 10.1021/nl404042h |
| [19] |
|
| [20] |
|
| [21] |
Bao Z Y, Wang J C, Hu Z D, Balmakou A, Khakhomov S, Tang Y, Zhang C L 2019 Opt. Express 27 31435 DOI: 10.1364/OE.27.031435 |
| [22] |
Hu J, Liu W, Xie W, Zhang W, Yao E, Zhang Y, Zhan Q 2019 Opt. Lett. 44 5642 DOI: 10.1364/OL.44.005642 |
| [23] |
|
| [24] |
|
| [25] |
|
| [26] |
|
| [27] |
|
| [28] |
Xia Y Y, Dai Y, Wang B, Chen A, Zhang Y B, Zhang Y W, Guan F, Liu X H, Shi L, Zi J 2019 Opt. Express 27 1080 DOI: 10.1364/OE.27.001080 |
| [29] |
|
| [30] |
Zhang J F, Zhu Z H, Liu W, Yuan X D, Qin S Q 2015 Nanoscale 7 13530 DOI: 10.1039/C5NR03060A |
| [31] |
|
| [32] |
Bao Q L, Zhang H, Wang B, Ni Z H, Lim C H Y X, Wang Y, Tang D Y, Loh K P 2011 Nat. Photon. 5 411 DOI: 10.1038/nphoton.2011.102 |
| [33] |
|
| [34] |
|
| [35] |
|
| [36] |
Koppens F H L, Chang D E, de Abajo F J G 2011 Nano Lett. 11 3370 DOI: 10.1021/nl201771h |
| [37] |
Novoselov K S, Geim A K, Morozov S V, Jiang D, Zhang Y, Dubonos S V, Grigorieva I V, Firsov A A 2004 Science 306 666 DOI: 10.1126/science.1102896 |
| [38] |
|
| No Suggested Reading articles found! |
|
|
Viewed |
|
|
|
Full text
|
|
|
|
|
Abstract
|
|
|
|
|
Cited |
|
|
|
|
Altmetric
|
|
blogs
Facebook pages
Wikipedia page
Google+ users
|
Online attention
Altmetric calculates a score based on the online attention an article receives. Each coloured thread in the circle represents a different type of online attention. The number in the centre is the Altmetric score. Social media and mainstream news media are the main sources that calculate the score. Reference managers such as Mendeley are also tracked but do not contribute to the score. Older articles often score higher because they have had more time to get noticed. To account for this, Altmetric has included the context data for other articles of a similar age.
View more on Altmetrics
|
|
|