| ELECTROMAGNETISM, OPTICS, ACOUSTICS, HEAT TRANSFER, CLASSICAL MECHANICS, AND FLUID DYNAMICS |
Prev
Next
|
|
|
Generation and manipulation of bright spatial bound-soliton pairs under the diffusion effect in photovoltaic photorefractive crystals |
| Ze-Xian Zhang(张泽贤), Xiao-Yang Zhao(赵晓阳), Ye Li(李烨), Hu Cui(崔虎)†, Zhi-Chao Luo(罗智超), Wen-Cheng Xu(徐文成), and Ai-Ping Luo(罗爱平) |
| 1 Guangdong Provincial Key Laboratory of Nanophotonic Functional Materials and Devices & Guangzhou Key Laboratory for Special Fiber Photonic Devices and Applications, South China Normal University, Guangzhou 510006, China |
|
|
|
|
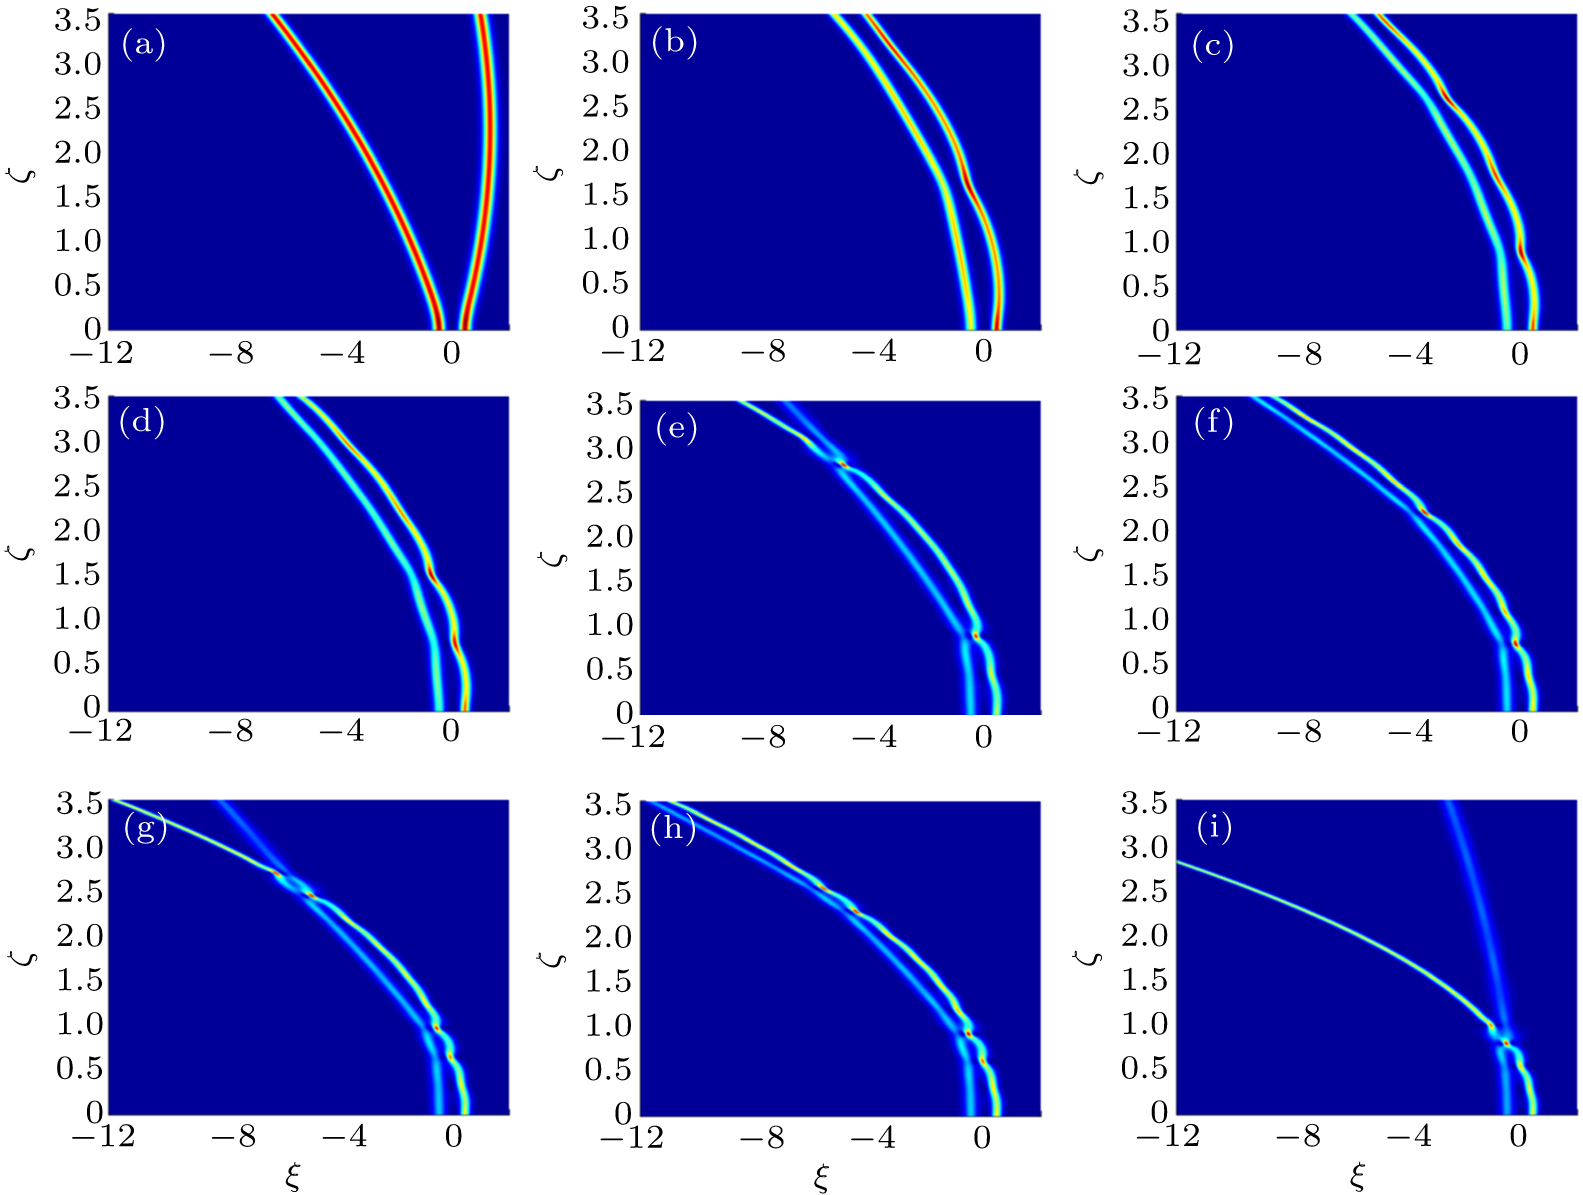
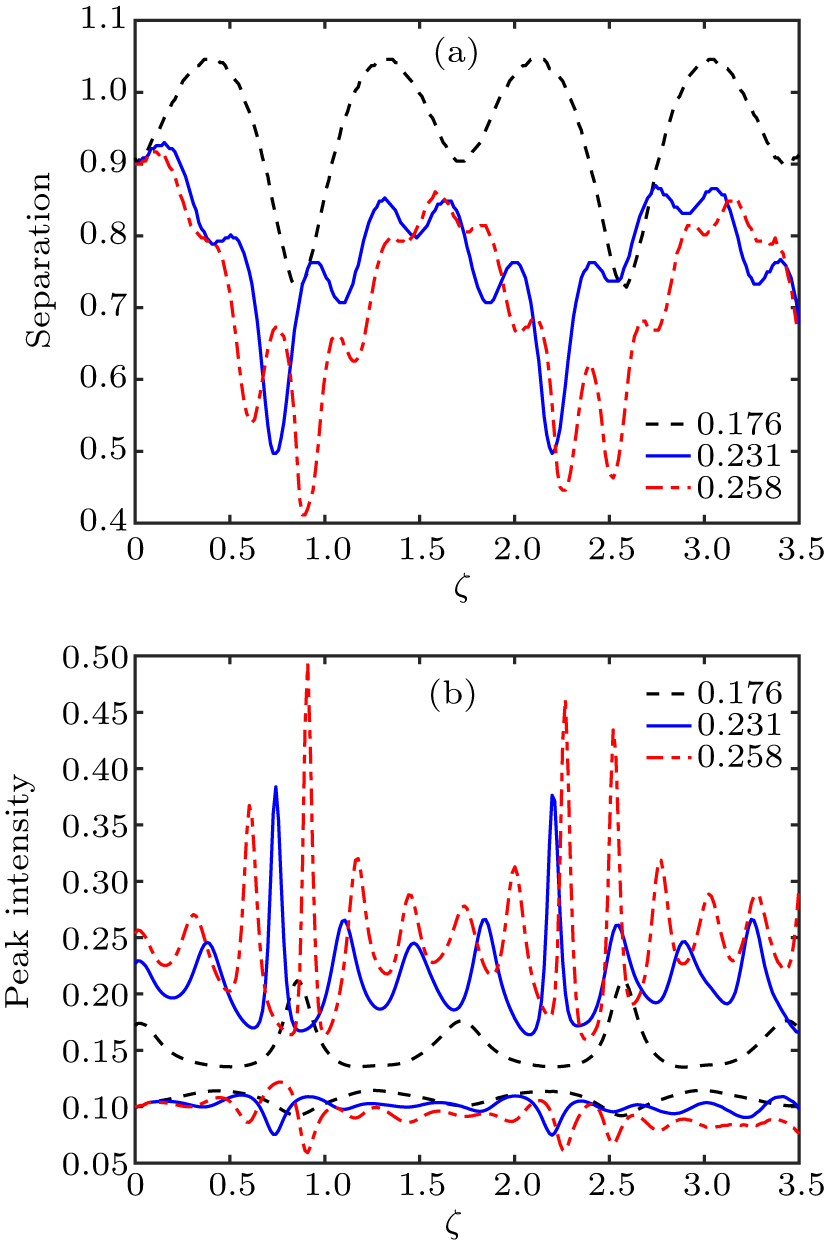
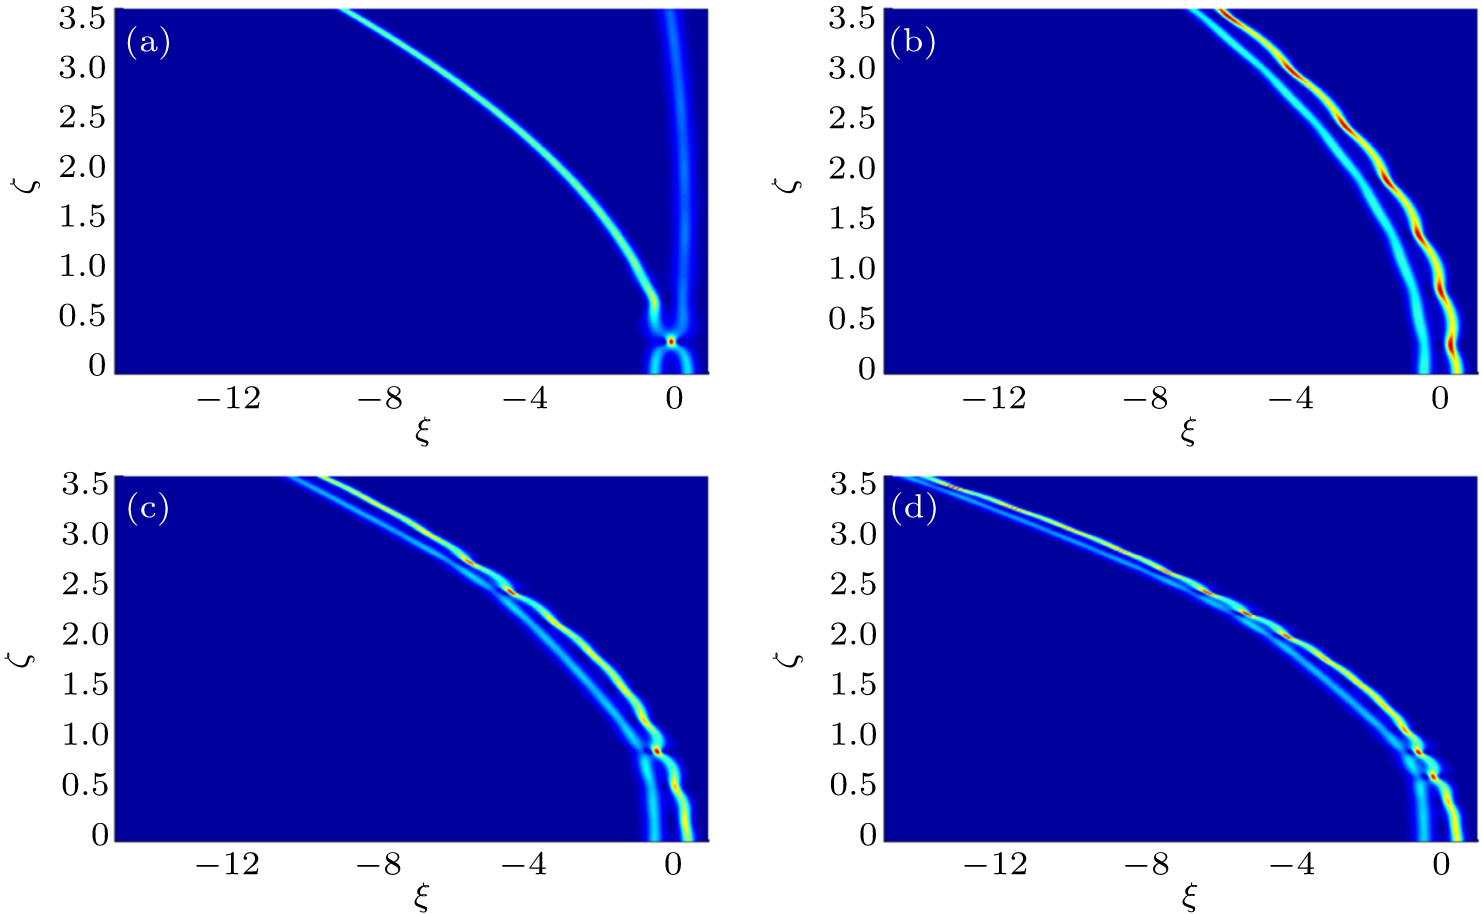
Abstract The generation and propagation characteristics of bright spatial bound-soliton pairs (BSPs) are investigated under the diffusion effect in photovoltaic photorefractive crystals by numerical simulation. The results show that two coherent solitons, one as the signal light and the other as the control light, can form a BSP when the peak intensity of the control light is appropriately selected. Moreover, under the diffusion effect, the BSP experiences a self-bending process during propagating and the center of the BSP moves on a parabolic trajectory. Furthermore, the lateral shift of the BSP at the output face of the crystal can be manipulated by adjusting the peak intensity of the control light. The research results provide a method for the design of all-optical switching and routing based on the manipulation of the lateral position of BSPs.
|
Received: 12 May 2020
Revised: 15 June 2020
Accepted manuscript online: 01 August 2020
|
|
PACS:
|
42.65.Tg
|
(Optical solitons; nonlinear guided waves)
|
| |
42.65.-k
|
(Nonlinear optics)
|
|
|
Corresponding Authors:
†Corresponding author. E-mail: cuihu@m.scnu.edu.cn
|
| About author: †Corresponding author. E-mail: cuihu@m.scnu.edu.cn * Project supported by the National Natural Science Foundation of China (Grant Nos. 61875058, 11874018, 11974006, and 61378036). |
Cite this article:
Ze-Xian Zhang(张泽贤), Xiao-Yang Zhao(赵晓阳), Ye Li(李烨), Hu Cui(崔虎)†, Zhi-Chao Luo(罗智超), Wen-Cheng Xu(徐文成), and Ai-Ping Luo(罗爱平) Generation and manipulation of bright spatial bound-soliton pairs under the diffusion effect in photovoltaic photorefractive crystals 2020 Chin. Phys. B 29 104208
|
| [1] |
|
| [2] |
|
| [3] |
|
| [4] |
|
| [5] |
Yang C Y, Li W Y, Yu W T, Liu M L, Zhang Y J, Ma G L, Lei M, Liu W J 2018 Nonlinear Dyn. 92 203 DOI: 10.1007/s11071-018-4049-9 |
| [6] |
|
| [7] |
|
| [8] |
|
| [9] |
|
| [10] |
|
| [11] |
|
| [12] |
|
| [13] |
Soysouvanh S, Phongsanam P, Mitatha S, Ali J, Yupapin P, Amiri I S, Grattan K T V, Yoshida M 2019 Microsyst. Technol. 25 431 DOI: 10.1007/s00542-018-4011-2 |
| [14] |
|
| [15] |
Laudyn U A, Piccardi A, Kwasny M, Karpierz M A, Assanto G 2018 Opt. Lett. 43 2296 DOI: 10.1364/OL.43.002296 |
| [16] |
|
| [17] |
|
| [18] |
|
| [19] |
|
| [20] |
|
| [21] |
|
| [22] |
|
| [23] |
|
| [24] |
|
| [25] |
Lu K Q, Zhang M Z, Zhao W, Yang Y L, Yang Y, Zhang Y H, Liu X M, Zhang Y P, Song J P 2006 Chin. Phys. Lett. 23 2770 DOI: 10.1088/0256-307X/23/10/040 |
| [26] |
|
| [27] |
|
| [28] |
|
| [29] |
|
| [30] |
|
| [31] |
|
| [32] |
|
| [33] |
|
| [34] |
|
| [35] |
|
| No Suggested Reading articles found! |
|
|
Viewed |
|
|
|
Full text
|
|
|
|
|
Abstract
|
|
|
|
|
Cited |
|
|
|
|
Altmetric
|
|
blogs
Facebook pages
Wikipedia page
Google+ users
|
Online attention
Altmetric calculates a score based on the online attention an article receives. Each coloured thread in the circle represents a different type of online attention. The number in the centre is the Altmetric score. Social media and mainstream news media are the main sources that calculate the score. Reference managers such as Mendeley are also tracked but do not contribute to the score. Older articles often score higher because they have had more time to get noticed. To account for this, Altmetric has included the context data for other articles of a similar age.
View more on Altmetrics
|
|
|