| INTERDISCIPLINARY PHYSICS AND RELATED AREAS OF SCIENCE AND TECHNOLOGY |
Prev
Next
|
|
|
Hydrothermal synthesis and characterization of carbon-doped TiO2 nanoparticles |
| Zafar Ali1, Javaid Ismail1, Rafaqat Hussain2, A. Shah3, Arshad Mahmood3, Arbab Mohammad Toufiq4, and Shams ur Rahman1, † |
1 Department of Physics, COMSATS University Islamabad, Park Road, Islamabad 45550, Pakistan
2 Department of Chemistry, COMSATS University Islamabad, Park Road, Islamabad 45550, Pakistan
3 National Institute of Lasers and Optronics College, Pakistan Institute of Engineering and Applied Sciences (NILOP-C, PIEAS), Nilore 45650, Islamabad, Pakistan
4 Department of Physics, Hazara University Mansehra, Mansehra 21300, Pakistan |
|
|
|
|
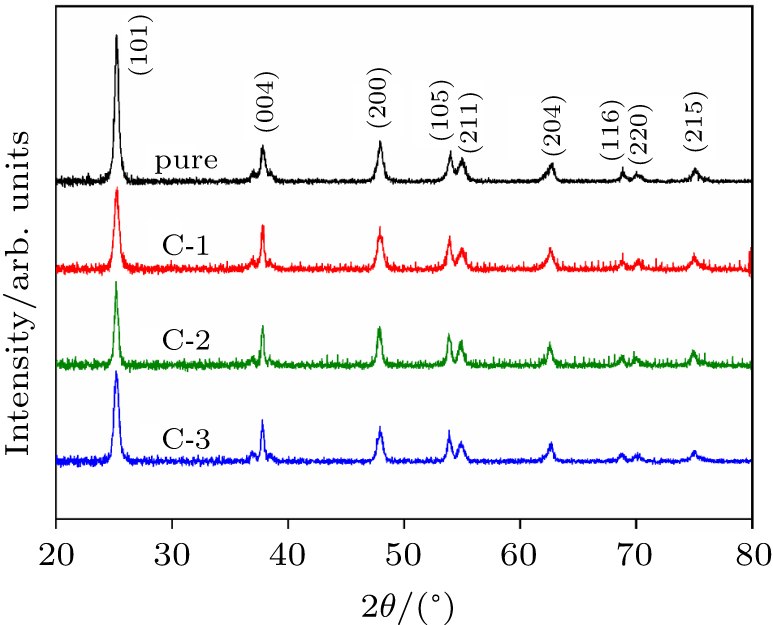
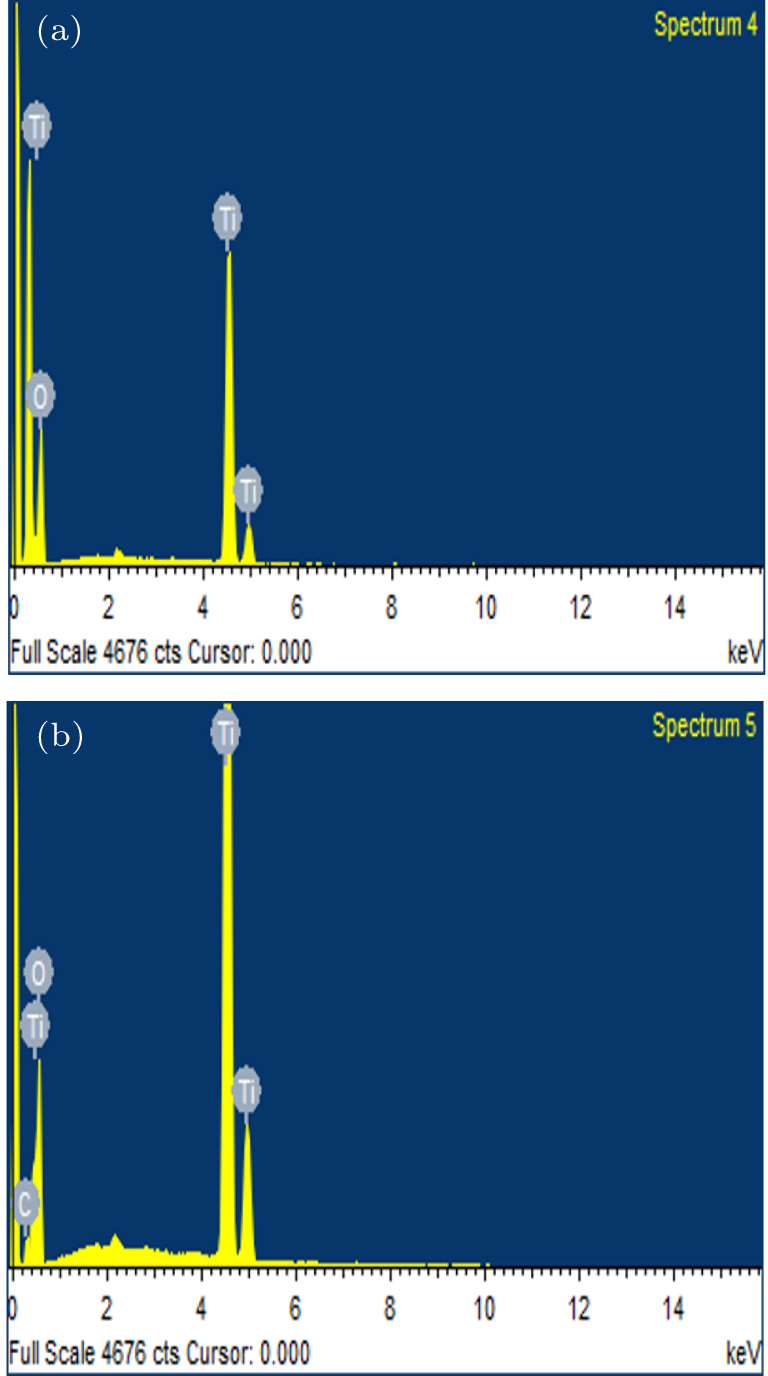
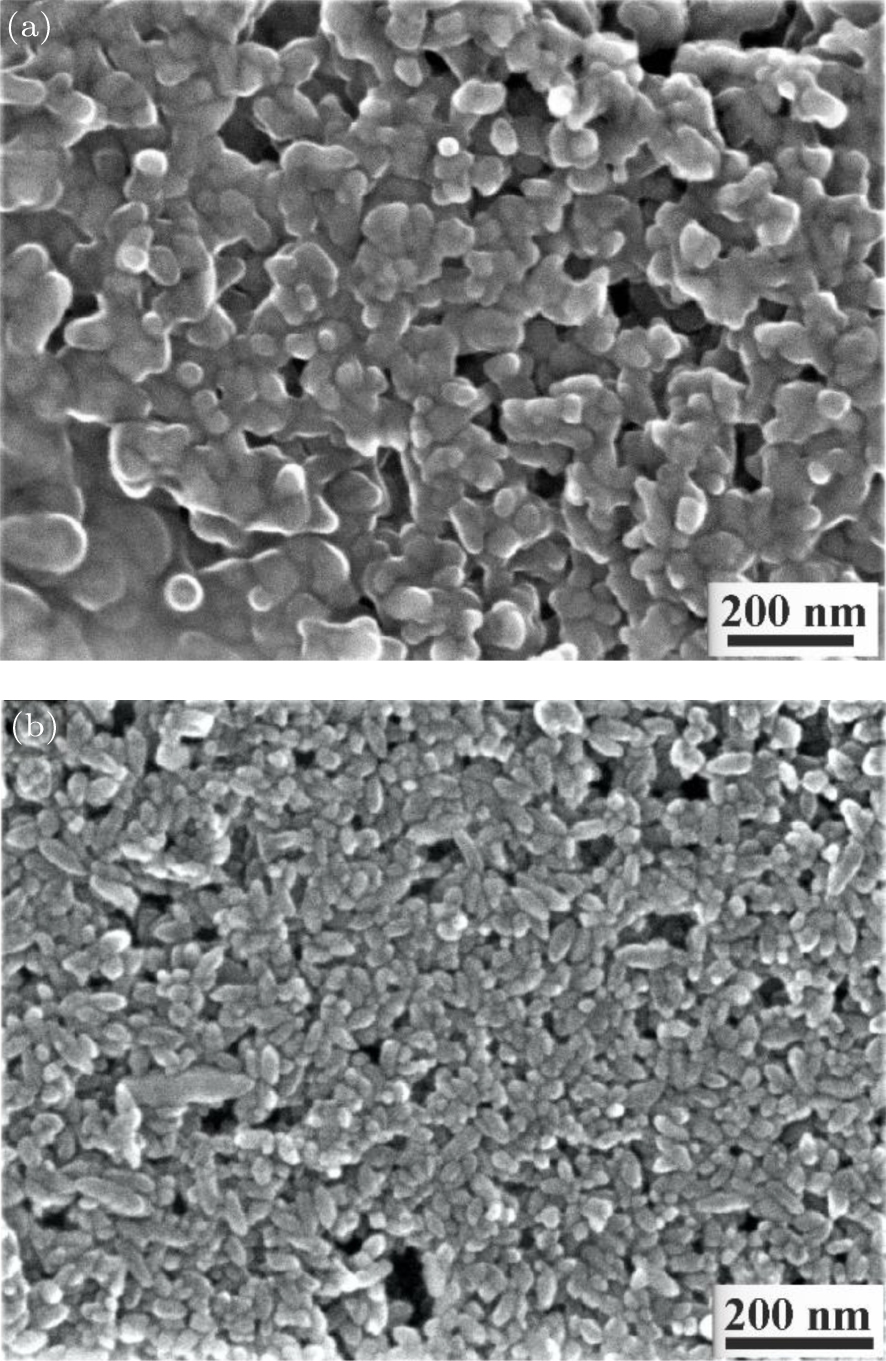
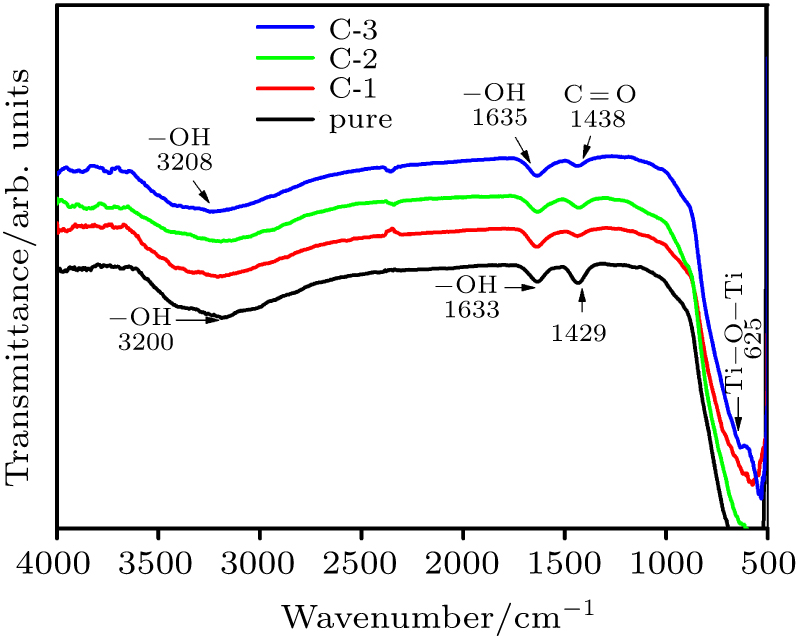
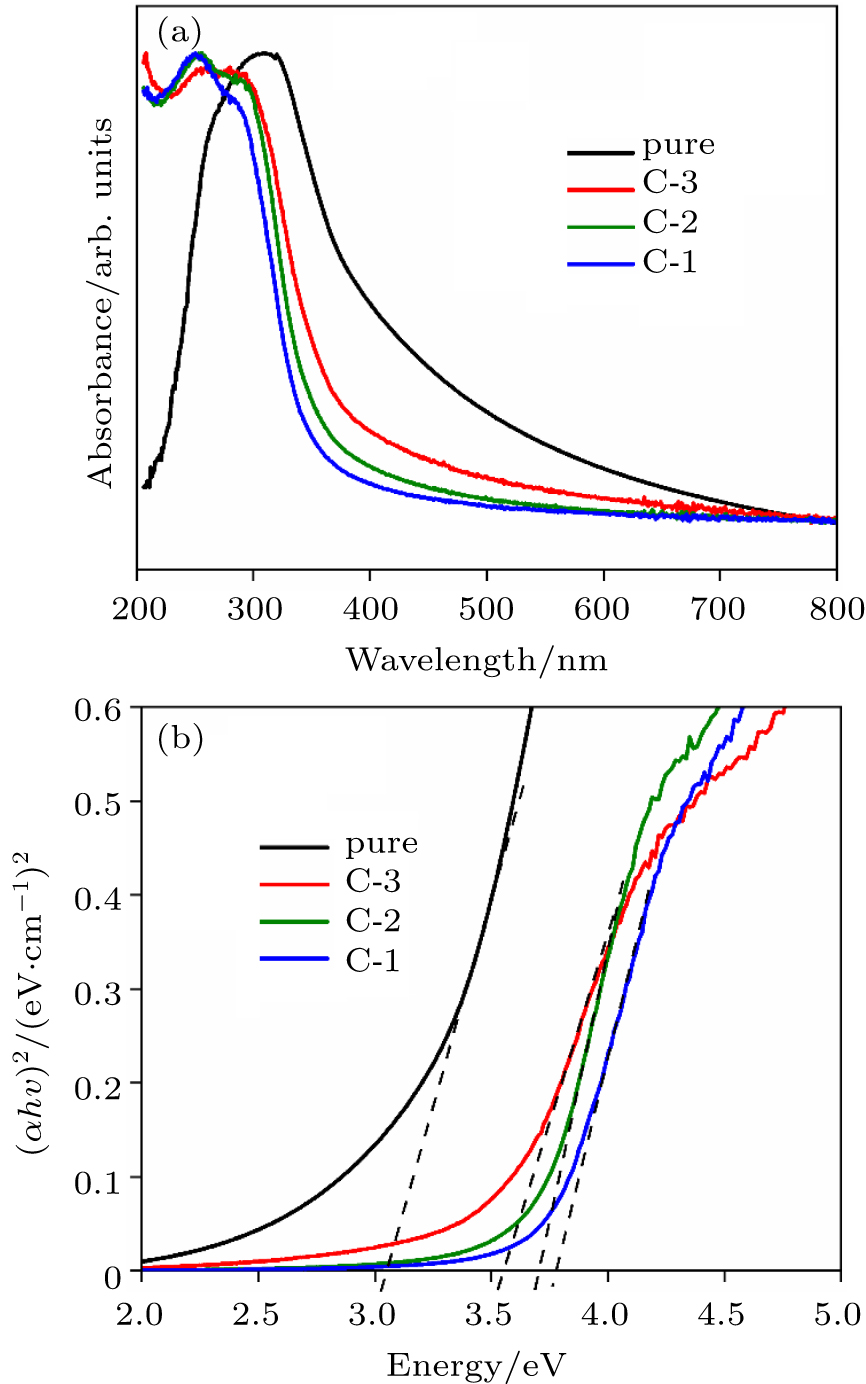
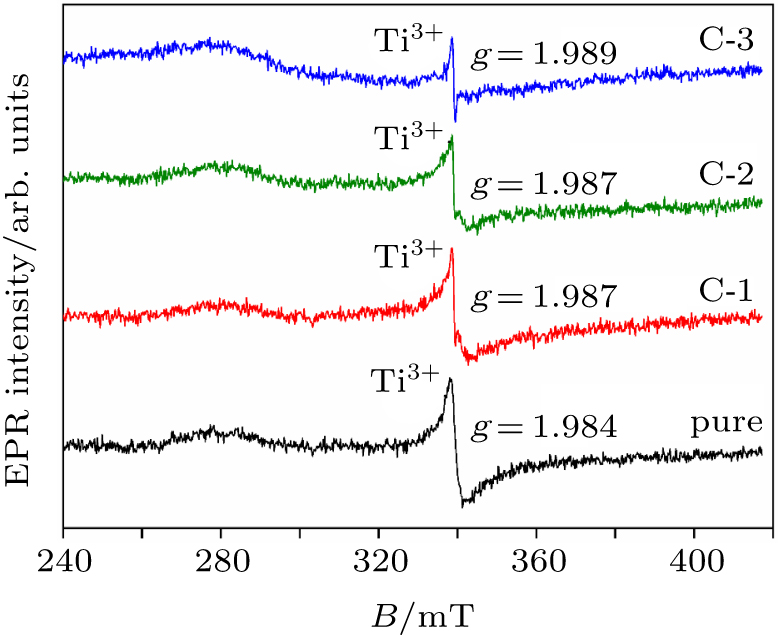
Abstract We report the hydrothermal growth of pure and doped TiO2 nanoparticles with different concentrations of carbon. The microstructure of the as-synthesized samples is characterized by x-ray diffraction (XRD), field emission scanning electron microscopy (FESEM), energy dispersive x-ray spectroscopy (EDX), and Raman spectroscopy to understand the structure and composition. The XRD patterns confirm the formation of anatase phase of TiO2 with the average crystallite size is calculated to be in the range of 13 nm to 14.7 nm. The functional groups of these nanostructures are characterized by Fourier transformed infrared (FT-IR) spectroscopy, which further confirms the single anatase phase of the synthesized nanostructures. UV-visible absorption spectroscopy is used to understand the absorption behavior, which shows modification in the optical bandgap from 3.13 eV (pure TiO2) to 3.74 eV (1.2 mol% C-doped TiO2). Furthermore, the Ti3+ centers associated with oxygen vacancies are identified using electron paramagnetic resonance spectroscopy (EPR).
|
Received: 17 April 2020
Revised: 03 June 2020
Accepted manuscript online: 23 June 2020
|
| Fund: The authors would like to thank the Higher Education Commission of Pakistan for providing funding (NRPU project 5349/Federal/NRPU/R&D/HEC/2016). |
|
Corresponding Authors:
†Corresponding author. E-mail: vitto.han@gmail.com
|
Cite this article:
Zafar Ali, Javaid Ismail, Rafaqat Hussain, A. Shah, Arshad Mahmood, Arbab Mohammad Toufiq, and Shams ur Rahman Hydrothermal synthesis and characterization of carbon-doped TiO2 nanoparticles 2020 Chin. Phys. B 29 118102
|
| [1] |
Khan A, Toufiq A M, Tariq F, Khan Y, Hussain R, Akhtar N, Rahman S U 2019 Mater. Res. Express. 6 065043 DOI: 10.1088/2053-1591/ab0aaf |
| [2] |
|
| [3] |
Zhang G, Xiao X, Li B, Gu P, Xue H, Pang H 2017 J. Mater. Chem. A 5 8155 DOI: 10.1039/C7TA02454A |
| [4] |
|
| [5] |
Vardi N, Anouchi E, Yamin T, Middey S, Kareev M, Chakhalian J, Dubi Y, Sharoni A 2017 Adv. Mater. 29 1605029 DOI: 10.1002/adma.201605029 |
| [6] |
|
| [7] |
Yin Z, Tordjman M, Lee Y, Vardi A, Kalish R, del Alamo J A 2018 Sci. Adv. 4 eaau0480 DOI: 10.1126/sciadv.aau0480 |
| [8] |
|
| [9] |
|
| [10] |
|
| [11] |
Huang Y, Guo Z, Liu H, Zhang S, Wang P, Lu J, Tong Y 2019 Adv. Funct. Mater. 29 1903490 DOI: 10.1002/adfm.v29.45 |
| [12] |
|
| [13] |
|
| [14] |
Smith S J, Stevens R, Liu S, Li G, Navrotsky A, Boerio-Goates J, Woodfield B F 2009 Am. Mineral. 94 236 DOI: 10.2138/am.2009.3050 |
| [15] |
|
| [16] |
|
| [17] |
|
| [18] |
Wu T, Kong W, Zhang Y, Xing Z, Zhao J, Wang T, Shi X, Luo Y, Sun X 2019 small Methods 3 1900356 DOI: 10.1002/smtd.v3.11 |
| [19] |
Wu T, Zhu X, Xing Z, Mou S, Li C, Qiao Y, Liu Q, Luo Y, Shi X, Zhang Y, Sun X 2019 Angew. Chem. Int. Ed. 58 18449 DOI: 10.1002/anie.v58.51 |
| [20] |
Li B, Zhu X, Wang J, Xing R, Liu Q, Shi X, Luo Y, Liu S, Niu X, Sun X 2020 Chem. Comm. 56 1074 DOI: 10.1039/C9CC08971C |
| [21] |
|
| [22] |
Wang J, Tafen D N, Lewis J P, Hong Z, Manivannan A, Zhi M, Li M, Wu N 2009 J. Am. Chem. Soc. 131 12290 DOI: 10.1021/ja903781h |
| [23] |
|
| [24] |
|
| [25] |
Umebayashi T, Yamaki T, Itoh H, Asai K 2002 Appl. Phys. Lett. 81 454 DOI: 10.1063/1.1493647 |
| [26] |
|
| [27] |
Ali M, Hussain R, Tariq F, Noreen Z, Toufiq A M, Bokhari H, Akhtar N, ur Rahman S 2020 Appl. Nanosci. 10 1005 DOI: 10.1007/s13204-019-01193-0 |
| [28] |
|
| [29] |
Noorimotlagh Z, Kazeminezhad I, Jaafarzadeh N, Ahmadi M, Ramezani Z, Martinez S S 2018 J. Hazard. Mater. 350 108 DOI: 10.1016/j.jhazmat.2018.02.022 |
| [30] |
|
| [31] |
Yang G, Jiang Z, Shi H, Xiao T, Yan Z 2010 J. Mater. Chem. 20 5301 DOI: 10.1039/C0JM00376J |
| [32] |
|
| [33] |
Sim L C, Leong K H, Ibrahim S, Saravanan P 2014 J. Mater. Chem. A 2 5315 DOI: 10.1039/C3TA14857B |
| [34] |
|
| [35] |
|
| [36] |
|
| [37] |
|
| [38] |
|
| [39] |
|
| [40] |
|
| [41] |
|
| [42] |
|
| [43] |
Lu X H, Huang X, Xie S L, Zheng D Z, Liu Z Q, Liang C L, Tong Y X 2010 Langmuir 26 7569 DOI: 10.1021/la904882t |
| [44] |
Pham C V, Krueger M, Eck M, Weber S, Erdem E 2014 Appl. Phys. Lett. 104 132102 DOI: 10.1063/1.4870297 |
| [45] |
Lund A, Shiotani M, Shimada S 2011 Principles and applications of ESR spectroscopy New York Springer 91
|
| [46] |
Zhou S, Čižmár E, Potzger K, Krause M, Talut G, Helm M, Fassbender J, Zvyagin S, Wosnitza J, Schmidt H 2009 Phys. Rev. B 79 113201 DOI: 10.1103/PhysRevB.79.113201 |
| [47] |
Hurum D C, Gray K A, Rajh T, Thurnauer M C 2005 J. Phys. Chem. B 109 977 DOI: 10.1021/jp045395d |
| [48] |
|
| [49] |
|
| [50] |
|
| [51] |
Yoon S D, Chen Y, Yang A, Goodrich T L, Zuo X, Arena D A, Ziemer K, Vittoria C, Harris V G 2006 J. Phys.: Condens. Matter 18 L355 DOI: 10.1088/0953-8984/18/27/L01 |
| [52] |
|
| No Suggested Reading articles found! |
|
|
Viewed |
|
|
|
Full text
|
|
|
|
|
Abstract
|
|
|
|
|
Cited |
|
|
|
|
Altmetric
|
|
blogs
Facebook pages
Wikipedia page
Google+ users
|
Online attention
Altmetric calculates a score based on the online attention an article receives. Each coloured thread in the circle represents a different type of online attention. The number in the centre is the Altmetric score. Social media and mainstream news media are the main sources that calculate the score. Reference managers such as Mendeley are also tracked but do not contribute to the score. Older articles often score higher because they have had more time to get noticed. To account for this, Altmetric has included the context data for other articles of a similar age.
View more on Altmetrics
|
|
|