| INTERDISCIPLINARY PHYSICS AND RELATED AREAS OF SCIENCE AND TECHNOLOGY |
Prev
Next
|
|
|
A systematic study of light dependency of persistent photoconductivity in a-InGaZnO thin-film transistors |
| Yalan Wang(王雅兰), Mingxiang Wang(王明湘)†, Dongli Zhang(张冬利)‡, and Huaisheng Wang(王槐生) |
| School of Electronic and Information Engineering, Soochow University, Suzhou 215006, China |
|
|
|
|
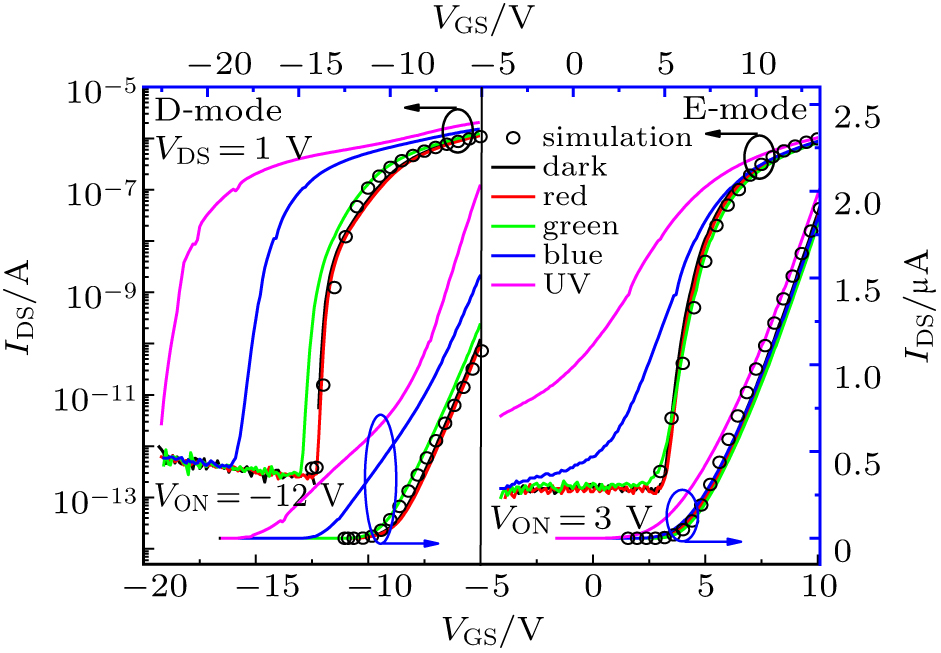
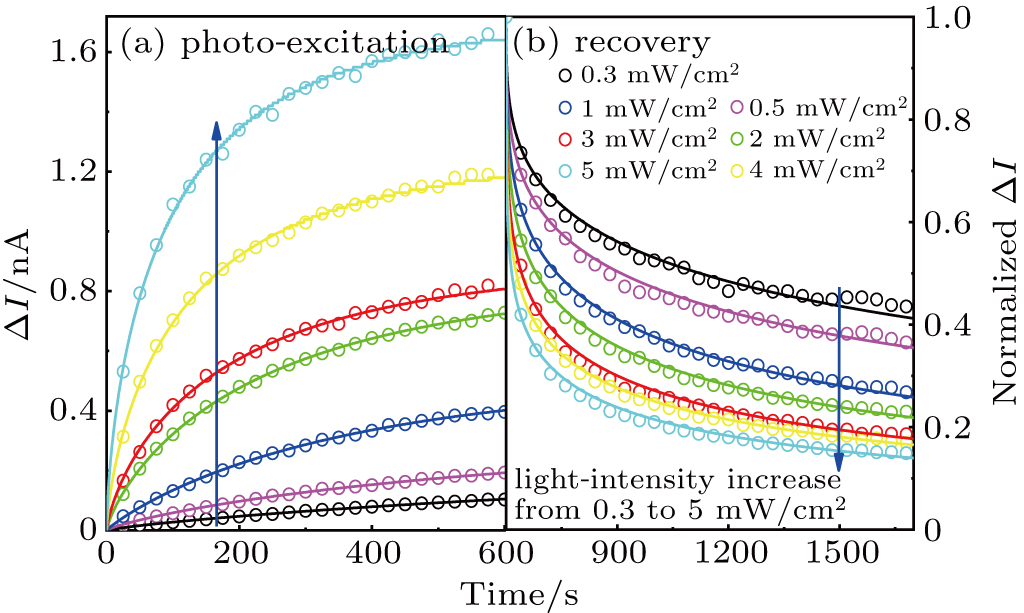
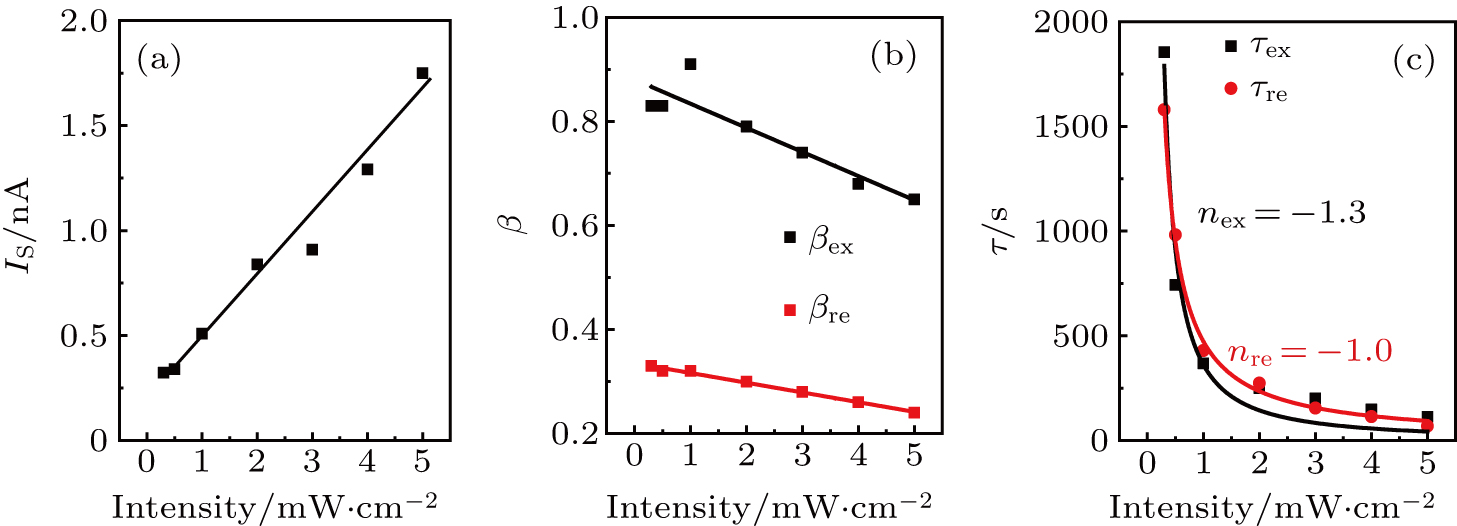
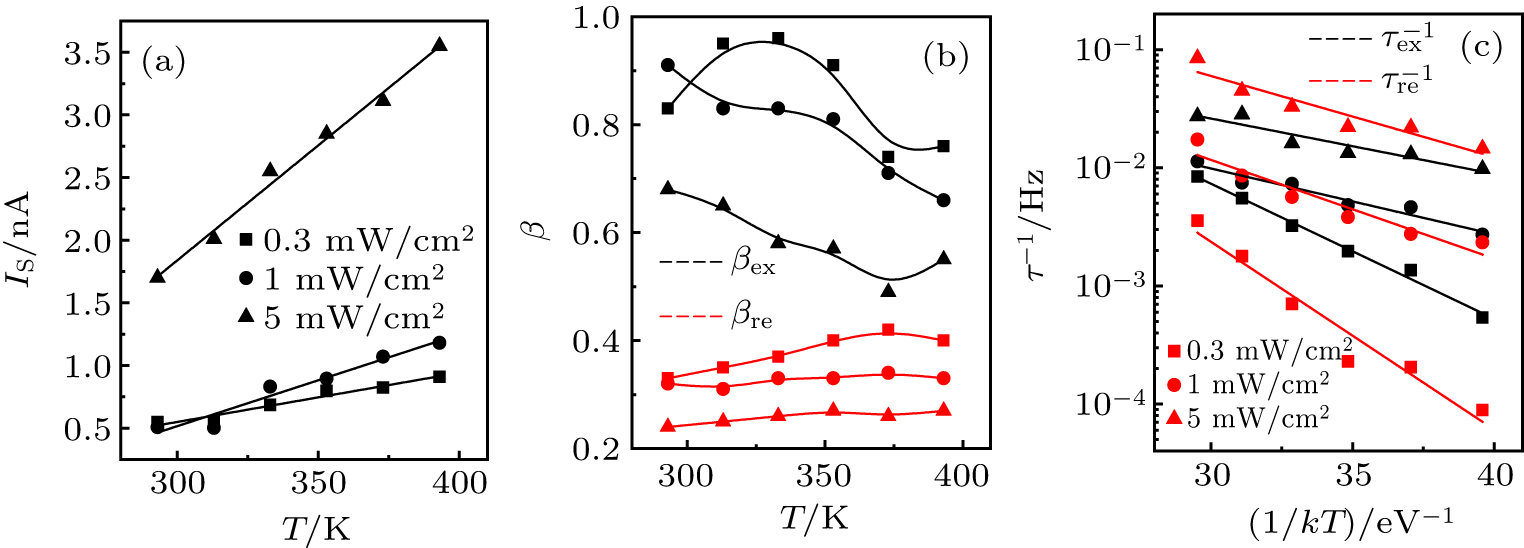
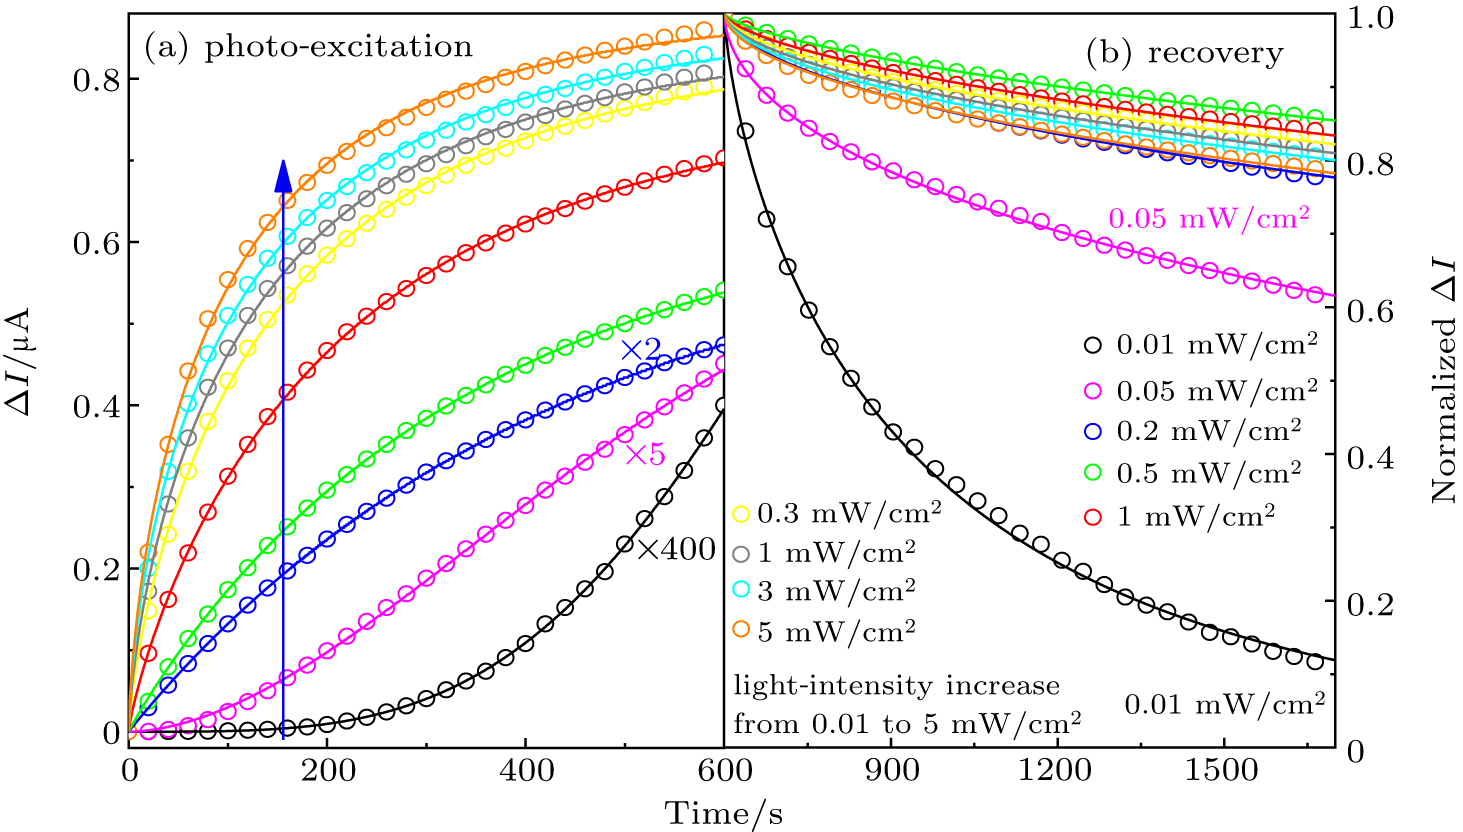
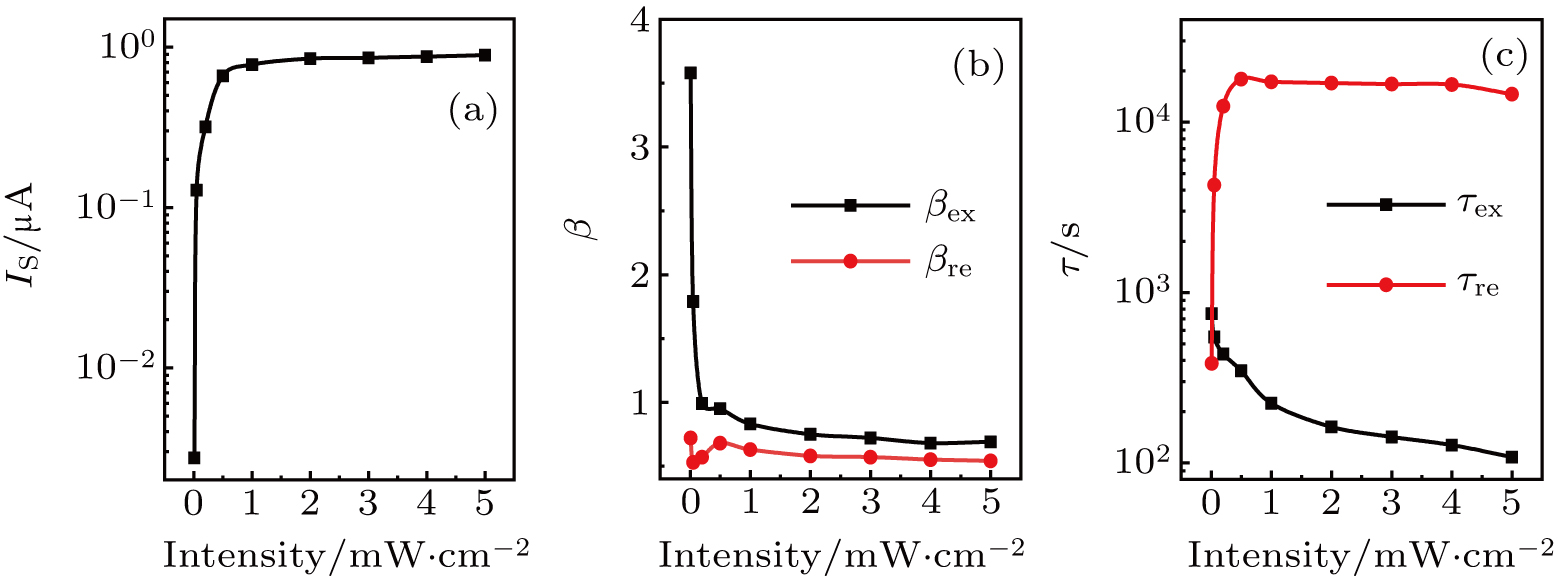
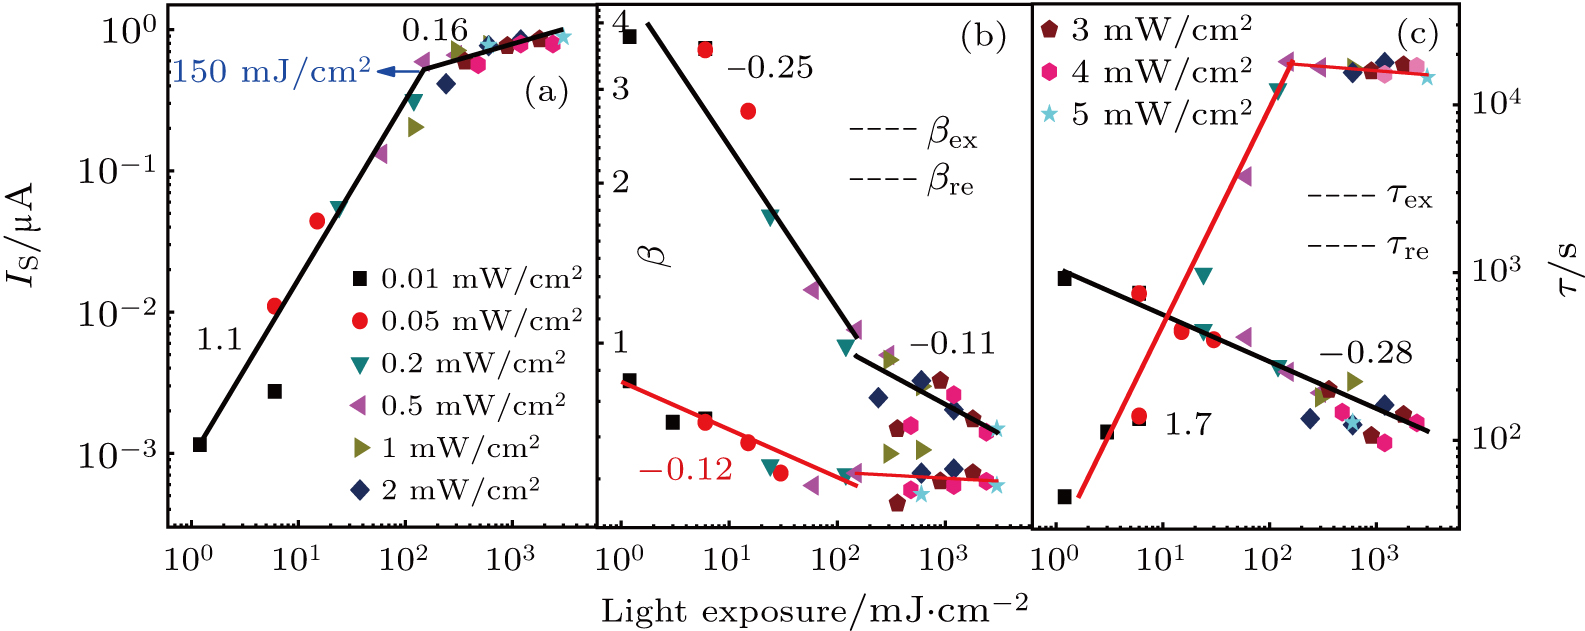
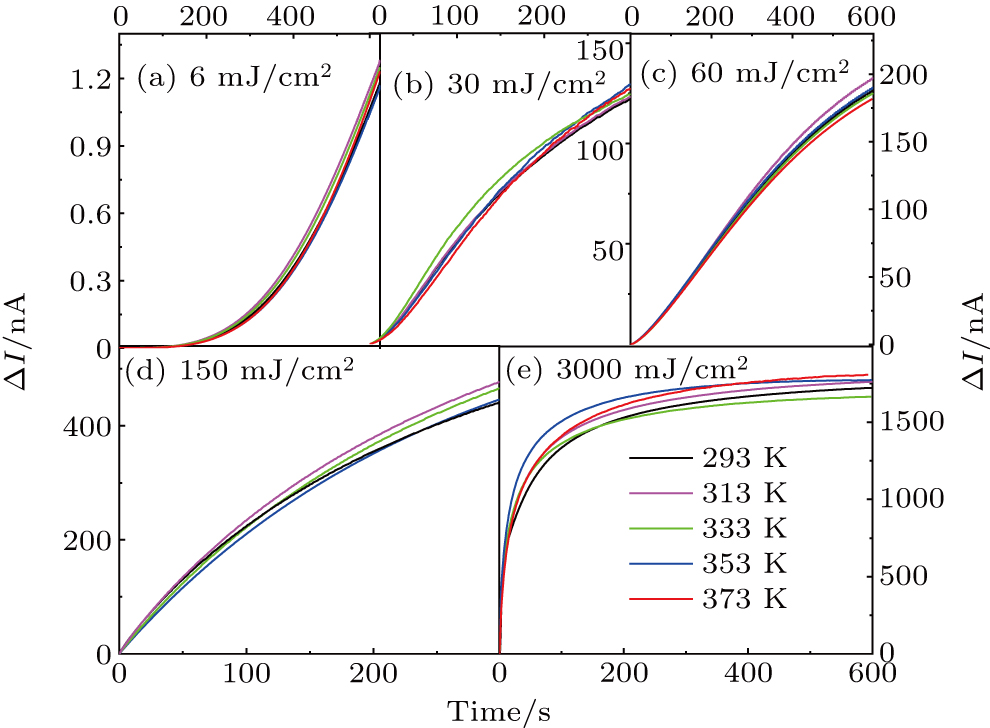
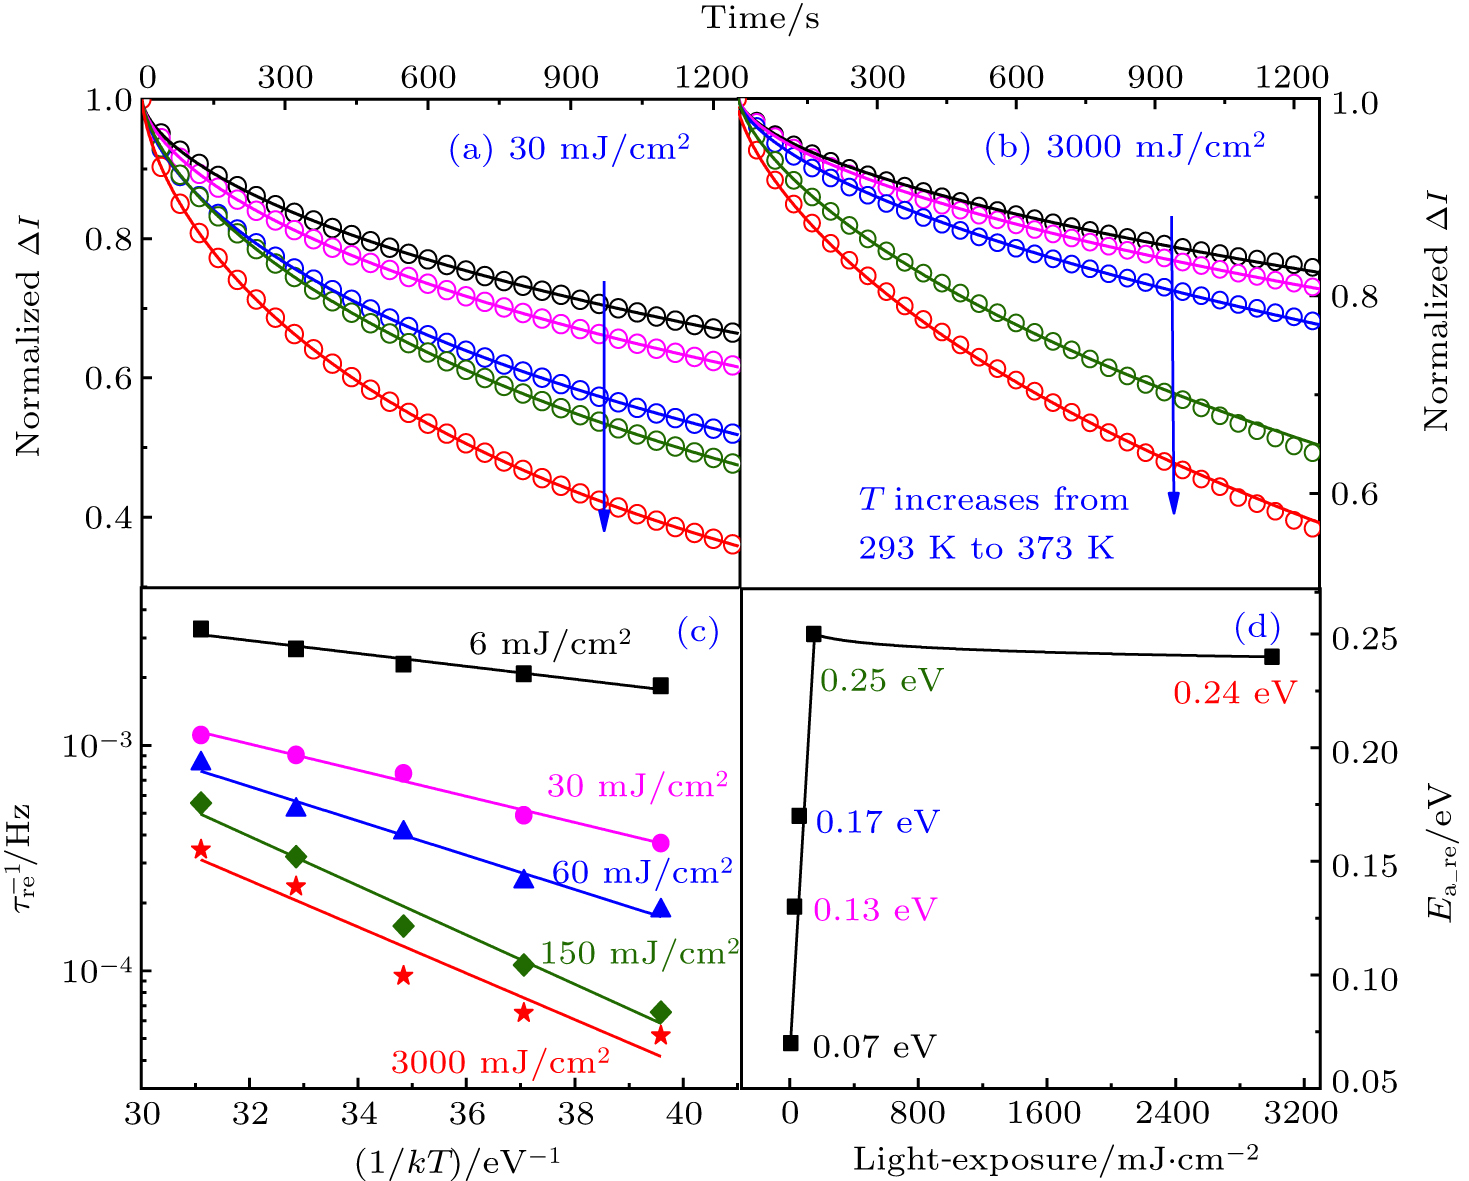
Abstract Persistent photoconductivity (PPC) effect and its light-intensity dependence of both enhancement and depletion (E-/D-) mode amorphous InGaZnO (a-IGZO) thin-film transistors (TFTs) are systematically investigated. Density of oxygen vacancy (VO) defects of E-mode TFTs is relatively small, in which formation of the photo-induced metastable defects is thermally activated, and the activation energy (Ea) decreases continuously with increasing light-intensity. Density of VO defects of D-mode TFTs is much larger, in which the formation of photo-induced metastable defects is found to be spontaneous instead of thermally activated. Furthermore, for the first time it is found that a threshold dose of light-exposure is required to form fully developed photo-induced metastable defects. Under low light-exposure below the threshold, only a low PPC barrier is formed and the PPC recovery is fast. With increasing the light-exposure to the threshold, the lattice relaxation of metal cations adjacent to the doubly ionized oxygen vacancies (${{\rm{V}}}_{{\rm{O}}}^{2+}$) is fully developed, and the PPC barrier increases to ∼ 0.25 eV, which remains basically unchanged under higher light-exposure. Based on the density of VO defects in the channel and the condition of light illumination, a unified model of formation of photo-induced metastable defects in a-IGZO TFTs is proposed to explain the experimental observations.
|
Received: 09 July 2020
Revised: 18 August 2020
Accepted manuscript online: 25 August 2020
|
| Fund: Project supported in part by the National Natural Science Foundation of China (Grant Nos. 61974101 and 61971299), the State Key Laboratory of ASIC and System, Fudan University (Grant No. 2019KF007), the Natural Science Foundation of Jiangsu Province, China (Grant No. SBK2020021406), the Natural Science Foundation of the Jiangsu Higher Education Institutions of China (Grant No. 19KJB510058), and the Suzhou Science and Technology Bureau (Grant No. SYG201933). |
|
Corresponding Authors:
†Corresponding author. E-mail: mingxiang_wang@suda.edu.cn ‡Corresponding author. E-mail: dongli_zhang@suda.edu.cn
|
Cite this article:
Yalan Wang(王雅兰), Mingxiang Wang(王明湘), Dongli Zhang(张冬利), and Huaisheng Wang(王槐生) A systematic study of light dependency of persistent photoconductivity in a-InGaZnO thin-film transistors 2020 Chin. Phys. B 29 118101
|
| [1] |
Nomura K, Ohta H, Takagi A, Kamiya T, Hirano M, Hosono H 2004 Nature 432 488 DOI: 10.1038/nature03090 |
| [2] |
|
| [3] |
|
| [4] |
Jeon S, Ahn S E, Song I, Kim C J, Chung U I, Lee E, Yoo I, Nathan A, Lee S, Robertson J, Kim K 2012 Nat. Mater. 11 301 DOI: 10.1038/NMAT3256 |
| [5] |
Tanabe T, Notomi M, Mitsugi S, Shinya A, Kuramochi E 2005 Opt. Lett. 30 2575 DOI: 10.1364/OL.30.002575 |
| [6] |
|
| [7] |
|
| [8] |
|
| [9] |
|
| [10] |
|
| [11] |
|
| [12] |
Worasawat S, Tasaki K, Neo Y, Pecharapa W, Hatanaka Y, Mimura H 2019 Jpn. J. Appl. Phys. 58 055505 DOI: 10.7567/1347-4065/ab0d0f |
| [13] |
|
| [14] |
Polyakov A Y, Smirnov N B, Govorkov A V, Redwing J M 1998 MRS Proceedings 512 537 DOI: 10.1557/PROC-512-537 |
| [15] |
|
| [16] |
|
| [17] |
Wang M, Liang L, Luo H, Zhang S, Zhang H, Javaid K, Cao H 2016 IEEE Electron Dev. Lett. 37 422 DOI: 10.1109/LED.2016.2525761 |
| [18] |
|
| [19] |
Feng Z, Lu L, Wong M, Kwok H S 2016 Sid Symposium Digest of Technical Papers 47 1197 DOI: 10.1002/sdtp.10908 |
| [20] |
|
| [21] |
Kim Y, Kim S, Kim W, Bae M, Jeong H. K, Kong D, Choi S, Kim D. M, Kim D H 2012 IEEE Trans. Electron Dev. 59 2699 DOI: 10.1109/TED.2012.2208971 |
| [22] |
Luo J, Adler A U, Mason T O, Buchholz D B, Chang R P H, Grayson M 2013 J. Appl. Phys. 113 153709 DOI: 10.1063/1.4795845 |
| [23] |
Lee D H, Kawamura K I, Nomura K, Yanagi H, Kamiya T, Hirano M, Hosono H 2010 Thin Solid Films 518 3000 DOI: 10.1016/j.tsf.2009.10.129 |
| No Suggested Reading articles found! |
|
|
Viewed |
|
|
|
Full text
|
|
|
|
|
Abstract
|
|
|
|
|
Cited |
|
|
|
|
Altmetric
|
|
blogs
Facebook pages
Wikipedia page
Google+ users
|
Online attention
Altmetric calculates a score based on the online attention an article receives. Each coloured thread in the circle represents a different type of online attention. The number in the centre is the Altmetric score. Social media and mainstream news media are the main sources that calculate the score. Reference managers such as Mendeley are also tracked but do not contribute to the score. Older articles often score higher because they have had more time to get noticed. To account for this, Altmetric has included the context data for other articles of a similar age.
View more on Altmetrics
|
|
|