|
|
|
Zero-point fluctuation of hydrogen bond in water dimer from ab initio molecular dynamics |
| Wan-Run Jiang(姜万润)1,†, Rui Wang(王瑞)1,†, Xue-Guang Ren(任雪光)2, Zhi-Yuan Zhang(张志远)1, Dan-Hui Li(李丹慧)1, and Zhi-Gang Wang(王志刚)1,‡ |
1 Institute of Atomic and Molecular Physics, Jilin University, Changchun 130012, China
2 School of Science, Xi’an Jiaotong University, Xi’an 710049, China |
|
|
|
|
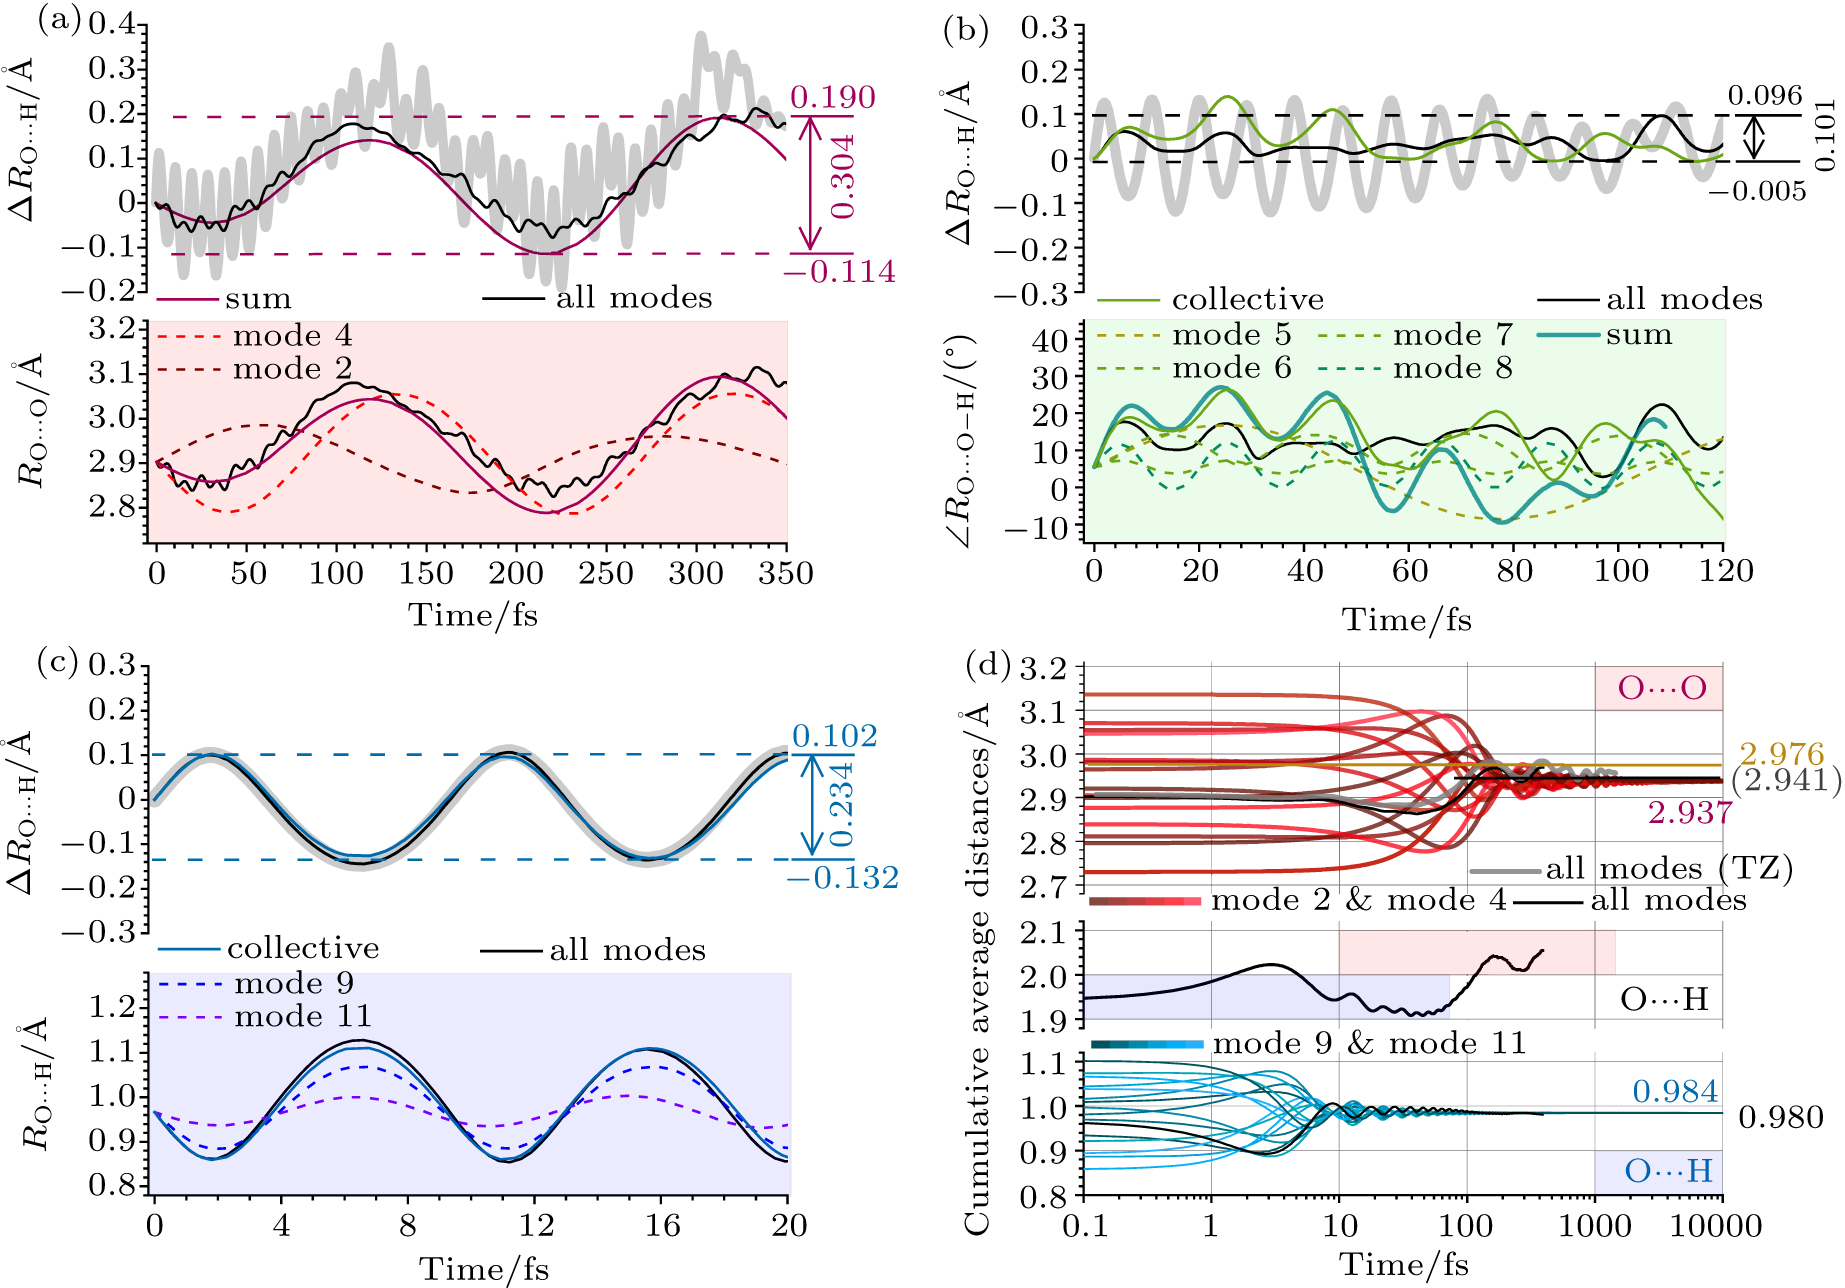
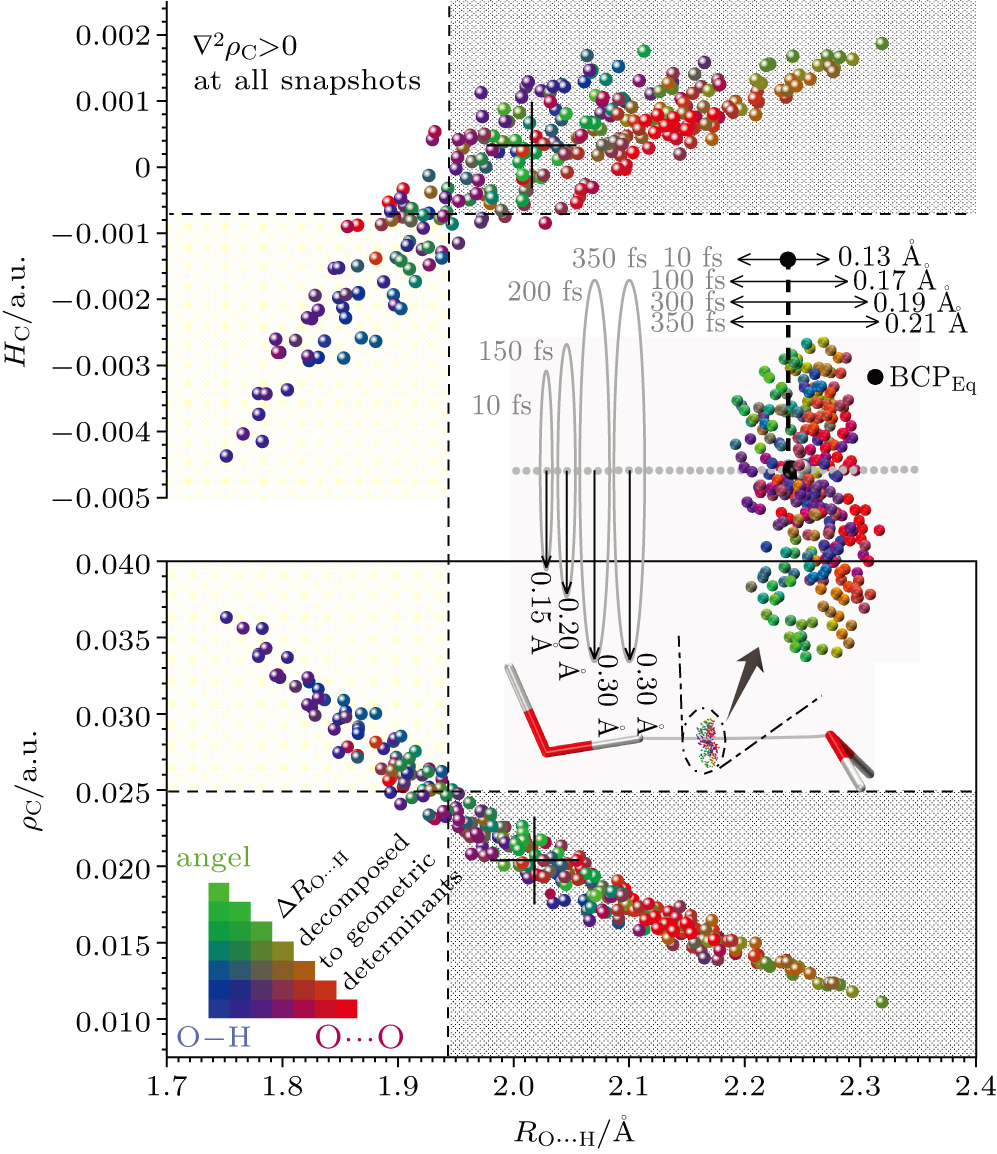
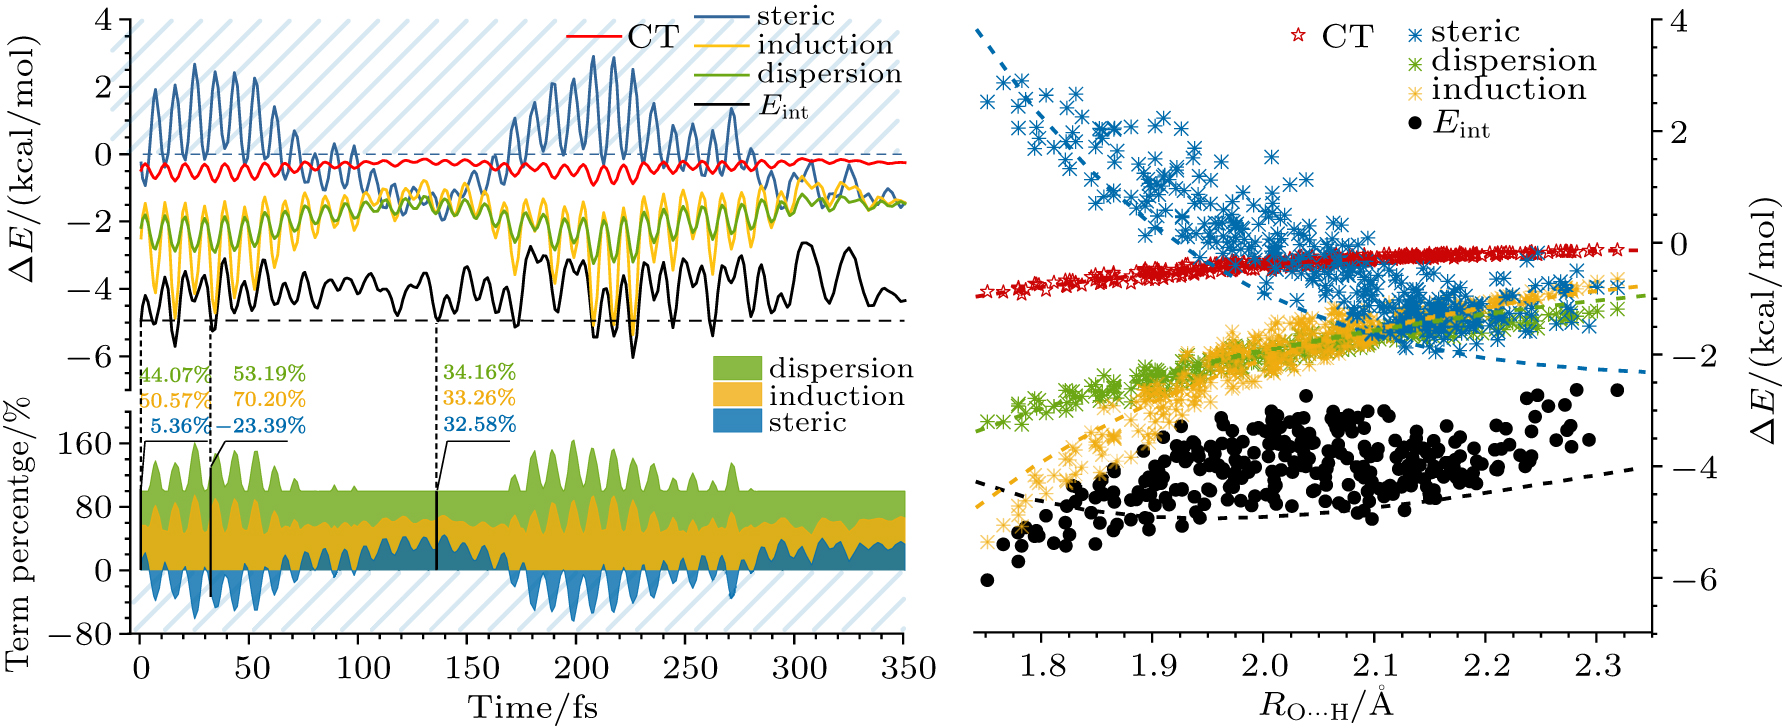
Abstract Dynamic nature of hydrogen bond (H-bond) is central in molecular science of substance transportation, energy transfer, and phase transition in H-bonding networks diversely expressed as solution, crystal, and interfacial systems, thus attracting the state-of-the-art revealing of its phenomenological edges and sophisticated causes. However, the current understanding of the ground-state fluctuation from zero-point vibration (ZPV) lacks a firm quasi-classical base, concerning three basic dimensions as geometry, electronic structure, and interaction energy. Here, based on the ab initio molecular dynamics simulation of a ground-state water dimer, temporally separated fluctuation features in the elementary H-bond as the long-time weakening and the minor short-time strengthening are respectively assigned to two low-frequency intermolecular ZPV modes and two O–H stretching ones. Geometrically, the former modes instantaneously lengthen H-bond up to 0.2 Å whose time-averaged effect coverages to about 0.03 Å over 1-picosecond. Electronic-structure fluctuation crosses criteria’ borders, dividing into partially covalent and noncovalent H-bonding established for equilibrium models, with a 370% amplitude and the district trend in interaction energy fluctuation compared with conventional dragging models using frozen monomers. Extended physical picture within the normal-mode disclosure further approaches to the dynamic nature of H-bond and better supports the upper-building explorations towards ultrafast and mode-specific manipulation.
|
Received: 23 March 2020
Revised: 22 July 2020
Accepted manuscript online: 01 August 2020
|
|
PACS:
|
31.10.+z
|
(Theory of electronic structure, electronic transitions, and chemical binding)
|
| |
82.30.Rs
|
(Hydrogen bonding, hydrophilic effects)
|
| |
34.50.Ez
|
(Rotational and vibrational energy transfer)
|
|
|
Corresponding Authors:
†These authors contributed equally to this work. ‡Corresponding author. E-mail: wangzg@jlu.edu.cn
|
| About author: †Corresponding author. E-mail: wangzg@jlu.edu.cn * Project supported by the National Natural Science Foundation of China (Grant Nos. 11974136 and 11674123). |
Cite this article:
Wan-Run Jiang(姜万润)†, Rui Wang(王瑞)†, Xue-Guang Ren(任雪光), Zhi-Yuan Zhang(张志远), Dan-Hui Li(李丹慧), and Zhi-Gang Wang(王志刚)‡ Zero-point fluctuation of hydrogen bond in water dimer from ab initio molecular dynamics 2020 Chin. Phys. B 29 103101
|
| [1] |
Meng X, Guo J, Peng J, Chen J, Wang Z, Shi J R, Li X Z, Wang E G, Jiang Y 2015 Nat. Phys. 11 235 DOI: 10.1038/nphys3225 |
| [2] |
|
| [3] |
|
| [4] |
Ch’ng L C, Samanta A K, Czakó G, Bowman J M, Reisler H 2012 J. Am. Chem. Soc. 134 15430 DOI: 10.1021/ja305500x |
| [5] |
|
| [6] |
|
| [7] |
Guo J, Lü J T, Feng Y, Chen J, Peng J, Lin Z, Meng X, Wang Z, Li X Z, Wang E G, Jiang Y 2016 Science 352 321 DOI: 10.1126/science.aaf2042 |
| [8] |
|
| [9] |
|
| [10] |
Ceriotti M, Cuny J, Parrinello M, Manolopoulos D E 2013 Proc. Natl. Acad. Sci. USA 110 15591 DOI: 10.1073/pnas.1308560110 |
| [11] |
|
| [12] |
|
| [13] |
|
| [14] |
Asensio A, Kobko N, Dannenberg J J 2003 J. Phys. Chem. A 107 6441 DOI: 10.1021/jp0344646 |
| [15] |
Louit G, Hocquet A, Ghomi M, Meyer M, Sühnel J 2003 J. Phys. Chem. Commun. 6 1 DOI: 10.1039/b210911e |
| [16] |
|
| [17] |
|
| [18] |
|
| [19] |
|
| [20] |
|
| [21] |
|
| [22] |
Klopper W, van Duijneveldt-van de Rijdt J G C M, van Duijneveldt F B 2000 Phys. Chem. Chem. Phys. 2 2227 DOI: 10.1039/a910312k |
| [23] |
|
| [24] |
Cowan M L, Bruner B D, Huse N, Dwyer J R, Chugh B, Nibbering E T J, Elsaesser T, Miller R J D 2005 Nature 434 199 DOI: 10.1038/nature03383 |
| [25] |
Ramasesha K, De Marco L, Mandal A, Tokmakoff A 2013 Nat. Chem. 5 935 DOI: 10.1038/nchem.1757 |
| [26] |
Bader R F W 1994 Atoms in Molecules: A Quantum Theory Oxford Clarendon Press
|
| [27] |
|
| [28] |
|
| [29] |
Isaacs E D, Shukla A, Platzman P M, Hamann D R, Barbiellini B, Tulk C A 1999 Phys. Rev. Lett. 82 600 DOI: 10.1103/PhysRevLett.82.600 |
| [30] |
Rozas I, Alkorta I, Elguero J 2000 J. Am. Chem. Soc. 122 11154 DOI: 10.1021/ja0017864 |
| [31] |
|
| [32] |
|
| [33] |
|
| [34] |
|
| [35] |
|
| [36] |
|
| [37] |
|
| [38] |
Rybak S, Jeziorski B, Szalewicz K 1991 J. Chem. Phys. 95 6576 DOI: 10.1063/1.461528 |
| [39] |
|
| [40] |
|
| [41] |
|
| [42] |
Wang B, Jiang W, Dai X, Gao Y, Wang Z, Zhang R Q 2016 Sci. Rep. 6 22099 DOI: 10.1038/srep22099 |
| [43] |
|
| [44] |
|
| [45] |
|
| [46] |
|
| [47] |
Sun J, Remsing R C, Zhang Y, Sun Z, Ruzsinszky A, Peng H, Yang Z, Paul A, Waghmare U, Wu X, Klein M L, Perdew J P 2016 Nat. Chem. 8 831 DOI: 10.1038/nchem.2535 |
| [48] |
|
| [49] |
|
| [50] |
Sinha P, Boesch S E, Gu C, Wheeler R A, Wilson A K 2004 J. Phys. Chem. A 108 9213 DOI: 10.1021/jp048233q |
| [51] |
|
| [52] |
Millam J M, Bakken V, Chen W, Hase W L, Schlegel H B 1999 J. Chem. Phys. 111 3800 DOI: 10.1063/1.480037 |
| [53] |
|
| [54] |
|
| [55] |
Parker T M, Burns L A, Parrish R M, Ryno A G, Sherrill C D 2014 J. Chem. Phys. 140 094106 DOI: 10.1063/1.4867135 |
| [56] |
|
| [57] |
Parrish R M, Burns L A, Smith D G A, Simmonett A C, DePrince A E, Hohenstein E G, Bozkaya U, Sokolov A Y, Di Remigio R, Richard R M, Gonthier J F, James A M, McAl-exander H R, Kumar A, Saitow M, Wang X, Pritchard B P, Verma P, Schaefer H F, Patkowski K, King R A, Valeev E F, Evangelista F A, Turney J M, Crawford T D, Sherrill C D 2017 J. Chem. Theory Comput. 13 3185 DOI: 10.1021/acs.jctc.7b00174 |
| [58] |
|
| [59] |
|
| [60] |
Cole W T S, Fellers R S, Viant M R, Leforestier C, Saykally R J 2015 J. Chem. Phys. 143 154306 DOI: 10.1063/1.4933116 |
| [61] |
Czakó G, Kaledin A L, Bowman J M 2010 J. Chem. Phys. 132 164103 DOI: 10.1063/1.3417999 |
| [62] |
|
| [63] |
Costales A, Blanco M A, Martín Pendás A, Mori-Sánchez P, Luaña V 2004 J. Phys. Chem. A 108 2794 DOI: 10.1021/jp037627z |
| [64] |
|
| [65] |
|
| [66] |
Grabowski S J, Sokalski W A, Dyguda E, Leszczyńki J 2006 J. Phys. Chem. B 110 6444 DOI: 10.1021/jp0600817 |
| [67] |
|
| [68] |
|
| [69] |
|
| [70] |
|
| [71] |
|
| [72] |
|
| [73] |
Otto K E, Xue Z, Zielke P, Suhm M A T 2014 Phys. Chem. Chem. Phys. 16 9849 DOI: 10.1039/c3cp54272f |
| No Suggested Reading articles found! |
|
|
Viewed |
|
|
|
Full text
|
|
|
|
|
Abstract
|
|
|
|
|
Cited |
|
|
|
|
Altmetric
|
|
blogs
Facebook pages
Wikipedia page
Google+ users
|
Online attention
Altmetric calculates a score based on the online attention an article receives. Each coloured thread in the circle represents a different type of online attention. The number in the centre is the Altmetric score. Social media and mainstream news media are the main sources that calculate the score. Reference managers such as Mendeley are also tracked but do not contribute to the score. Older articles often score higher because they have had more time to get noticed. To account for this, Altmetric has included the context data for other articles of a similar age.
View more on Altmetrics
|
|
|