1Department of Physics, Taizhou University, Taizhou 318000, China 2College of Science, Beibu Gulf University, Qinzhou 535011, China 3Department of Physics, Zhejiang University, Hangzhou 310027, China
The equilibrium distribution of a polymer chain between two interconnected spherical cavities (a small one with radius Rs and a large one with radius Rl) is studied by using Monte Carlo simulation. A conformational transition from a double-cavity-occupation (DCO) state to a single-cavity-occupation (SCO) state is observed. The dependence of the critical radius of the small cavity (RsC) where the transition occurs on Rl and the polymer length N can be described by with ν being the Flory exponent, and meanwhile the equilibrium number (ms) of monomers in the small cavity for the DCO phase can be expressed as ms = N/((Rl/Rs)3 + 1), which can be quantitatively understood by using the blob picture. Moreover, in the SCO phase, the polymer is found to prefer staying in the large cavity.
* Project supported by the Natural Science Foundation of Zhejiang Province, China (Grant No. LY20A040004) and the National Natural Science Foundation of China (Grant Nos. 11604232, 11674277, 11704210, and 11974305).
Cite this article:
Chao Wang(王超)†, Ying-Cai Chen(陈英才), Shuang Zhang(张爽), Hang-Kai Qi(齐航凯), and Meng-Bo Luo(罗孟波)‡ Distribution of a polymer chain between two interconnected spherical cavities 2020 Chin. Phys. B 29 108201
Fig. 1.
A 2D sketch of the simulation model. Two spherical cavities, a small one with radius Rs and a large one with radius Rl, are connected by a small hole with diameter Dh. The polymer is confined in the two cavities.
Fig. 2.
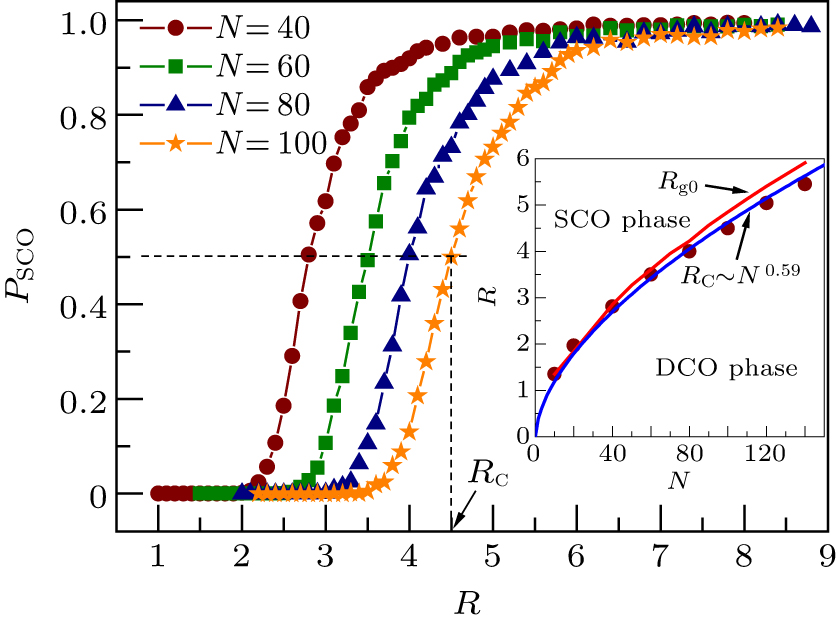
The SCO probability PSCO as a function of R for different N. The radius where PSCO = 0.5 is defined as the critical radius RC. The inset shows the phase diagram for the symmetric twin-cavity system. The red line shows the radius of gyration (Rg0) of polymer in free space as a function of N.
Fig. 3.
The SCO probability PSCO as a function of the radius of the small cavity Rs for different Rl (< RC), where N = 60. The radius where PSCO = 0.5 is defined as the critical radius RsC.
Fig. 4.
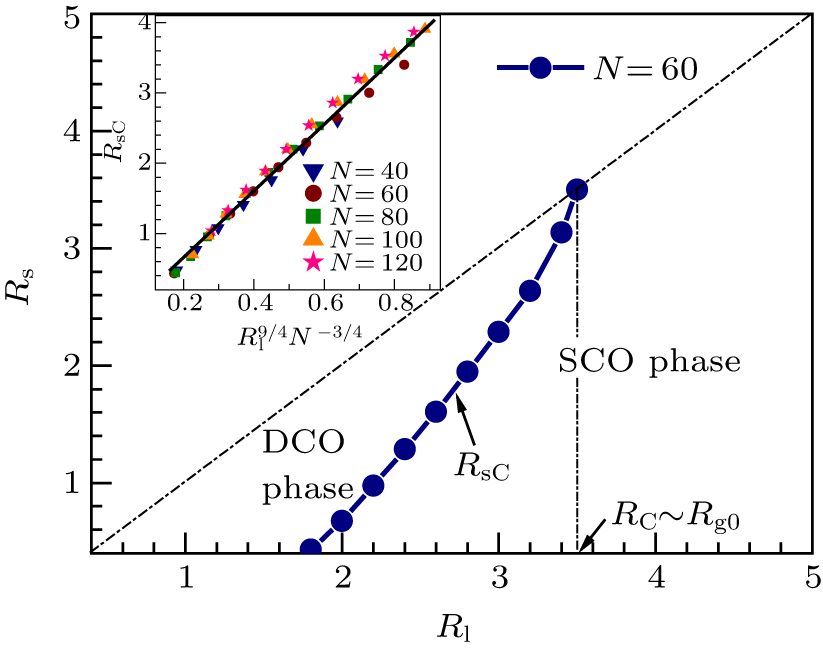
Phase diagram for the asymmetric system, where N = 60. The inset shows the dependence of RsC on for N = 40, 60, 80, 100, and 120. The solid black line is guide for eyes.
Fig. 5.
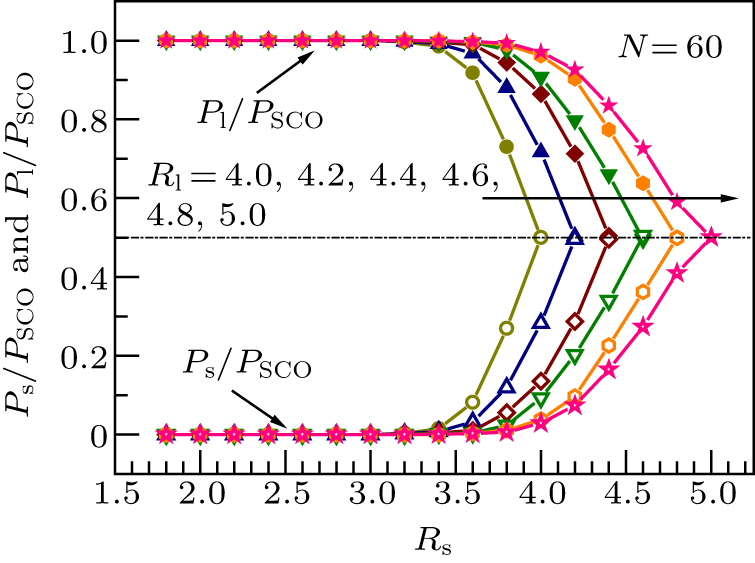
The relative probabilities of the whole polymer in the small cavity (Ps/PSCO) and in the large cavity (Pl/PSCO) in the SCO phase as functions of the radius of the small cavity Rs for different Rl, where N = 60.
Fig. 6.
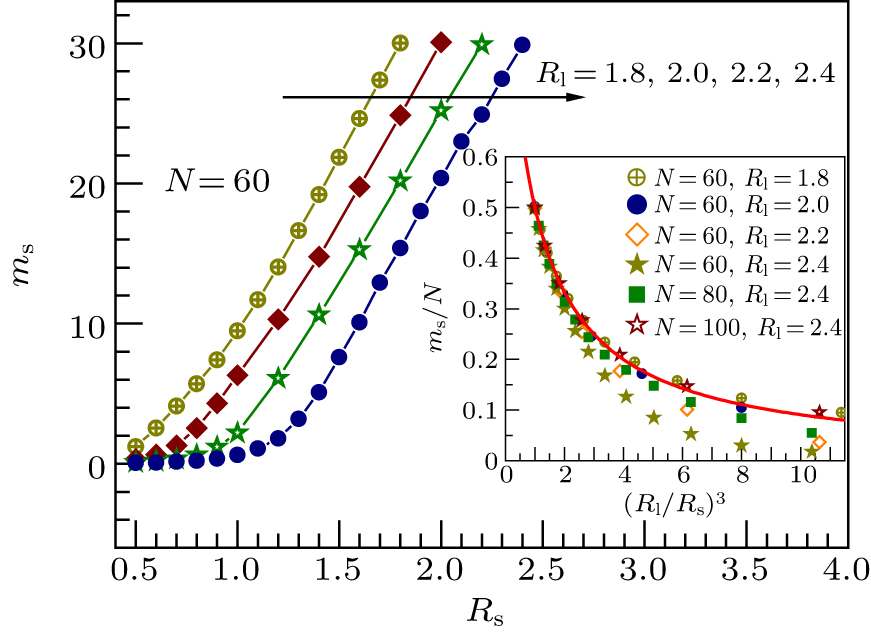
The equilibrium number (ms) of monomers in the small cavity as a function of Rs for different Rl (< RC), where N = 60. The inset shows ms/N as a function of (Rl/Rs)3 for different Rl and N. The solid red line is given by Eq. (12).
Altmetric calculates a score based on the online attention an article receives. Each coloured thread in the circle represents a different type of online attention. The number in the centre is the Altmetric score. Social media and mainstream news media are the main sources that calculate the score. Reference managers such as Mendeley are also tracked but do not contribute to the score. Older articles often score higher because they have had more time to get noticed. To account for this, Altmetric has included the context data for other articles of a similar age.