| CONDENSED MATTER: STRUCTURAL, MECHANICAL, AND THERMAL PROPERTIES |
Prev
Next
|
|
|
Synthesis of black phosphorus structured polymeric nitrogen |
| Ying Liu(刘影)1,†, Haipeng Su(苏海鹏)1, Caoping Niu(牛草萍)2,3,, Xianlong Wang(王贤龙)2,3, Junran Zhang(张俊然)4, Zhongxue Ge(葛忠学)1, and Yanchun Li(李延春)4 |
1 Xi’an Modern Chemistry Research Institute, Xi’an 710065, China
2 Key Laboratory of Materials Physics, Institute of Solid State Physics, HFIPS, Chinese Academy of Sciences, Hefei 230031, China
3 University of Science and Technology of China, Hefei 230026, China
4 Institute of High Energy Physics, Chinese Academy of Sciences, Beijing 100049, China |
|
|
|
|
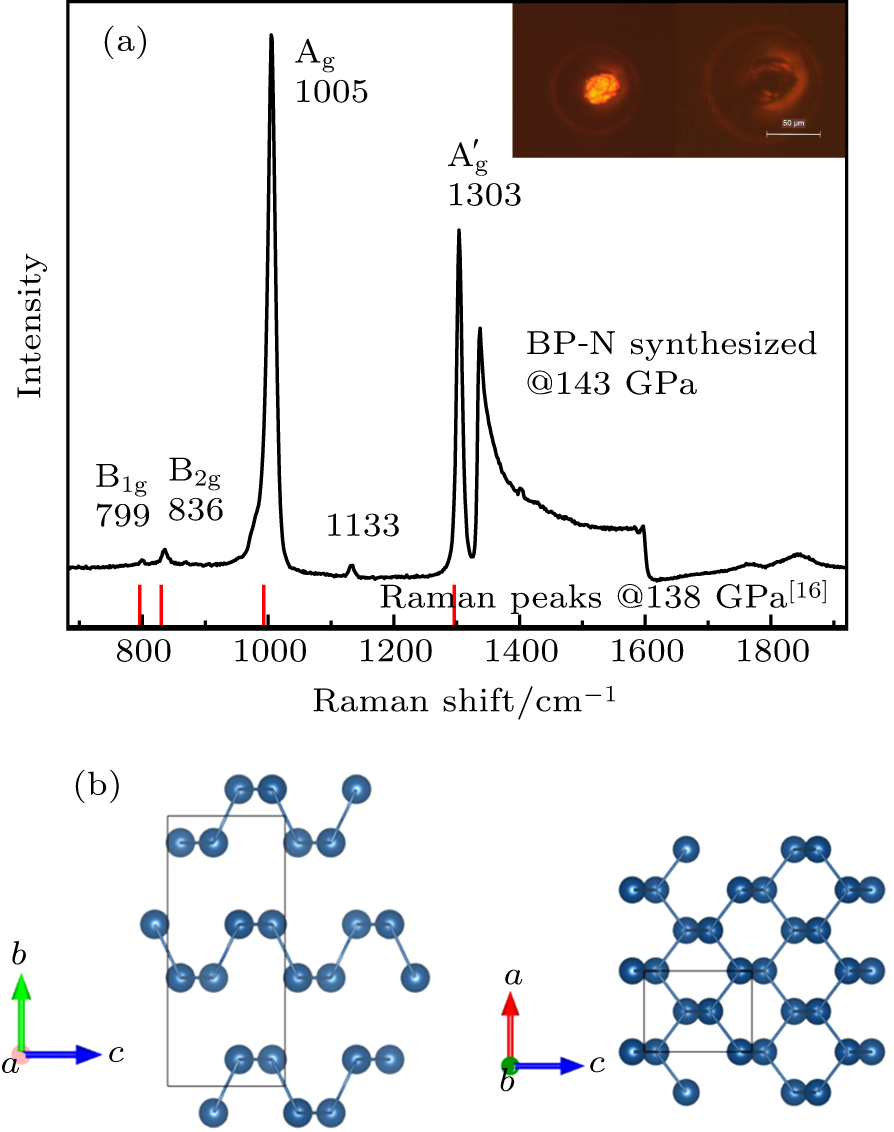
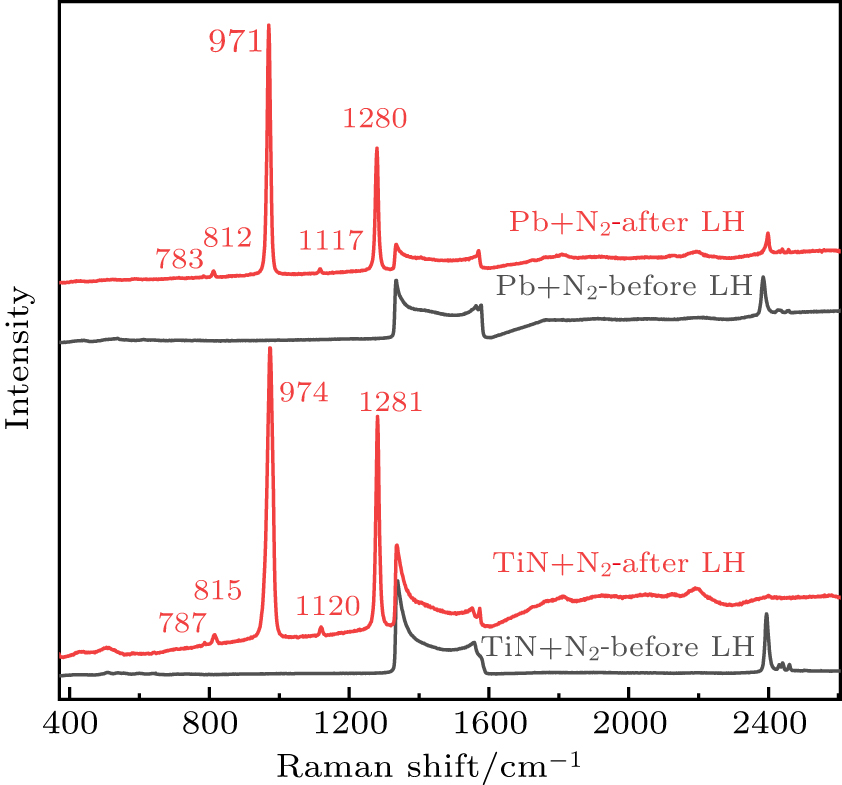
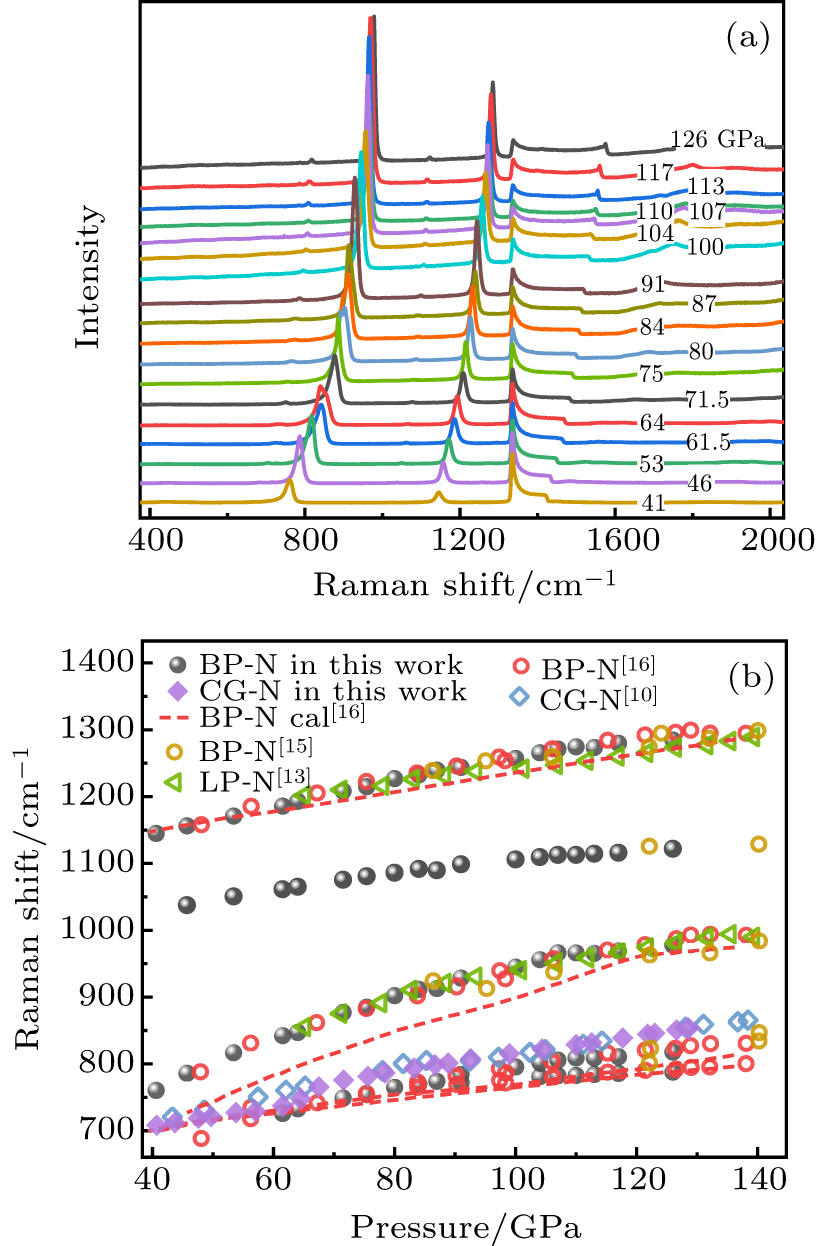
Abstract Since the discoveries of polymeric nitrogen, named cg-N (2004), LP-N (2014), HLP-N (2019), another polymorph named black phosphorus nitrogen (BP-N) was synthesized at high-pressure-high-temperature conditions. The narrow existing pressure region and similar synthesized pressure of BP-N compared with cg-N indicate that the stable energy and enthalpy of formation of these two structures are close to each other, which was confirmed by our theoretical calculation. In order to obtain the pressure region of BP-N phase, pure N2 and TiN/Pb + N2 precursors were used for laser-heating high pressure experiments in diamond anvil cell (DAC), and the phase identity was examined by Raman and XRD mapping. BP-N can be synthesized in the pressure range of 130 GPa to 140 GPa with the assistance of heating absorber. With the decrease of the pressure, BP-N can be quenched to ∼ 40 GPa. The synthesizing pressure–temperature and the stable pressure region of BP-N are important for further exploration of BP-N and its kinetic and thermal dynamic relationship with other polymeric nitrogen, especially cg-N.
|
Received: 23 June 2020
Revised: 16 July 2020
Accepted manuscript online: 28 July 2020
|
|
PACS:
|
62.50.-p
|
(High-pressure effects in solids and liquids)
|
| |
61.05.cp
|
(X-ray diffraction)
|
| |
42.62.-b
|
(Laser applications)
|
| |
07.35.+k
|
(High-pressure apparatus; shock tubes; diamond anvil cells)
|
|
|
Corresponding Authors:
†Corresponding author. E-mail: liuying8912@aliyun.com
|
| About author: †Corresponding author. E-mail: liuying8912@aliyun.com * Project supported by the National Natural Science Foundation of China (Grant No. 11904281). |
Cite this article:
Ying Liu(刘影)†, Haipeng Su(苏海鹏), Caoping Niu(牛草萍), Xianlong Wang(王贤龙), Junran Zhang(张俊然), Zhongxue Ge(葛忠学), and Yanchun Li(李延春) Synthesis of black phosphorus structured polymeric nitrogen 2020 Chin. Phys. B 29 106201
|
| [1] |
|
| [2] |
|
| [3] |
|
| [4] |
|
| [5] |
|
| [6] |
|
| [7] |
|
| [8] |
|
| [9] |
Wang X l, Wang Y C, Miao M S, Zhong X, Lv J, Cui T, Li J F, Chen L, Pickard C J, Ma Y M 2012 Phys. Rev. Lett. 109 175502 DOI: 10.1103/PhysRevLett.109.175502 |
| [10] |
Eremets M I, Gavriliuk A G, Trojan I A, Dzivenko D A, Boehler R 2004 Nat. Mater. 3 558 DOI: 10.1038/nmat1146 |
| [11] |
|
| [12] |
|
| [13] |
|
| [14] |
|
| [15] |
Laniel D, Winkler B, Fedotenko T, Pakhomova A, Chariton S, Milman V, Prakapenka V, Dubrovinsky L, Dubrovinskaia N 2020 Phys. Rev. Lett. 124 216001 DOI: 10.1103/PhysRevLett.124.216001 |
| [16] |
Ji C, Adeleke A A, Yang L X, Wan B, Gou H Y, Yao Y S, Li B, Meng Y, Smith J S, Prakapenka V B, Liu W J, Shen G Y, Mao W L, Mao H K 2020 Sci. Adv. 6 eaba9206 DOI: 10.1126/sciadv.aba9206 |
| [17] |
Zou G T, Ma Y Z, Mao H K, Hemley R J, Gramsch S A 2001 Rev. Sci. Instrum. 72 1298 DOI: 10.1063/1.1343864 |
| [18] |
|
| [19] |
Hirai S, Kojima Y, Ohfuji H, Nishiyama N, Irifune T, Klemme S, Bromiley G, Attfield J P 2011 Phys. Chem. Miner. 38 631 DOI: 10.1007/s00269-011-0435-2 |
| [20] |
|
| [21] |
|
| [22] |
|
| [23] |
|
| [24] |
|
| [25] |
|
| [26] |
|
| [27] |
|
| [28] |
Qian G R, Niu H Y, Hu C H, Oganov A R, Zeng Q F, Zhou H Y 2016 Sci. Rep. 6 25947 DOI: 10.1038/srep25947 |
| [29] |
Yu S Y, Huang B W, Zeng Q F, Oganov A R, Zhang L T, Frapper G 2017 J. Phys. Chem. C 121 11037 DOI: 10.1021/acs.jpcc.7b00474 |
| [30] |
Laniel D, Winkler B, Koemets E, Fedotenko T, Bykov M, Bykova E, Dubrovinsky L, Dubrovinskaia N 2019 Nat. Commun. 10 4515 DOI: 10.1038/s41467-019-12530-w |
| [31] |
Du H F, Ge Y F, Guo W, Zhu J L, Yao Y G PCCP revision
|
| [32] |
Eremets M I 1996 High Pressure Experimental Methods Oxford Oxford Univ. Press
|
| [33] |
Eremets M I, Gavriliuk A G, Serebryanaya N R, Trojan I A, Dzivenko D A, Boehler R, Mao H K, Hemley R J 2004 J. Chem. Phys. 121 11296 DOI: 10.1063/1.1814074 |
| [34] |
Eremets M I, Hemley R J, Mao H K, Gregoryanz E 2001 Nature 411 170 DOI: 10.1038/35075531 |
| [35] |
|
| [36] |
|
| No Suggested Reading articles found! |
|
|
Viewed |
|
|
|
Full text
|
|
|
|
|
Abstract
|
|
|
|
|
Cited |
|
|
|
|
Altmetric
|
|
blogs
Facebook pages
Wikipedia page
Google+ users
|
Online attention
Altmetric calculates a score based on the online attention an article receives. Each coloured thread in the circle represents a different type of online attention. The number in the centre is the Altmetric score. Social media and mainstream news media are the main sources that calculate the score. Reference managers such as Mendeley are also tracked but do not contribute to the score. Older articles often score higher because they have had more time to get noticed. To account for this, Altmetric has included the context data for other articles of a similar age.
View more on Altmetrics
|
|
|