| INTERDISCIPLINARY PHYSICS AND RELATED AREAS OF SCIENCE AND TECHNOLOGY |
Prev
Next
|
|
|
Mechanical and microstructural response of densified silica glass under uniaxial compression: Atomistic simulations |
| Yi-Fan Xie(谢轶凡)1,2, Feng Feng(冯锋)1, Ying-Jun Li(李英骏)2,†, Zhi-Qiang Hu(胡志强)3, Jian-Li Shao(邵建立)3,‡, and Yong Mei(梅勇)3,4,§ |
1 School of Science, China University of Mining and Technology, Beijing 100083, China
2 State Key Laboratory for Geomechanics and Deep Underground Engineering, China University of Mining and Technology, Beijing 100083, China
3 State Key Laboratory of Explosion Science and Technology, Beijing Institute of Technology, Beijing 100081, China
4 Institute of Defense Engineering, AMS, PLA, Beijing 100036, China |
|
|
|
|
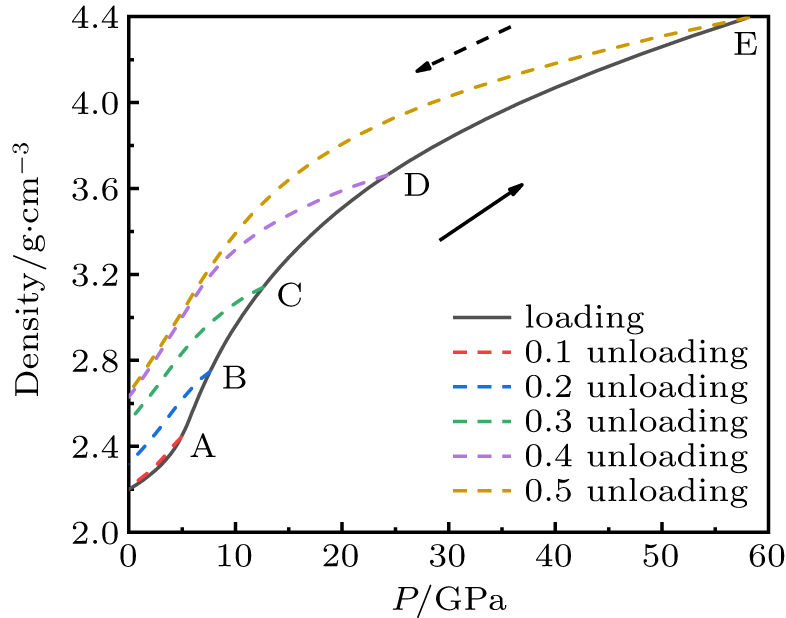
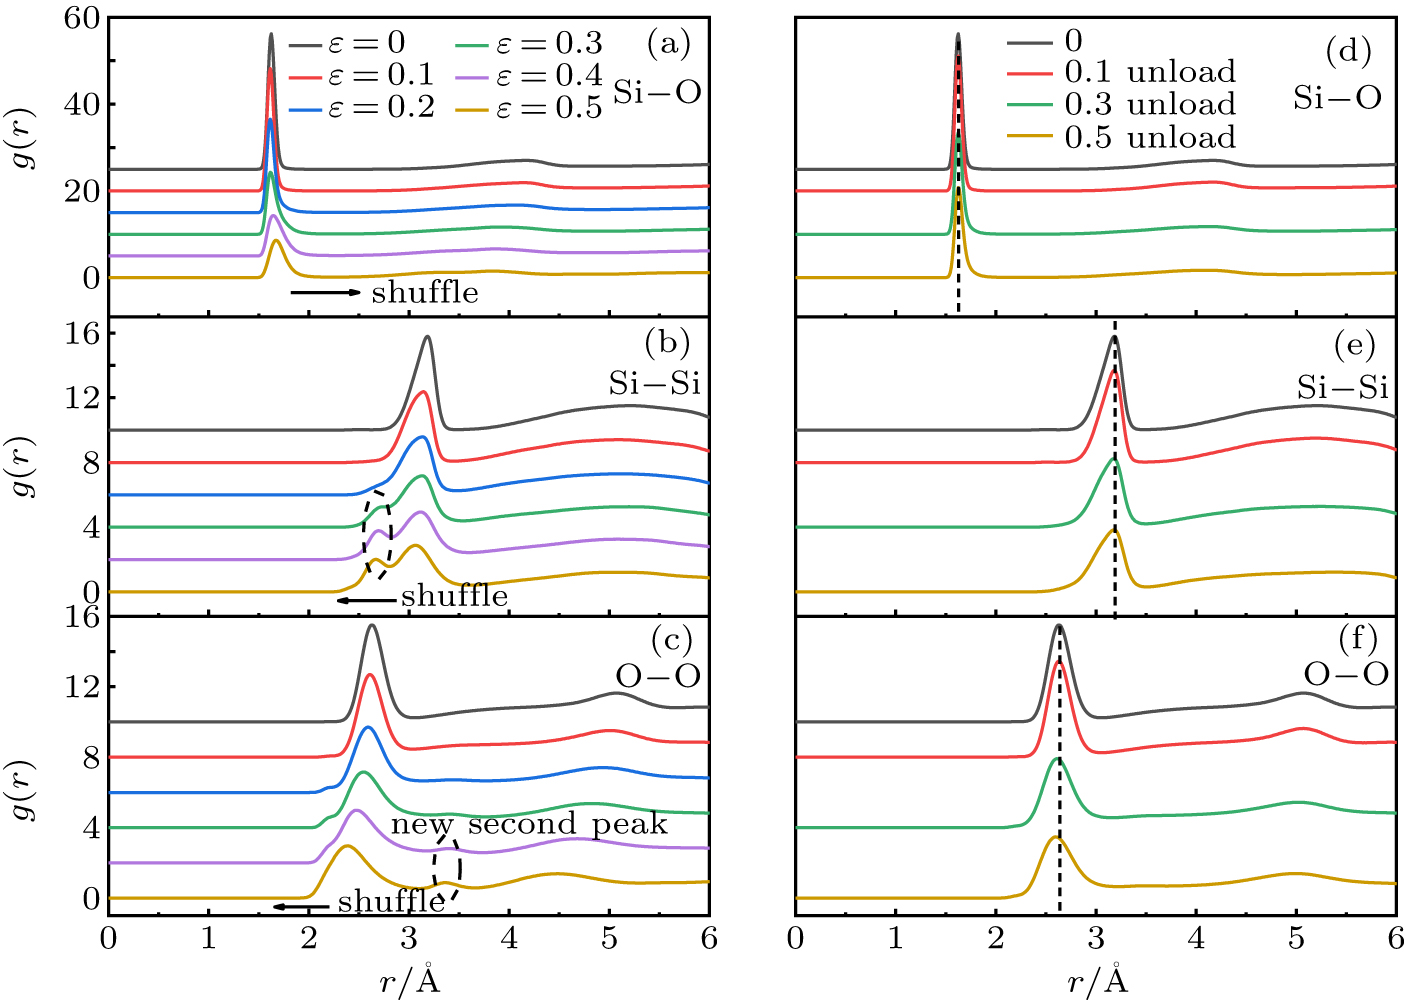
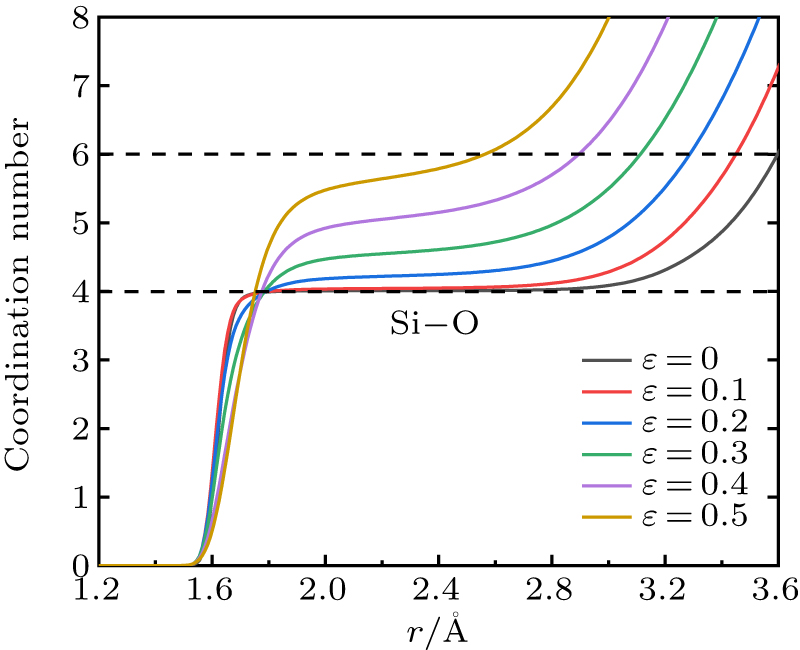
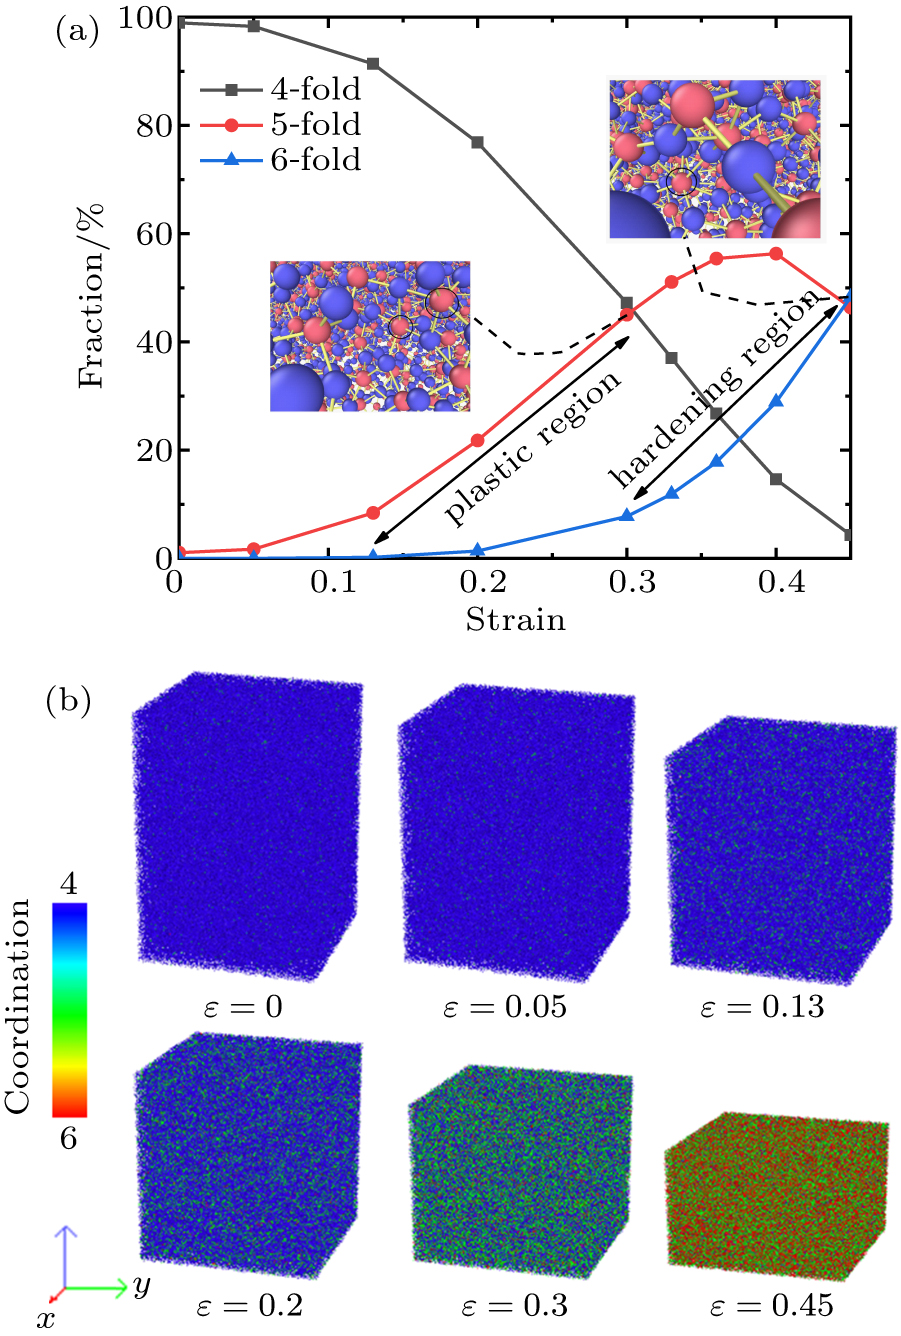
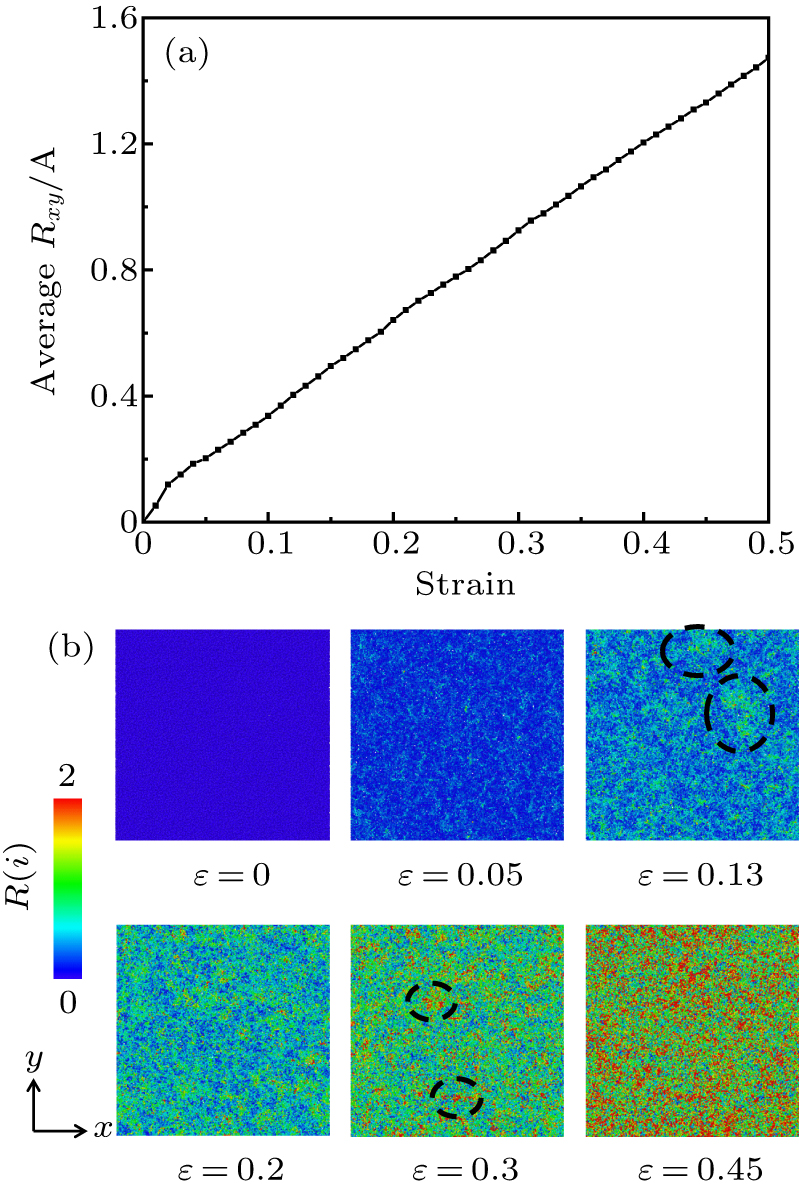
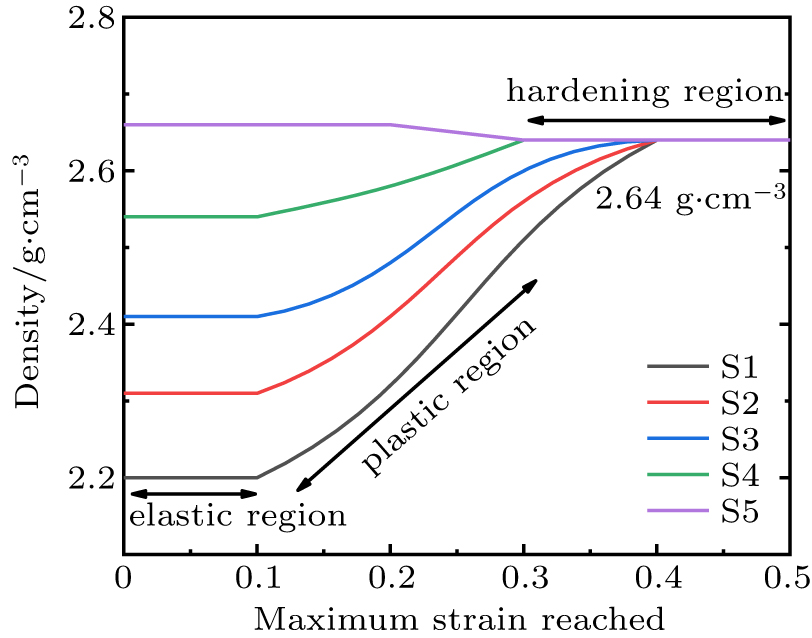
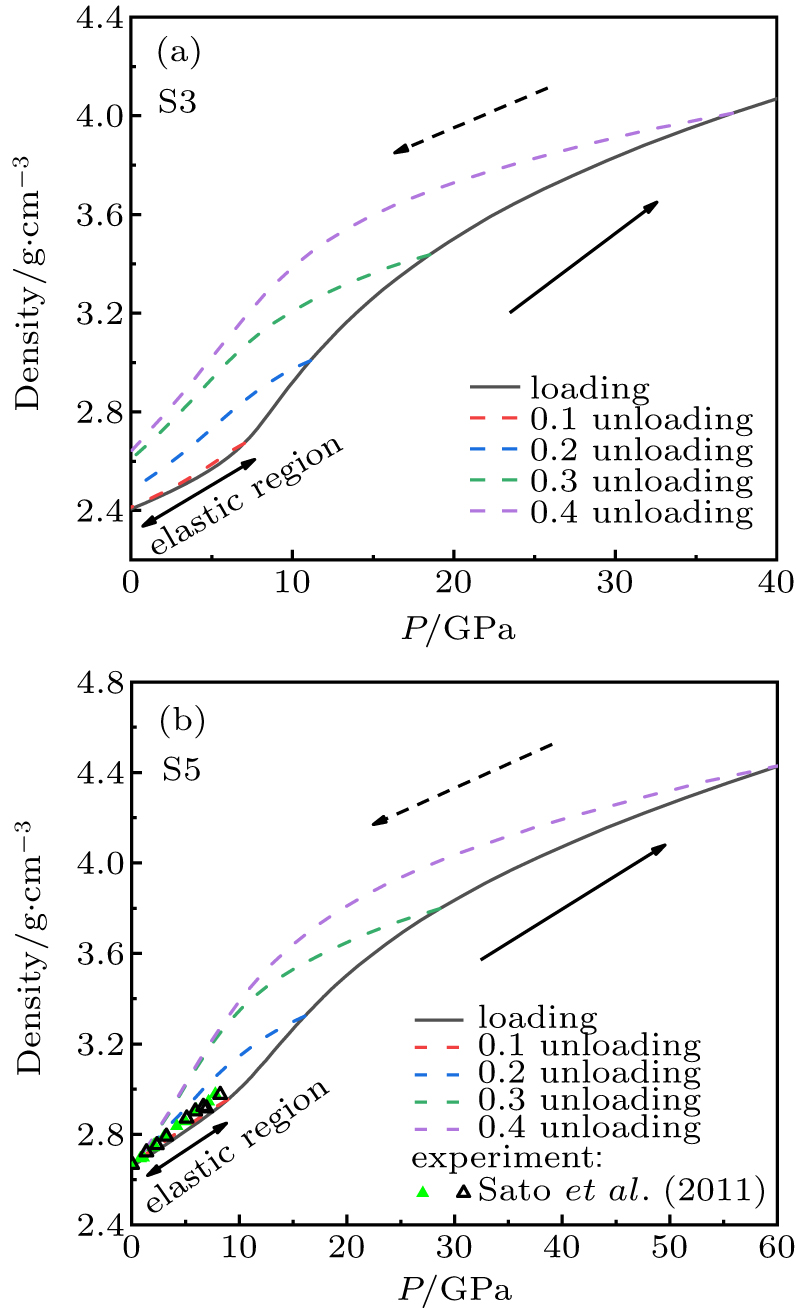
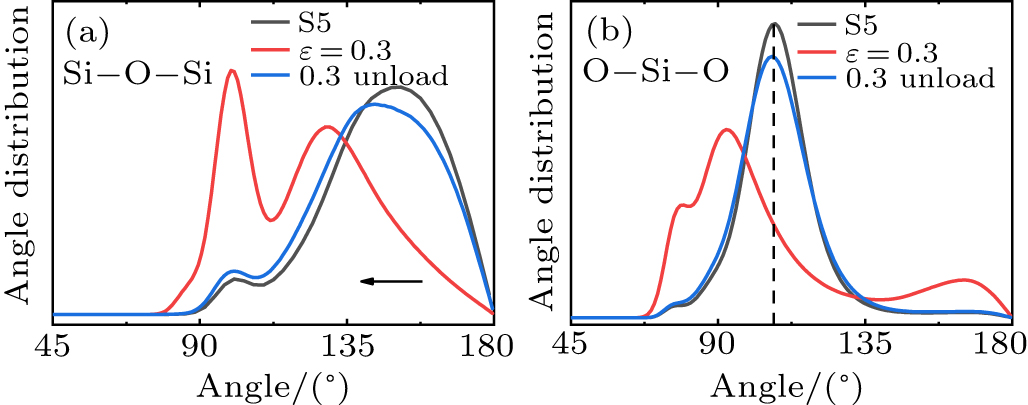
Abstract We investigate the mechanical and microstructural changes of the densified silica glass under uniaxial loading-unloading via atomistic simulations with a modified BKS potential. The stress–strain relationship is found to include three respective stages: elastic, plastic and hardening regions. The bulk modulus increases with the initial densification and will undergo a rapid increase after complete densification. The yield pressure varies from 5 to 12 GPa for different densified samples. In addition, the Si–O–Si bond angle reduces during elastic deformation under compression, and 5-fold Si will increase linearly in the plastic deformation. In the hardening region, the peak splitting and the new peak are both found on the Si–Si and O–O pair radial distribution functions, where the 6-fold Si is increased. Instead, the lateral displacement of the atoms always varies linearly with strain, without evident periodic characteristic. As is expected, the samples are permanently densified after release from the plastic region, and the maximum density of recovered samples is about 2.64 g/cm3, which contains 15 % 5-fold Si, and the Si–O–Si bond angle is less than the ordinary silica glass. All these findings are of great significance for understanding the deformation process of densified silica glass.
|
Received: 10 April 2020
Revised: 15 June 2020
Accepted manuscript online: 15 July 2020
|
|
PACS:
|
81.05.Kf
|
(Glasses (including metallic glasses))
|
| |
81.70.Bt
|
(Mechanical testing, impact tests, static and dynamic loads)
|
|
|
Corresponding Authors:
†Corresponding author. E-mail: lyj@aphy.iphy.ac.cn ‡Corresponding author. E-mail: shao_jianli@bit.edu.cn §Corresponding author. E-mail: meiyong1990@126.com
|
| About author: †Corresponding author. E-mail: lyj@aphy.iphy.ac.cn ‡Corresponding author. E-mail: shao_jianli@bit.edu.cn §Corresponding author. E-mail: meiyong1990@126.com * Project supported by the National Natural Science Foundation of China (Grant Nos. 51727807 and 11875318), Beijing Institute of Technology Research Fund Program for Young Scholars, and Yue Qi Young Scholar Project in CUMTB. |
Cite this article:
Yi-Fan Xie(谢轶凡), Feng Feng(冯锋), Ying-Jun Li(李英骏)†, Zhi-Qiang Hu(胡志强), Jian-Li Shao(邵建立)‡, and Yong Mei(梅勇)§ Mechanical and microstructural response of densified silica glass under uniaxial compression: Atomistic simulations 2020 Chin. Phys. B 29 108101
|
| [1] |
Vandembroucq D, Deschamps T, Coussa C, Perriot A, Barthel E, Champagnon B, Martinet C 2008 J. Phys.: Condes. Matter 20 485221 DOI: 10.1088/0953-8984/20/48/485221 |
| [2] |
|
| [3] |
|
| [4] |
|
| [5] |
|
| [6] |
Sonneville C, Mermet A, Champagnon B, Martinet C, Margueritat J, Ligny D, Deschamps T, Balima F 2012 J. Chem. Phys. 137 124505 DOI: 10.1063/1.4754601 |
| [7] |
|
| [8] |
|
| [9] |
|
| [10] |
|
| [11] |
Benmore C J, Soignard E, Amin S A, Guthrie M, Shastri S D, Lee P L, Yarger J L 2010 Phys. Rev. B 81 054105 DOI: 10.1103/PhysRevB.81.054105 |
| [12] |
|
| [13] |
|
| [14] |
El’kin F S, Brazhkin V V, Khvostantsev L G E, Tsiok O B, Lyapin A G E 2002 Jetp Lett. 75 342 DOI: 10.1134/1.1485264 |
| [15] |
|
| [16] |
|
| [17] |
Zeidler A, Wezka K, Rowlands R F, Whittaker D A, Salmon P S, Polidori A, Drewitt J W E, Klotz S, Fischer H E, Wilding M C, Bull C L, Tucker M G, Wilson M 2014 Phys. Rev. Lett. 113 135501 DOI: 10.1103/PhysRevLett.113.135501 |
| [18] |
Guerette M, Ackerson M R, Thomas J, Yuan F, Watson E B, Walker D, Huang L 2015 Sci. Rep. 5 15343 DOI: 10.1038/srep15343 |
| [19] |
Dávila L P, Caturla M J, Kubota A, Sadigh B, Rubia T D, Shackelford J F, Risbud S H, Garofalini S H 2003 Phys. Rev. Lett. 91 205501 DOI: 10.1103/PhysRevLett.91.205501 |
| [20] |
Kubota A, Caturla M J, Davila L, Stolken J, Sadigh B, Quong A, Rubenchik A M, Feit M D 2002 Laser-Induced Damage in Optical Materials October 1–3, 2001 Boulder, CO, USA 108 DOI: 10.1117/12.461717 |
| [21] |
Renou R, Soulard L, Lescoute E, Dereure C, Loison D, Guin J P 2017 J. Phys. Chem. C 121 13324 DOI: 10.1021/acs.jpcc.7b01324 |
| [22] |
|
| [23] |
|
| [24] |
Su R, Xiang M, Chen J, Jiang S, Wei H 2014 J. Appl. Phys. 115 193508 DOI: 10.1063/1.4876742 |
| [25] |
Huang L, Yuan F, Guerette M, Zhao Q, Sundararaman S 2017 J. Mater. Res. 32 174 DOI: 10.1557/jmr.2016.397 |
| [26] |
|
| [27] |
|
| [28] |
|
| [29] |
|
| [30] |
|
| [31] |
|
| [32] |
|
| [33] |
|
| [34] |
|
| [35] |
|
| [36] |
|
| [37] |
|
| [38] |
|
| [39] |
|
| [40] |
|
| [41] |
|
| [42] |
|
| [43] |
|
| [44] |
|
| [45] |
|
| No Suggested Reading articles found! |
|
|
Viewed |
|
|
|
Full text
|
|
|
|
|
Abstract
|
|
|
|
|
Cited |
|
|
|
|
Altmetric
|
|
blogs
Facebook pages
Wikipedia page
Google+ users
|
Online attention
Altmetric calculates a score based on the online attention an article receives. Each coloured thread in the circle represents a different type of online attention. The number in the centre is the Altmetric score. Social media and mainstream news media are the main sources that calculate the score. Reference managers such as Mendeley are also tracked but do not contribute to the score. Older articles often score higher because they have had more time to get noticed. To account for this, Altmetric has included the context data for other articles of a similar age.
View more on Altmetrics
|
|
|