|
|
|
Effect of degree correlation on edge controllability of real networks |
| Shu-Lin Liu(刘树林) and Shao-Peng Pang(庞少鹏)† |
| 1 School of Electrical Engineering and Automation, Qilu University of Technology (Shandong Academy of Science), Jinan 250353, China |
|
|
|
|
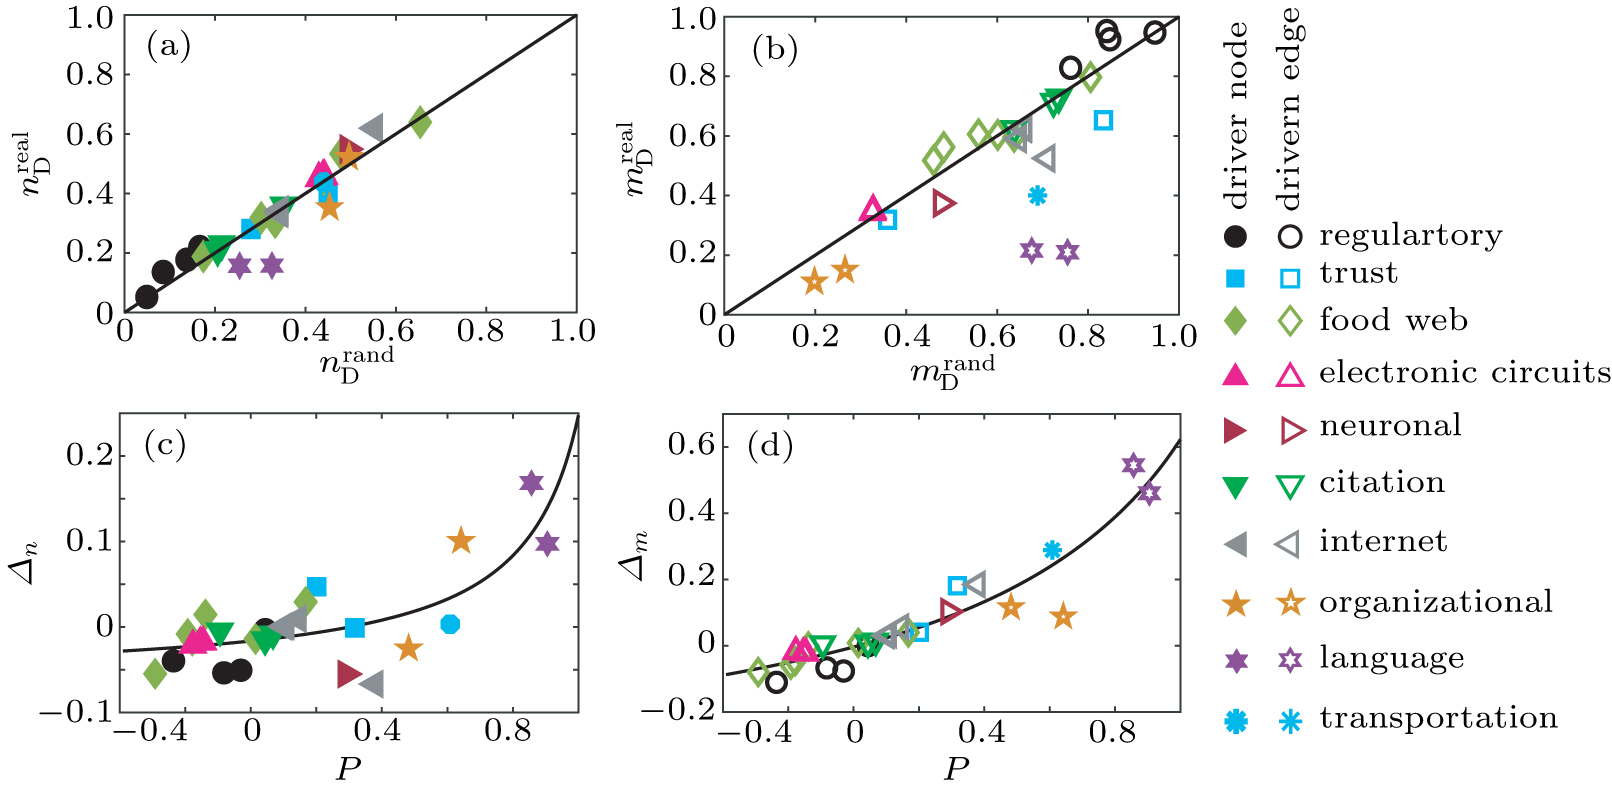
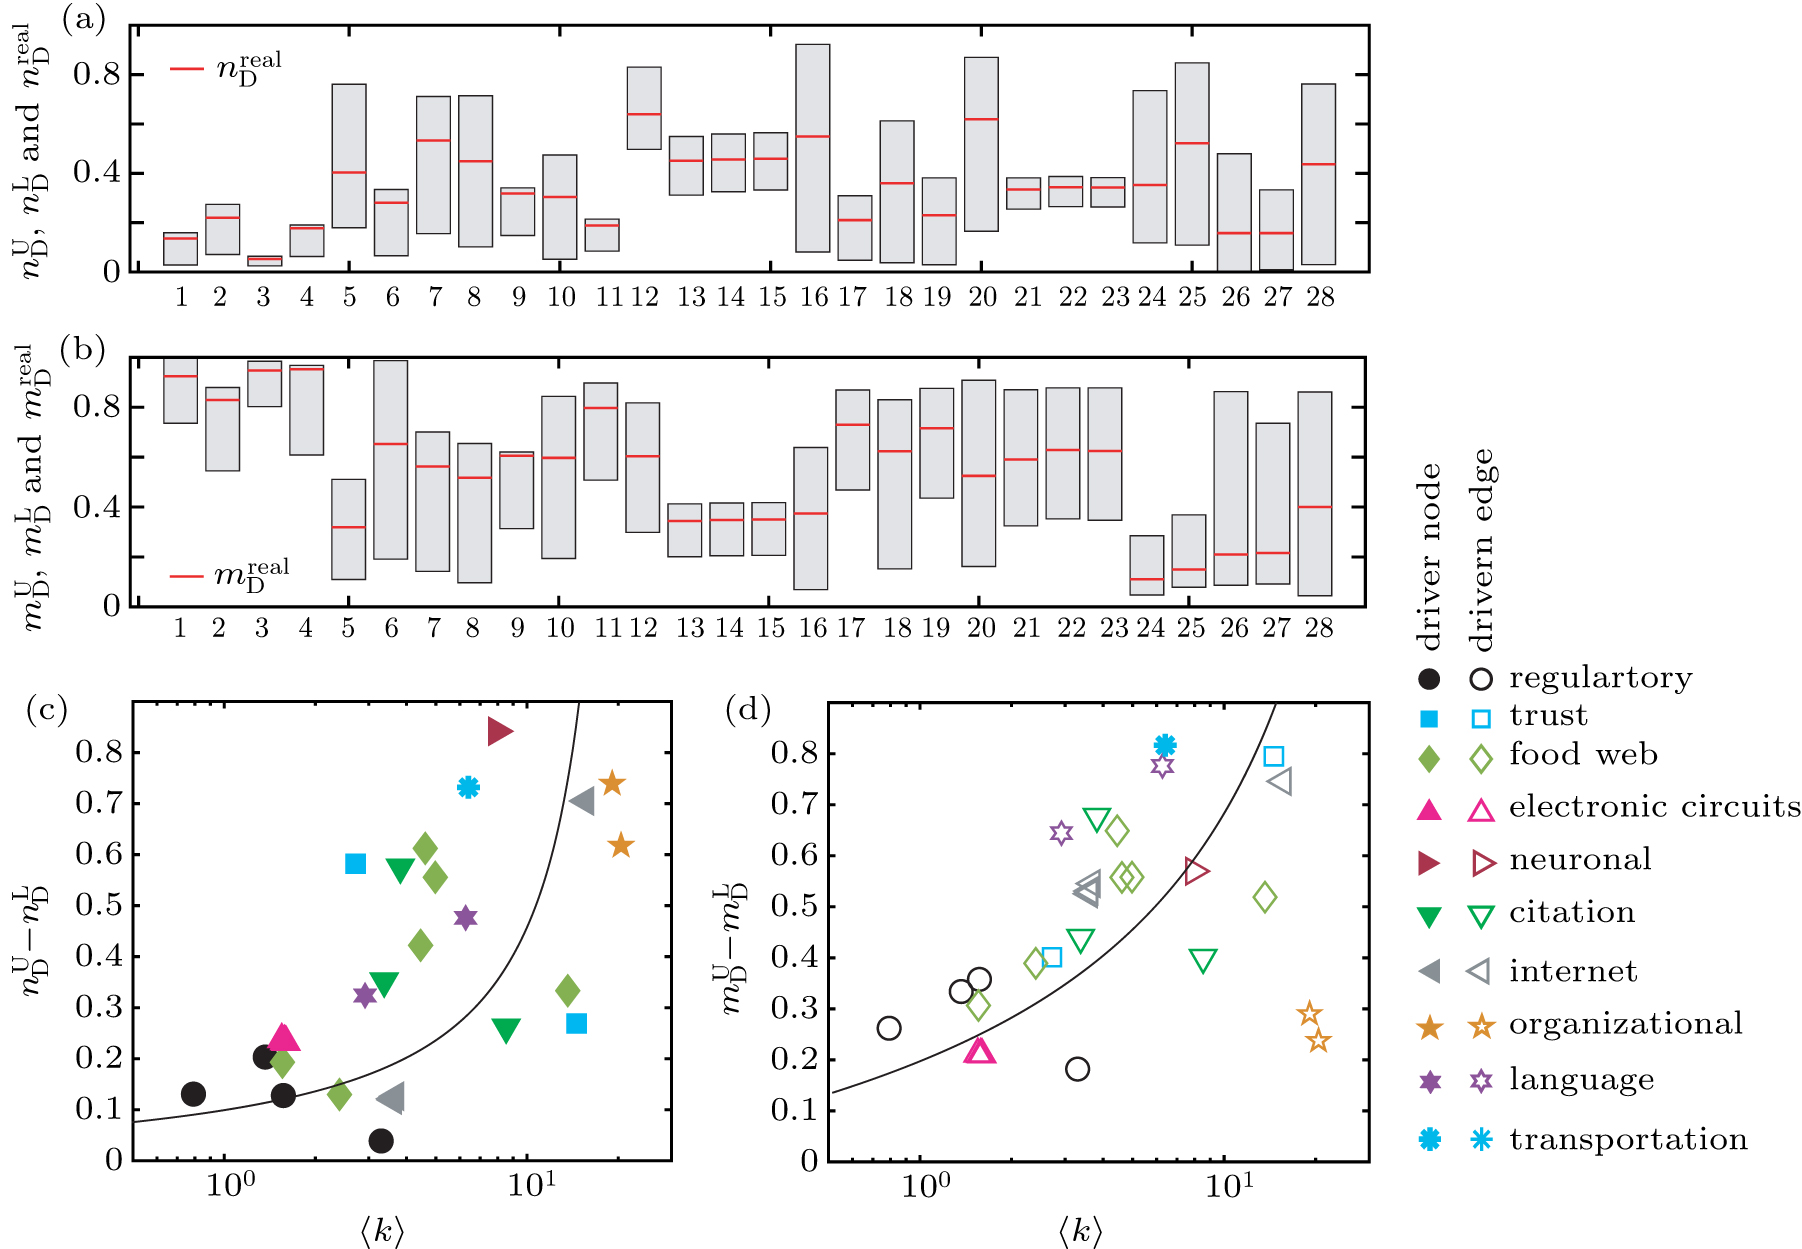
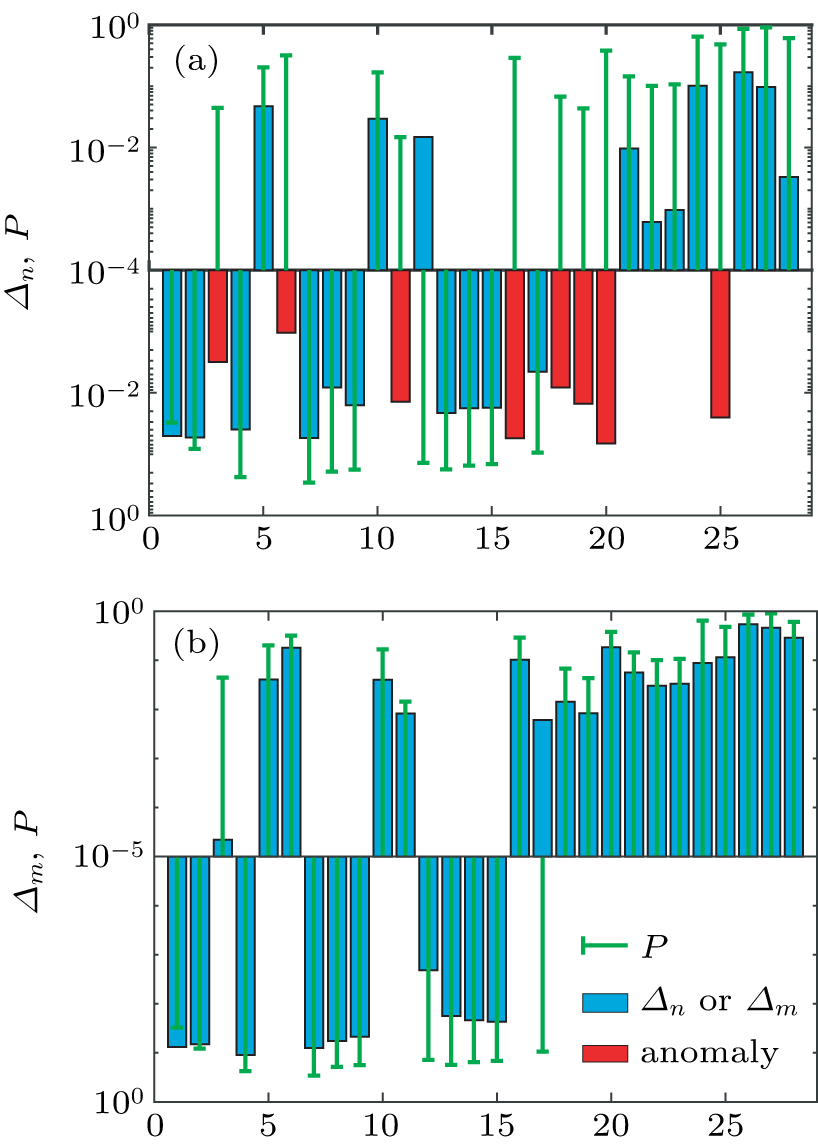
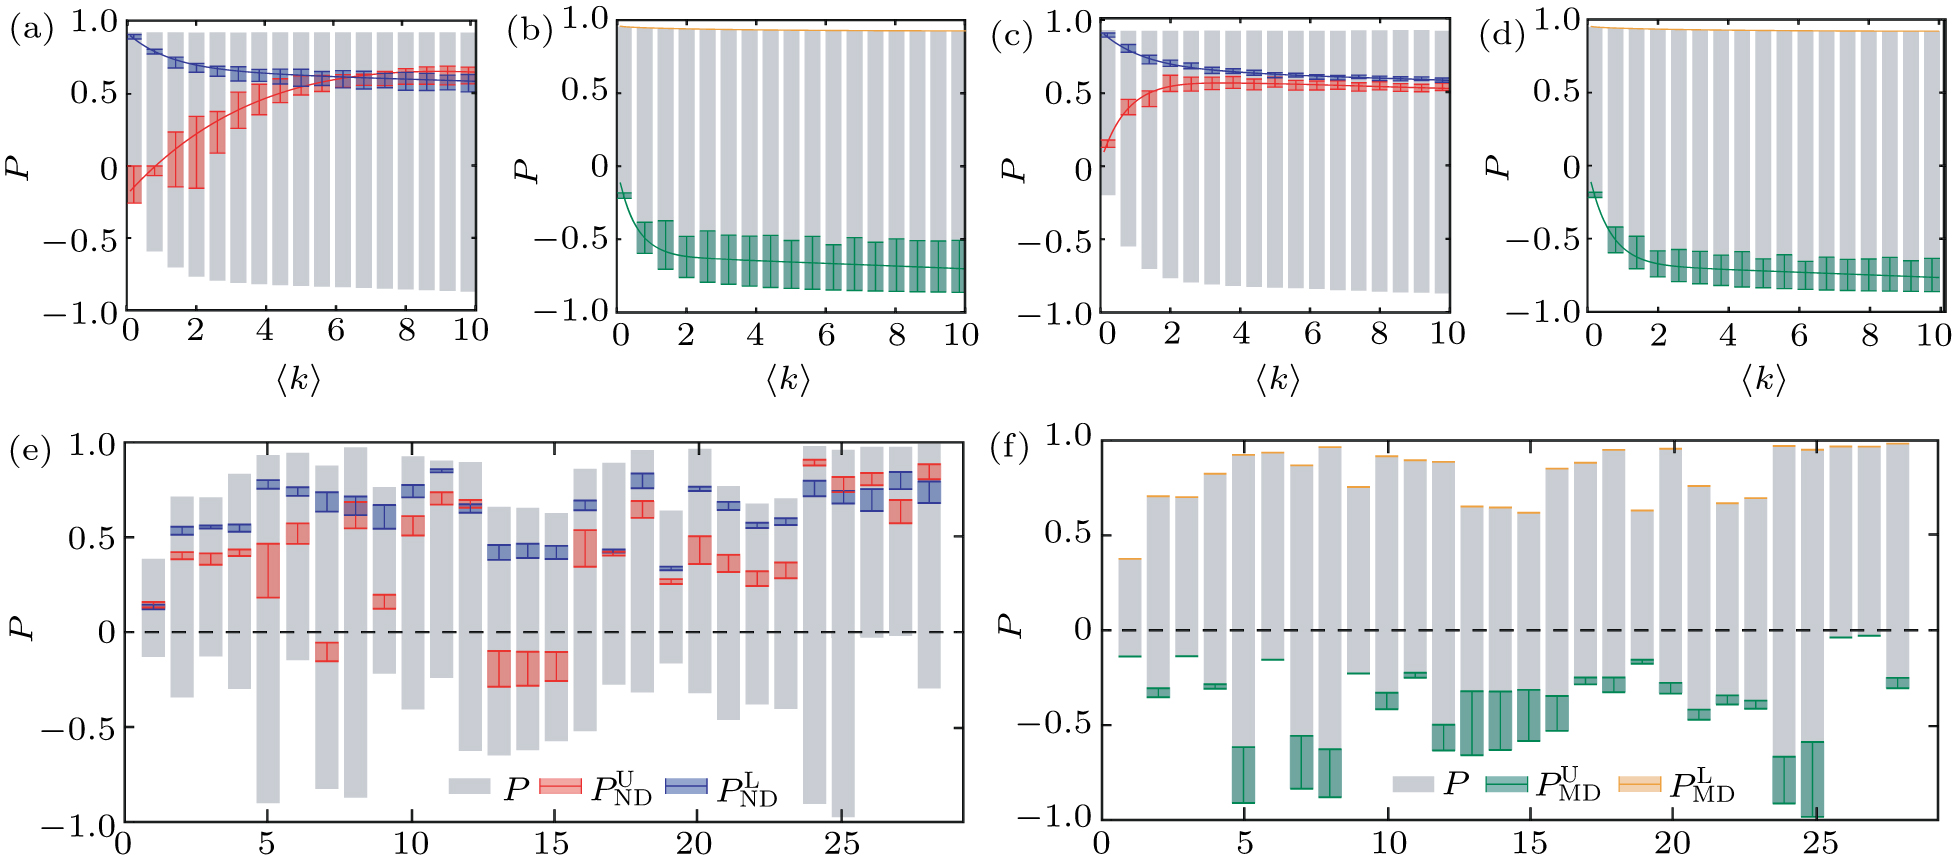
Abstract We use the controllability limit theory to study impact of correlation between in- and out-degrees (degree correlation) on edge controllability of real networks. Simulation results and analytic calculations show that the degree correlation plays an important role in the edge controllability of real networks, especially dense real networks. The upper and lower controllability limits hold for all kinds of real networks. Any edge controllability in between the limits is achievable by properly adjusting the degree correlation. In addition, we find that the edge dynamics in some real networks with positive degree correlation may be difficult to control, and explain the rationality of this anomaly based on the controllability limit theory.
|
Received: 05 April 2020
Revised: 24 May 2020
Accepted manuscript online: 05 June 2020
|
|
PACS:
|
02.30.Yy
|
(Control theory)
|
| |
89.75.Fb
|
(Structures and organization in complex systems)
|
|
|
Corresponding Authors:
†Corresponding author. E-mail: shaopengpang@qlu.edu.cn
|
| About author: †Corresponding author. E-mail: shaopengpang@qlu.edu.cn * Project supported by the National Natural Science Foundation of China (Grant No. 61903208). |
Cite this article:
Shu-Lin Liu(刘树林) and Shao-Peng Pang(庞少鹏)† Effect of degree correlation on edge controllability of real networks 2020 Chin. Phys. B 29 100202
|
| [1] |
|
| [2] |
|
| [3] |
Chui C K, Chen G 2012 Linear systems and optimal control Berlin Springer Science & Business Media
|
| [4] |
|
| [5] |
|
| [6] |
Yuan Z Z, Zhao C, Di Z R, Wang W X, Lai Y C 2013 Nat. Commun. 4 2447 DOI: 10.1038/ncomms3447 |
| [7] |
|
| [8] |
|
| [9] |
Yan G, Tsekenis G, Barzel B, Slotine J J, Liu Y Y, Barabási A L 2015 Nat. Phys. 11 779 DOI: 10.1038/nphys3422 |
| [10] |
|
| [11] |
|
| [12] |
|
| [13] |
|
| [14] |
|
| [15] |
|
| [16] |
Su H, Wu H, Chen X, Chen M Z 2017 IEEE Transactions on Systems, Man, and Cybernetics: Systems 48 2242 DOI: 10.1109/TSMC.2017.2765678 |
| [17] |
|
| [18] |
|
| [19] |
Wu H, Lam J, Su H 2019 IEEE Transactions on Systems, Man, and Cybernetics: Systems August 14, 2019 1 10 DOI: 10.1109/TSMC.2019.2931411 |
| [20] |
|
| [21] |
|
| [22] |
|
| [23] |
|
| [24] |
|
| [25] |
|
| [26] |
Pósfai M, Liu Y Y, Slotine J J, Barabási A L 2013 Sci. Rep. 3 1067 DOI: 10.1038/srep01067 |
| [27] |
Benesty J, Chen J, Huang Y, Cohen I 2009 Noise reduction in speech processing Berlin Springer Science & Business Media
|
| [28] |
Kim Norlen G L, Gebbie M, Chuang J 2002 Proceedings of International Telecommunications Society 14th Biennial Conference August 2002 South Korea
|
| [29] |
|
| [30] |
|
| [31] |
Milo R, Itzkovitz S, Kashtan N, Levitt R, Shen-Orr S, Ayzenshtat I, Sheffer M, Alon U 2004 Science 303 1538 DOI: 10.1126/science.1089167 |
| [32] |
|
| [33] |
|
| [34] |
|
| [35] |
|
| [36] |
|
| [37] |
|
| [38] |
|
| [39] |
|
| [40] |
|
| [41] |
Adamic L A, Glance N 2005 Proceedings of the 3rd international workshop on link discovery August 2005 New York, USA 36 43
|
| [42] |
Leskovec J, Kleinberg J, Faloutsos C 2007 ACM Transactions on Knowledge Discovery from Data 1 2 DOI: 10.1145/1217299.1217301 |
| [43] |
Freeman S C, Freeman L C 1979 The networkers network: A study of the impact of a new communications medium on sociometric structure Social Science Research Reports No. 46 University of California Irvine, CA
|
| [44] |
Cross R L, Cross R L, Parker A 2004 The hidden power of social networks: Understanding how work really gets done in organizations Boston Harvard Business Press
|
| [45] |
|
| No Suggested Reading articles found! |
|
|
Viewed |
|
|
|
Full text
|
|
|
|
|
Abstract
|
|
|
|
|
Cited |
|
|
|
|
Altmetric
|
|
blogs
Facebook pages
Wikipedia page
Google+ users
|
Online attention
Altmetric calculates a score based on the online attention an article receives. Each coloured thread in the circle represents a different type of online attention. The number in the centre is the Altmetric score. Social media and mainstream news media are the main sources that calculate the score. Reference managers such as Mendeley are also tracked but do not contribute to the score. Older articles often score higher because they have had more time to get noticed. To account for this, Altmetric has included the context data for other articles of a similar age.
View more on Altmetrics
|
|
|