|
|
|
Soliton molecules and dynamics of the smooth positon for the Gerdjikov–Ivanov equation |
| Xiangyu Yang(杨翔宇), Zhao Zhang(张钊), and Biao Li(李彪)† |
| 1 School of Mathematics and Statistics, Ningbo University, Ningbo 315211, China |
|
|
|
|
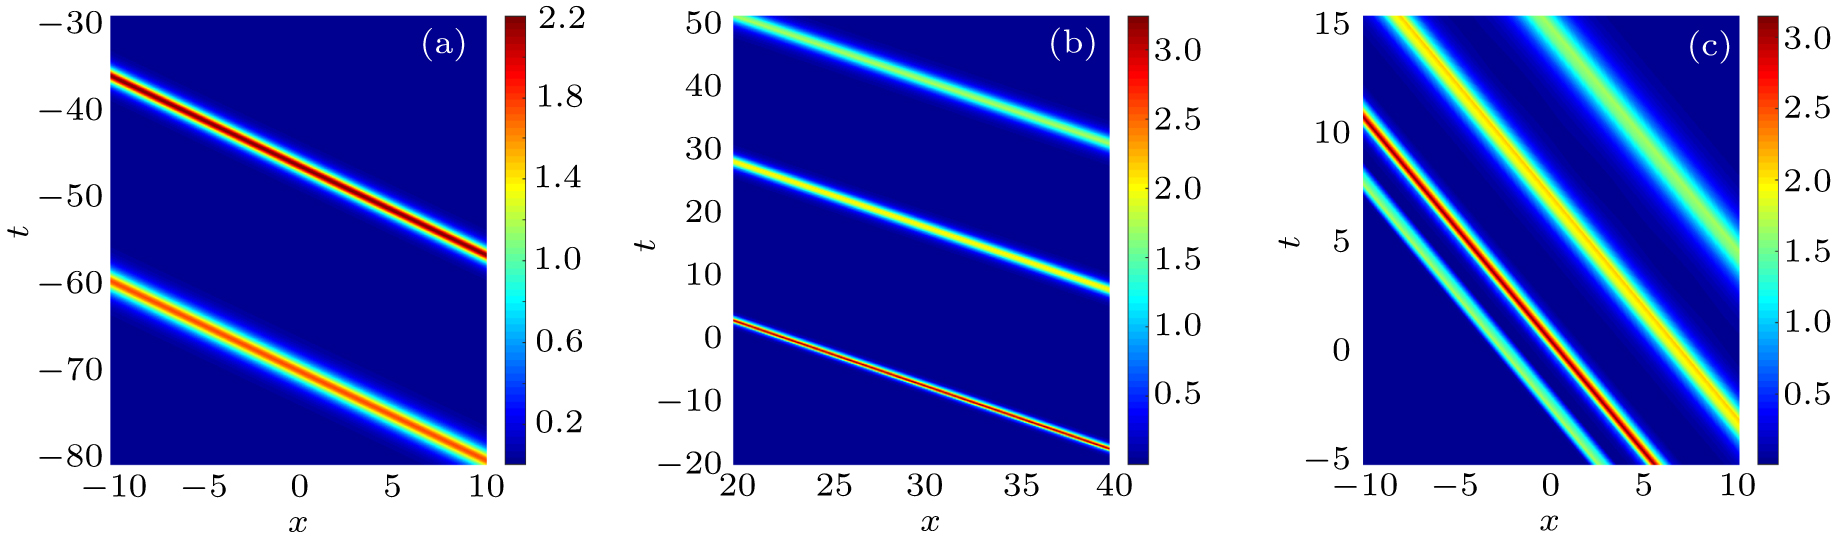
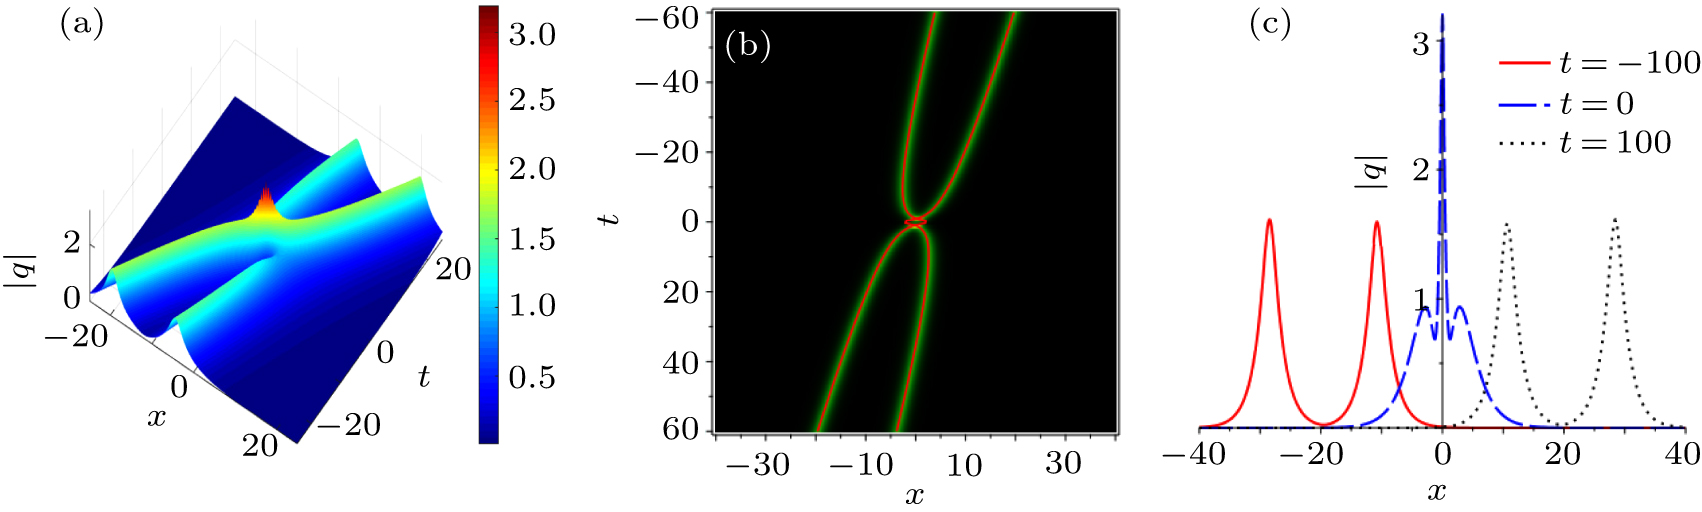
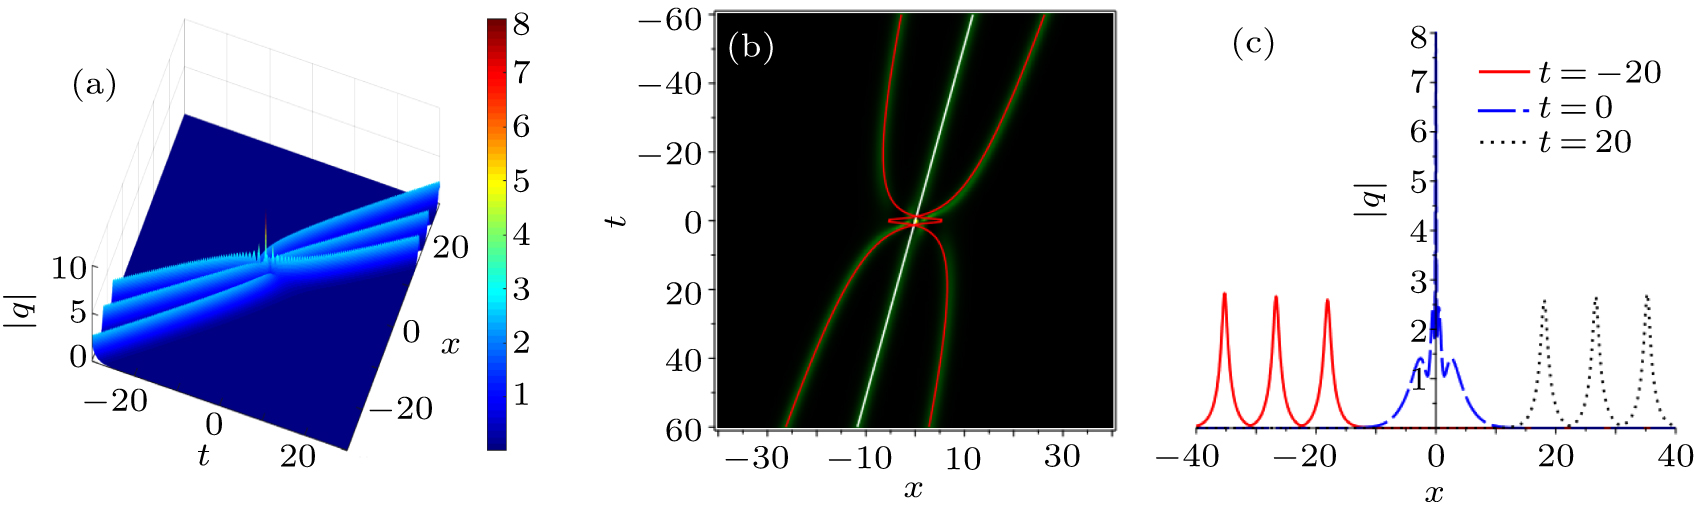
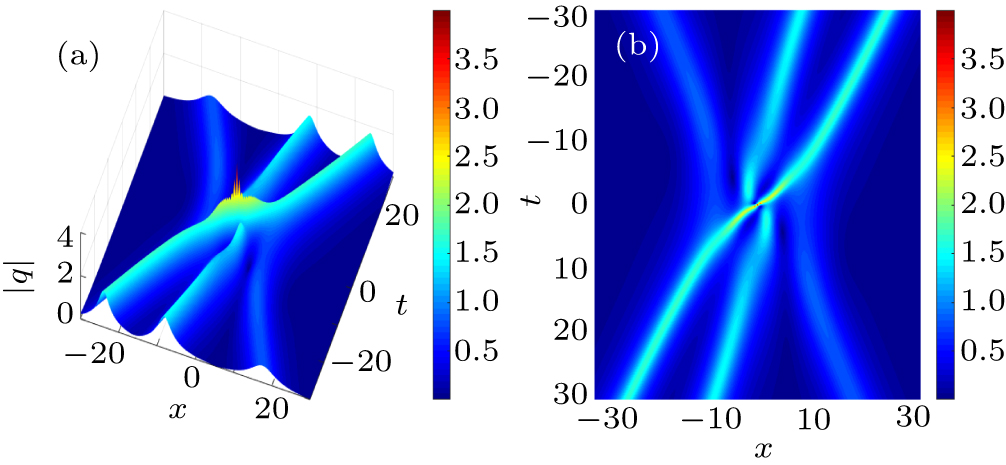
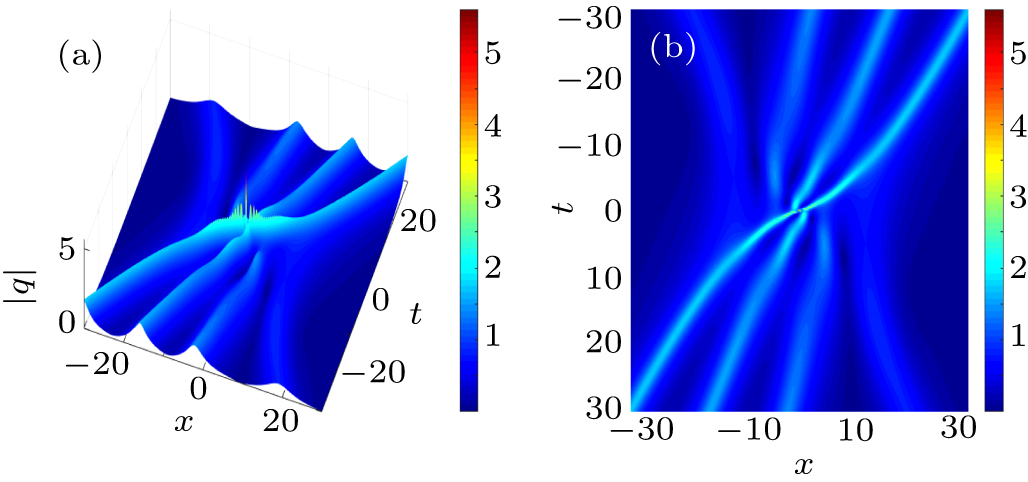
Abstract Soliton molecules are firstly obtained by velocity resonance for the Gerdjikov–Ivanov equation, and n-order smooth positon solutions for the Gerdjikov–Ivanov equation are generated by means of the general determinant expression of n-soliton solution. The dynamics of the smooth positons of the Gerdjikov–Ivanov equation are discussed using the decomposition of the modulus square, the trajectories and time-dependent “phase shifts” of positons after the collision can be described approximately. Additionally, some novel hybrid solutions consisting solitons and positons are presented and their rather complicated dynamics are revealed.
|
Received: 13 February 2020
Revised: 05 June 2020
Accepted manuscript online: 18 June 2020
|
|
PACS:
|
05.45.Yv
|
(Solitons)
|
| |
02.30.Ik
|
(Integrable systems)
|
|
|
Corresponding Authors:
†Corresponding author. E-mail: libiao@nbu.edu.cn
|
| About author: †Corresponding author. E-mail: libiao@nbu.edu.cn * Project supported by the National Natural Science Foundation of China (Grant Nos. 11775121 and 11435005), and the K. C. Wong Magna Fund in Ningbo University. |
Cite this article:
Xiangyu Yang(杨翔宇), Zhao Zhang(张钊), and Biao Li(李彪)† Soliton molecules and dynamics of the smooth positon for the Gerdjikov–Ivanov equation 2020 Chin. Phys. B 29 100501
|
| [1] |
|
| [2] |
|
| [3] |
|
| [4] |
|
| [5] |
|
| [6] |
|
| [7] |
Gerdjikov V S, Ivanov I 1983 Bulg. J. Phys. 10 130
|
| [8] |
|
| [9] |
|
| [10] |
|
| [11] |
|
| [12] |
|
| [13] |
Crasovan L, Kartashov Y, Mihalache D, Torner L, Kivshar Y, Pérez-García V 2003 Phys. Rev. E 67 046610 DOI: 10.1103/PhysRevE.67.046610 |
| [14] |
|
| [15] |
|
| [16] |
|
| [17] |
|
| [18] |
Peng J S, Sorokina M, Sugavanam S, Tarasov N, Churkin D V, Turitsyn S K, Zeng H P 2018 Commun. Phys. 1 20 DOI: 10.1038/s42005-018-0022-7 |
| [19] |
|
| [20] |
|
| [21] |
|
| [22] |
|
| [23] |
|
| [24] |
|
| [25] |
|
| [26] |
|
| [27] |
|
| [28] |
|
| [29] |
|
| [30] |
|
| [31] |
|
| [32] |
|
| [33] |
|
| [34] |
|
| [35] |
|
| [36] |
|
| [37] |
|
| [38] |
|
| [39] |
|
| [40] |
|
| [41] |
|
| [42] |
|
| [43] |
|
| No Suggested Reading articles found! |
|
|
Viewed |
|
|
|
Full text
|
|
|
|
|
Abstract
|
|
|
|
|
Cited |
|
|
|
|
Altmetric
|
|
blogs
Facebook pages
Wikipedia page
Google+ users
|
Online attention
Altmetric calculates a score based on the online attention an article receives. Each coloured thread in the circle represents a different type of online attention. The number in the centre is the Altmetric score. Social media and mainstream news media are the main sources that calculate the score. Reference managers such as Mendeley are also tracked but do not contribute to the score. Older articles often score higher because they have had more time to get noticed. To account for this, Altmetric has included the context data for other articles of a similar age.
View more on Altmetrics
|
|
|