| CONDENSED MATTER: STRUCTURAL, MECHANICAL, AND THERMAL PROPERTIES |
Prev
Next
|
|
|
Energy storage performances regulated by BiMnO3 proportion in limited solid solution films |
| Fei Guo(郭飞), Zhifeng Shi(史智锋), Yaping Liu(刘亚平), and Shifeng Zhao(赵世峰)† |
| School of Physical Science and Technology, Inner Mongolia Key Laboratory of Nanoscience and Nanotechnology, Inner Mongolia University, Hohhot 010021, China |
|
|
|
|
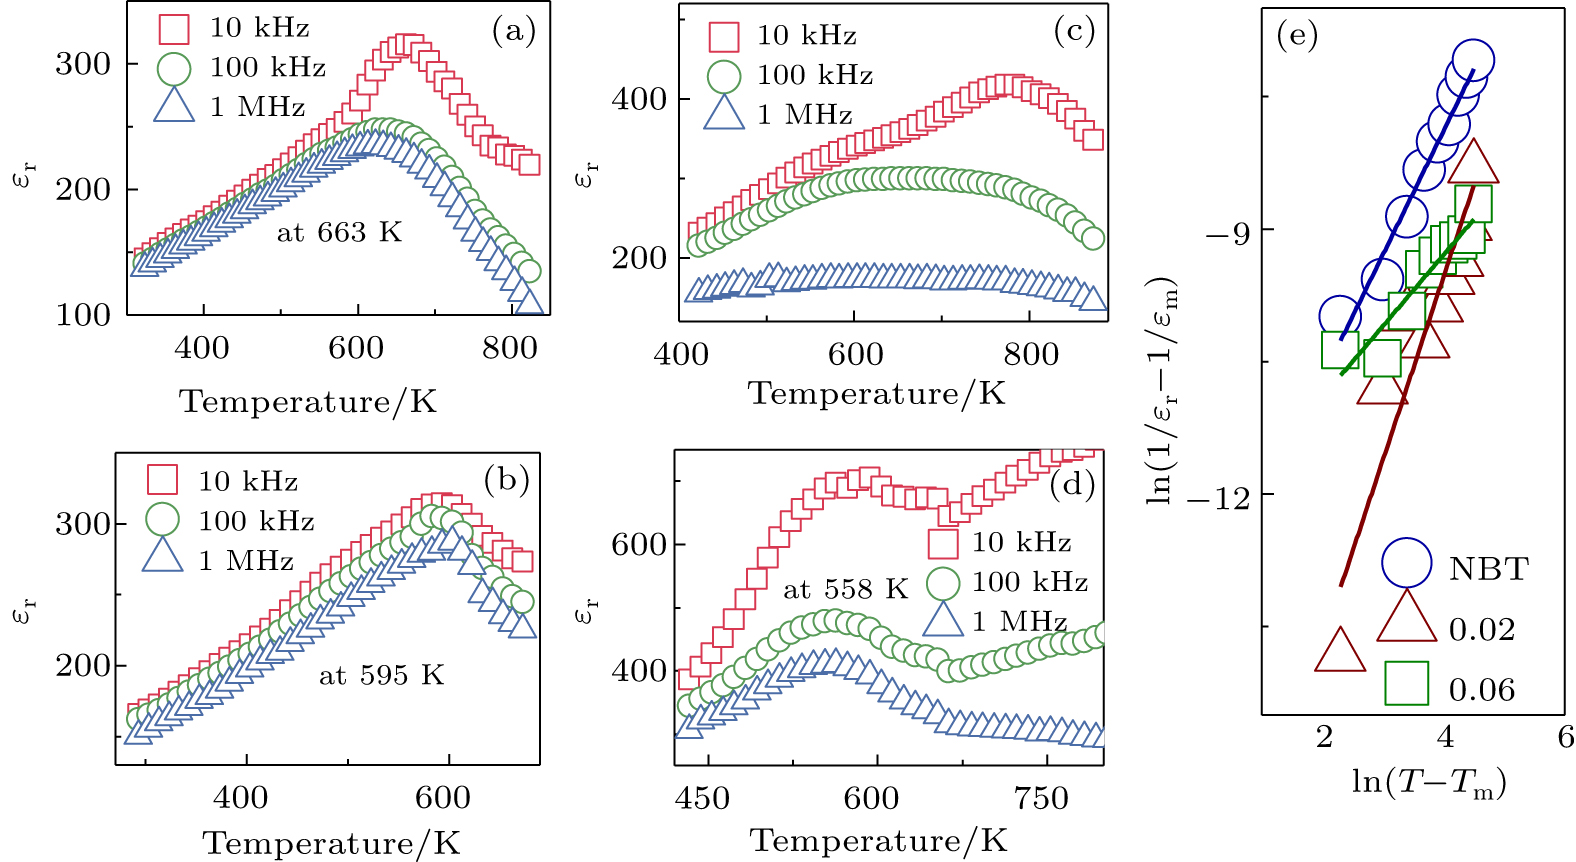
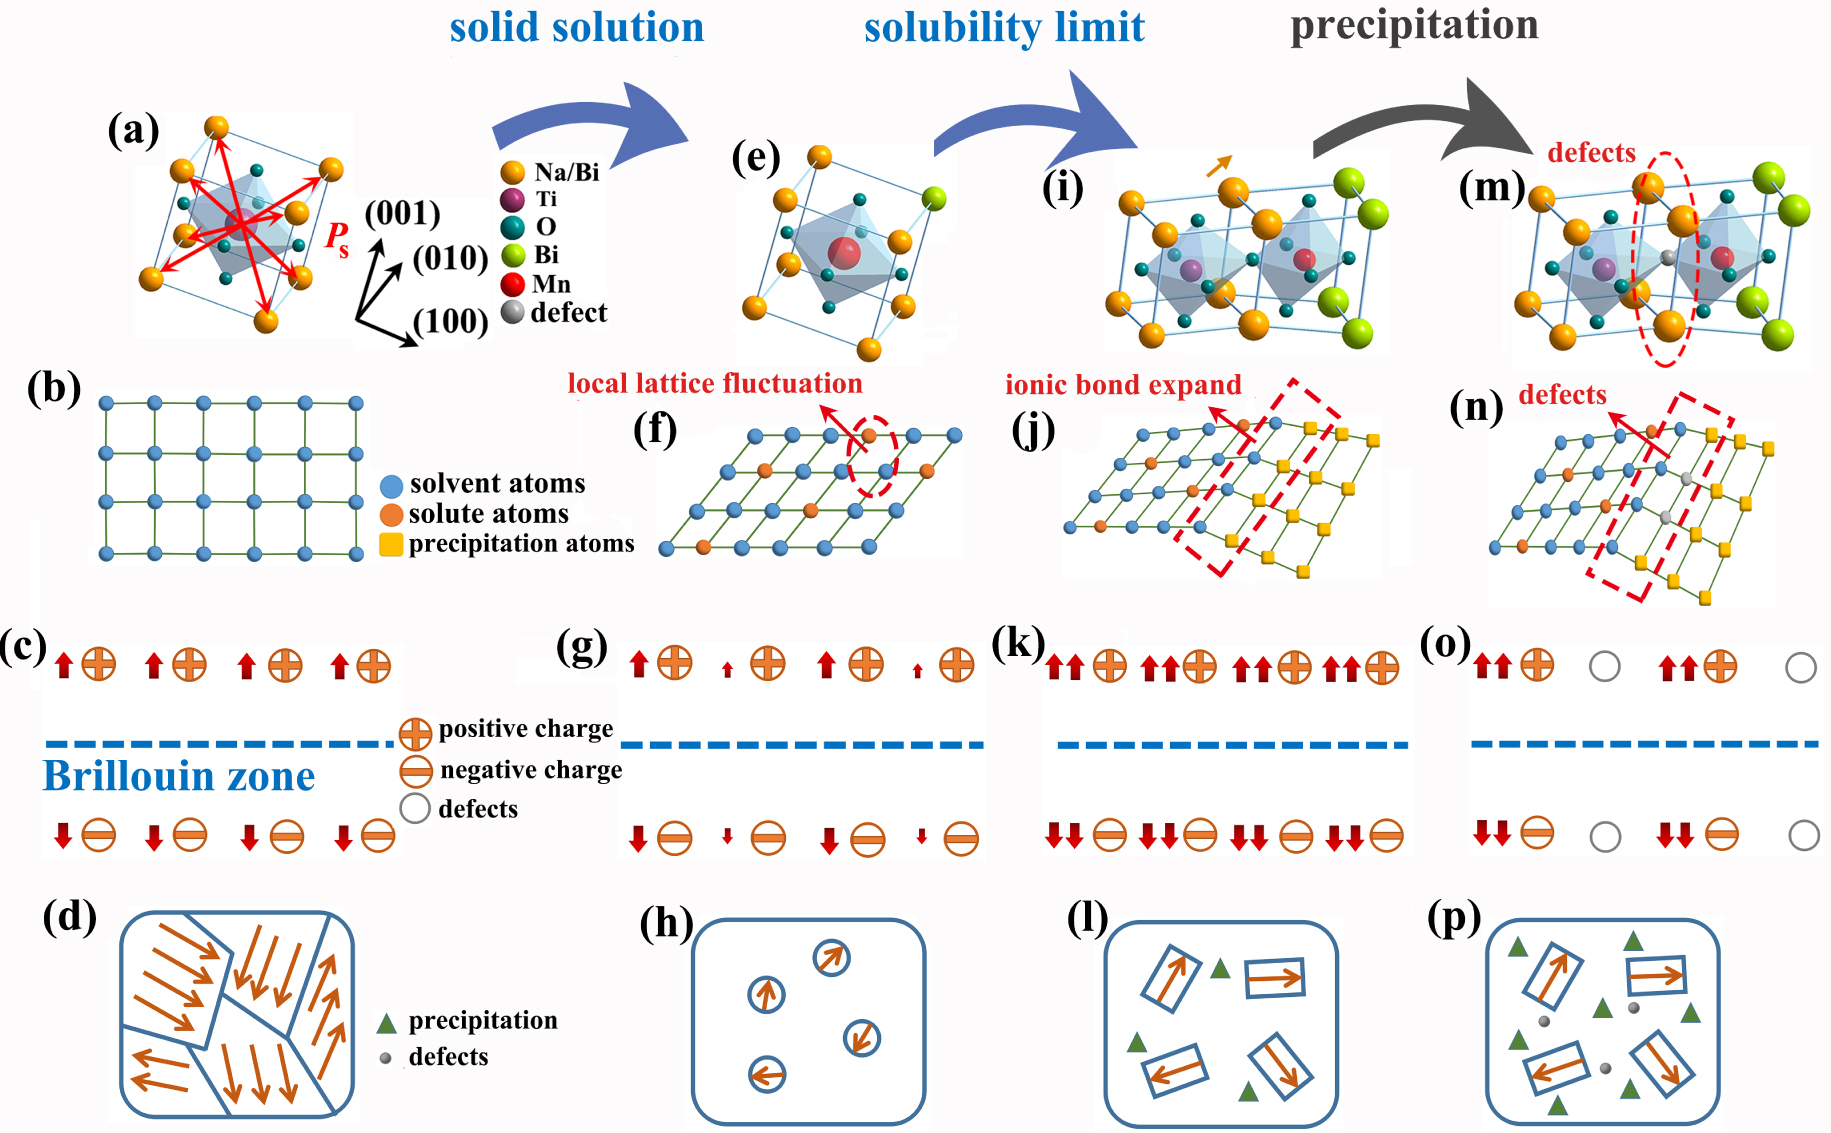
Abstract Na0.5Bi0.5TiO3–BiMnO3 (NBT–BM) limited solid solution films were fabricated to investigate the lattice modification on the energy storage performances. The introduction of the BM solute lattice induces the NBT solvent lattices undergoing the transition from the pure phase, solid solution, solubility limit to precipitation. Correspondingly, the polarization states transfer from the macroscopic ferroelectric domains to nanodomains then to compound ferroelectric domains. The introduction of BiMnO3 generates great lattice changes including the local lattice fluctuation and the large lattice stretching, which enhance the energy storage performances, with the energy storage efficiency being enhanced from 39.2% to 53.2% and 51.7% and the energy density being enhanced from 33.1 J/cm3 to 76.5 J/cm3 and 83.8 J/cm3 for the BM components of 2% and 4%, respectively. The lattice modifications play a key role in the energy storage performances for limited solid solution films, which provides an alternative strategy for energy storage material.
|
Received: 04 April 2020
Revised: 08 July 2020
Accepted manuscript online: 15 July 2020
|
| Fund: the National Natural Science Foundation of China (Grant Nos. 11864028 and 11564028) and Inner Mongolia Science Foundation, China (Grant No. 2018MS01003). |
|
Corresponding Authors:
†Corresponding author. E-mail: zhsf@imu.edu.cn
|
Cite this article:
Fei Guo(郭飞), Zhifeng Shi(史智锋), Yaping Liu(刘亚平), and Shifeng Zhao(赵世峰) Energy storage performances regulated by BiMnO3 proportion in limited solid solution films 2020 Chin. Phys. B 29 116801
|
| [1] |
Zhang X, Shen Y, Xu B et al. 2016 Adv. Mater. 28 2055
|
| [2] |
Liu C, Li F, Ma L P et al. 2010 Adv. Mater. 22 8
|
| [3] |
Zuo Z H, Zhan Q F et al. 2016 Chin. Phys. B 25 087702
|
| [4] |
Chu B, Zhou X, Ren K et al. 2006 Science 313 334
|
| [5] |
Yao Z. H, Song Z, Hao H et al. 2017 Adv. Mater. 29 1601727
|
| [6] |
Pan H, Zheng Y, Shen Y et al. 2017 J. Mater. Chem. A 5 5920
|
| [7] |
Wang G, Li J L, Zhang X et al. 2019 Energy Environ. Sci. 12 582
|
| [8] |
Cross L E 1987 Ferroelectrics 76 241
|
| [9] |
Thomas N W 1990 J. Phys. Chem. Solids. 51 1419
|
| [10] |
Chen C W, Xiang Y, Tang L G et al. 2019 Chin. Phys. B 28 127702
|
| [11] |
Xu K C, Chen Y 1999 J. Raman Spectrosc. 30 441
|
| [12] |
Birks E, Dunce M, Lgnatans R et al. 2016 J. Appl. Phys. 119 074102
|
| [13] |
Cui L, Hou Y D, Wang S et al. 2010 J. Appl. Phys. 107 054105
|
| [14] |
Guo F, Jiang N, Yang B et al. 2019 Appl. Phys. Lett. 114 253901
|
| [15] |
Kishimoto A, Koumoto K, Yanagida H 1989 J. Mater. Sci. 24 698
|
| [16] |
Kitanaka Y, Noguchi Y, Miyayama M et al. 2013 Ferroelectric 443 1
|
| [17] |
Fokam J M 2008 Commum. Math. Phys. 283 285
|
| [18] |
Pra P D, Fischer M, Regoli D 2013 J. Stat. Phy. 152 37
|
| [19] |
Kaya S, Chamorro E, Petrov D et al. 2017 Polyhedron 123 411
|
| [20] |
Ogihara H, Randall C A, McKinstry T S 2009 J. Am. Ceram. Soc. 92 110
|
| No Suggested Reading articles found! |
|
|
Viewed |
|
|
|
Full text
|
|
|
|
|
Abstract
|
|
|
|
|
Cited |
|
|
|
|
Altmetric
|
|
blogs
Facebook pages
Wikipedia page
Google+ users
|
Online attention
Altmetric calculates a score based on the online attention an article receives. Each coloured thread in the circle represents a different type of online attention. The number in the centre is the Altmetric score. Social media and mainstream news media are the main sources that calculate the score. Reference managers such as Mendeley are also tracked but do not contribute to the score. Older articles often score higher because they have had more time to get noticed. To account for this, Altmetric has included the context data for other articles of a similar age.
View more on Altmetrics
|
|
|