|
Special Issue:
SPECIAL TOPIC — Modeling and simulations for the structures and functions of proteins and nucleic acids
|
| SPECIAL TOPIC—Modeling and simulations for the structures and functions of proteins and nucleic acids |
Prev
Next
|
|
|
Quantitative modeling of bacterial quorum sensing dynamics in time and space |
| Xiang Li(李翔)1,2, Hong Qi(祁宏)3, Xiao-Cui Zhang(张晓翠)1, Fei Xu(徐飞)1, Zhi-Yong Yin(尹智勇)1, Shi-Yang Huang(黄世阳)4, Zhao-Shou Wang(王兆守)4,†, and Jian-Wei Shuai(帅建伟)1,2,5,‡ |
1 Department of Physics, College of Physical Science and Technology, Xiamen University, Xiamen 361005, China
2 State Key Laboratory of Cellular Stress Biology, Innovation Center for Cell Signaling Network, Xiamen University, Xiamen 361102, China
3 Complex Systems Research Center, Shanxi University, Taiyuan 030006, China
4 Institute of Biochemical Engineering, Department of Chemical and Biochemical Engineering, College of Chemistry and Chemical Engineering, Xiamen University, Xiamen 361005, China
5 National Institute for Data Science in Health and Medicine, Xiamen University, Xiamen 361102, China |
|
|
|
|
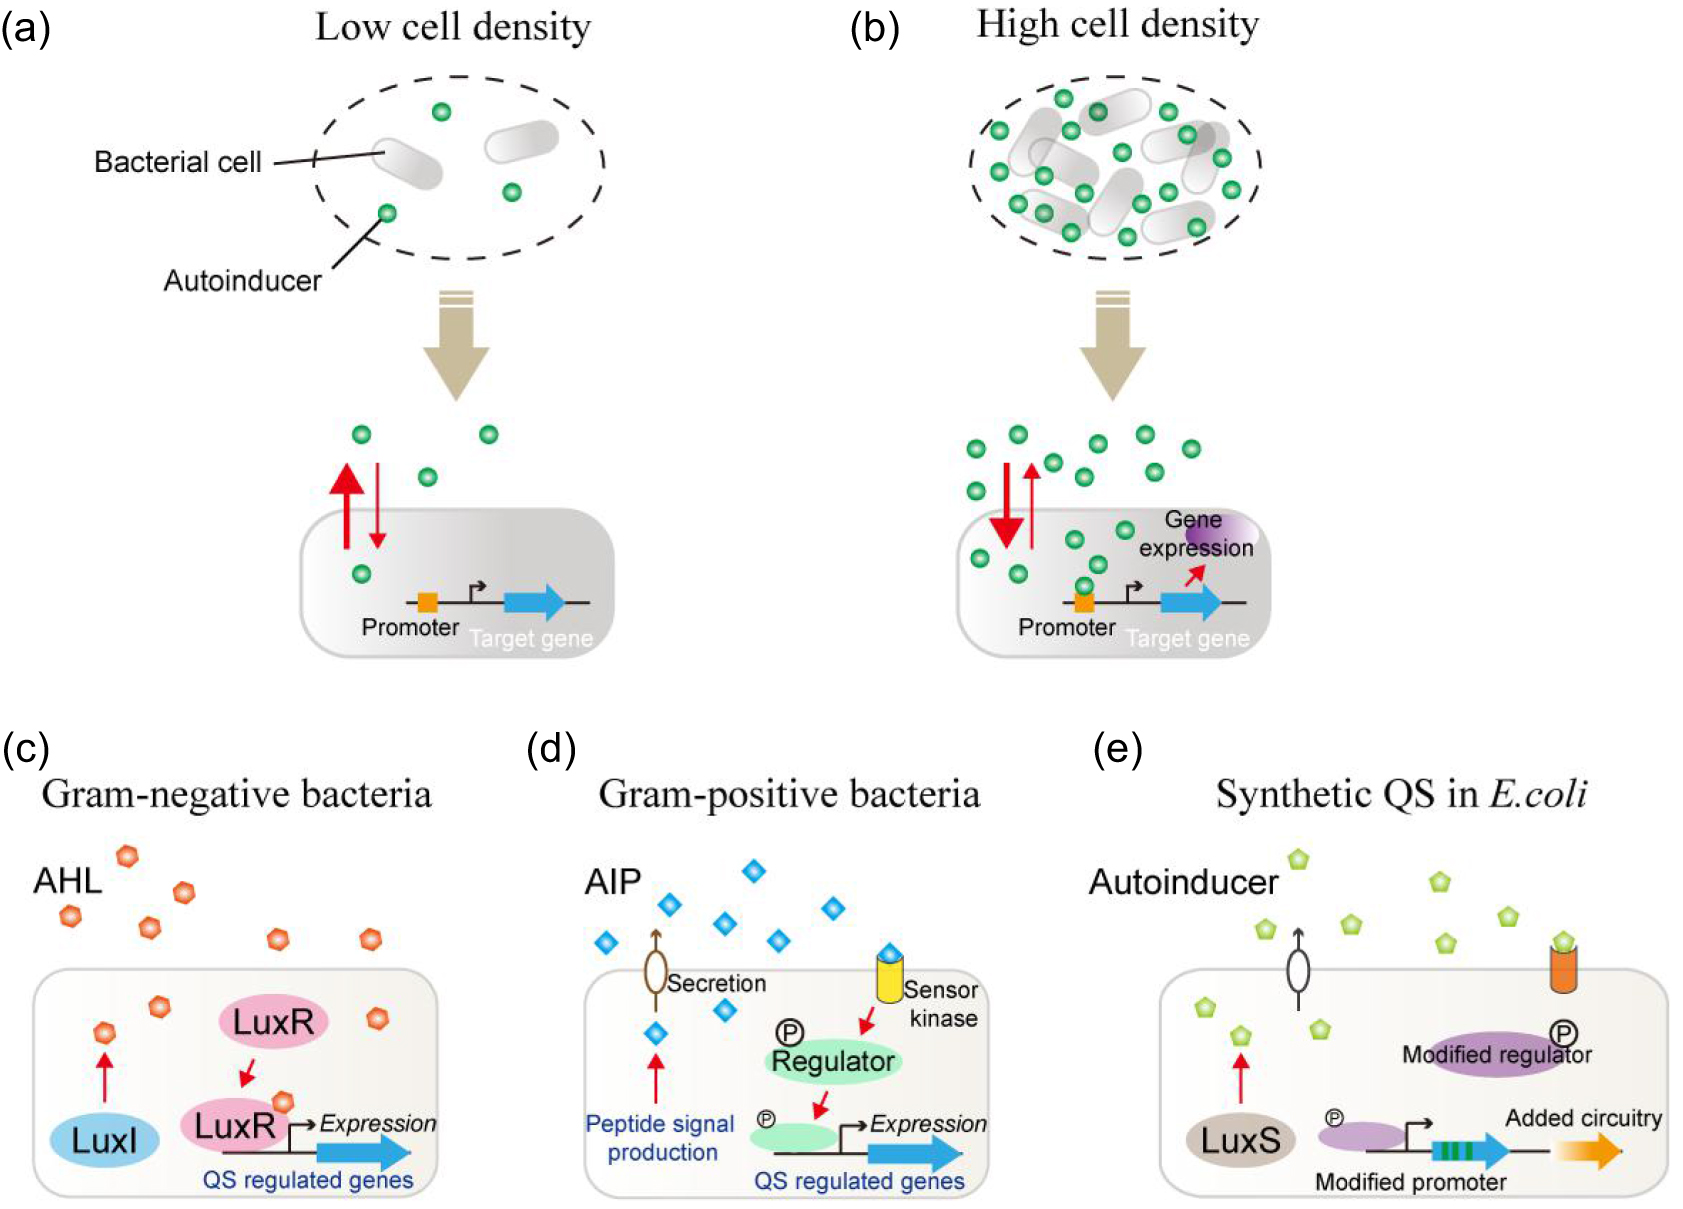
Abstract Quorum sensing (QS) refers to the cell communication through signaling molecules that regulate many important biological functions of bacteria by monitoring their population density. Although a wide spectrum of studies on the QS system mechanisms have been carried out in experiments, mathematical modeling to explore the QS system has become a powerful approach as well. In this paper, we review the research progress of network modeling in bacterial QS to capture the system’s underlying mechanisms. There are four types of QS system models for bacteria: the Gram-negative QS system model, the Gram-positive QS system model, the model for both Gram-negative and Gram-positive QS system, and the synthetic QS system model. These QS system models are mostly described by the ordinary differential equations (ODE) or partial differential equations (PDE) to study the changes of signaling molecule dynamics in time and space and the cell population density variations. Besides the deterministic simulations, the stochastic modeling approaches have also been introduced to discuss the noise effects on kinetics in QS systems. Taken together, these current modeling efforts advance our understanding of the QS system by providing systematic and quantitative dynamics description, which can hardly be obtained in experiments.
|
Received: 20 June 2020
Revised: 14 August 2020
Accepted manuscript online: 25 August 2020
|
|
PACS:
|
87.17.Aa
|
(Modeling, computer simulation of cell processes)
|
| |
87.18.Vf
|
(Systems biology)
|
| |
87.15.km
|
(Protein-protein interactions)
|
|
|
Corresponding Authors:
†Corresponding author. E-mail: wzs@xmu.edu.cn第一通讯作者 ‡Corresponding author. E-mail: jianweishuai@xmu.edu.cn
|
| About author: †Corresponding author. E-mail: wzs@xmu.edu.cn ‡Corresponding author. E-mail: jianweishuai@xmu.edu.cn * Project supported by the National Natural Science Foundation of China (Grant Nos. 11704318, 11675134, and 11874310) and the China Postdoctoral ScienceFoundation (Grant No. 2016M602071). |
Cite this article:
Xiang Li(李翔), Hong Qi(祁宏), Xiao-Cui Zhang(张晓翠), Fei Xu(徐飞), Zhi-Yong Yin(尹智勇), Shi-Yang Huang(黄世阳), Zhao-Shou Wang(王兆守)†, and Jian-Wei Shuai(帅建伟)‡ Quantitative modeling of bacterial quorum sensing dynamics in time and space 2020 Chin. Phys. B 29 108702
|
| [1] |
|
| [2] |
Grandclément C, Tannières M, Moréra S, Dessaux Y, Faure D 2016 FEMS Microbiol. Rev. 40 86 DOI: 10.1093/femsre/fuv038 |
| [3] |
|
| [4] |
|
| [5] |
|
| [6] |
|
| [7] |
|
| [8] |
|
| [9] |
|
| [10] |
|
| [11] |
|
| [12] |
Antunes L C M, Ferreira R B R, Buckner M M C, Finlay B B 2010 Microbiology 156 2271 DOI: 10.1099/mic.0.038794-0 |
| [13] |
|
| [14] |
|
| [15] |
|
| [16] |
|
| [17] |
Li J, Wang L, Hashimoto Y, Tsao C Y, Wood T K, Valdes J J, Zafiriou E, Bentley W E 2006 Mol. Syst. Biol. 2 67 DOI: 10.1038/msb4100107 |
| [18] |
|
| [19] |
|
| [20] |
|
| [21] |
|
| [22] |
|
| [23] |
Qi H, Jiang Y, Yin Z, Jiang K, Li L, Shuai J 2018 Phys. Chem. Chem. Phys. 20 1964 DOI: 10.1039/C7CP06726G |
| [24] |
|
| [25] |
|
| [26] |
Li X, Zhong C Q, Yin Z, Qi H, Xu F, He Q, Shuai J 2020 Int. J. Mol. Sci. 21 3061 DOI: 10.3390/ijms21093061 |
| [27] |
|
| [28] |
|
| [29] |
|
| [30] |
|
| [31] |
Chen F, Chen C C, Riadi L, Ju L K 2004 Biotechnol. Prog. 20 1325 DOI: 10.1021/bp049928b |
| [32] |
Mcintosh M, Czuppon P, Best K, Becker A, Pfaffelhuber P 2013 Int. J. Biomath. Biostat. 2 59
|
| [33] |
Marenda M, Zanardo M, Trovato A, Seno F, Squartini A 2016 Sci. Rep. 6 39142 DOI: 10.1038/srep39142 |
| [34] |
James S, Nilsson P, James G, Kjelleberg S, Fagerström T 2000 J. Mol. Biol. 296 1127 DOI: 10.1006/jmbi.1999.3484 |
| [35] |
|
| [36] |
|
| [37] |
|
| [38] |
Gustafsson E, Nilsson P, Karlsson S, Arvidson S 2004 J. Mol. Microbiol. Biotechnol. 8 232 DOI: 10.1159/000086704 |
| [39] |
|
| [40] |
|
| [41] |
|
| [42] |
|
| [43] |
Teng S W, Schaffer J N, Tu K C, Mehta P, Lu W, Ong N P, Bassler B L, Wingreen N S 2011 Mol. Syst. Biol. 7 491 DOI: 10.1038/msb.2011.30 |
| [44] |
Teng S W, Wang Y, Tu K C, Long T, Mehta P, Wingreen N S, Bassler B L, Ong N P 2010 Biophys. J. 98 2024 DOI: 10.1016/j.bpj.2010.01.031 |
| [45] |
|
| [46] |
Nilsson P, Olofsson A, Fagerlind M, Fagerström T, Rice S, Kjelleberg S, Steinberg P 2001 J. Mol. Biol. 309 631 DOI: 10.1006/jmbi.2001.4697 |
| [47] |
|
| [48] |
|
| [49] |
Li J, Wang L, Hashimoto Y, Tsao C Y, Wood T K, Valdes J J, Zafiriou E, Bentley W E 2006 Mol. Syst. Biol. 2 67 DOI: 10.1038/msb4100107 |
| [50] |
|
| [51] |
|
| [52] |
|
| [53] |
|
| [54] |
|
| [55] |
|
| No Suggested Reading articles found! |
|
|
Viewed |
|
|
|
Full text
|
|
|
|
|
Abstract
|
|
|
|
|
Cited |
|
|
|
|
Altmetric
|
|
blogs
Facebook pages
Wikipedia page
Google+ users
|
Online attention
Altmetric calculates a score based on the online attention an article receives. Each coloured thread in the circle represents a different type of online attention. The number in the centre is the Altmetric score. Social media and mainstream news media are the main sources that calculate the score. Reference managers such as Mendeley are also tracked but do not contribute to the score. Older articles often score higher because they have had more time to get noticed. To account for this, Altmetric has included the context data for other articles of a similar age.
View more on Altmetrics
|
|
|