|
Special Issue:
SPECIAL TOPIC — Modeling and simulations for the structures and functions of proteins and nucleic acids
|
| SPECIAL TOPIC—Modeling and simulations for the structures and functions of proteins and nucleic acids |
Prev
Next
|
|
|
The theory of helix-based RNA folding kinetics and its application |
| Sha Gong(龚沙)1, Taigang Liu(刘太刚)2, Yanli Wang(王晏莉)2, and Wenbing Zhang(张文炳)2,† |
1 Hubei Key Laboratory of Economic Forest Germplasm Improvement and Resources Comprehensive Utilization, Hubei Collaborative Innovation Center for the Characteristic Resources Exploitation of Dabie Mountains, Huanggang Normal University, Huanggang 438000, China
2 Department of Physics, Wuhan University, Wuhan 430072, China |
|
|
|
|
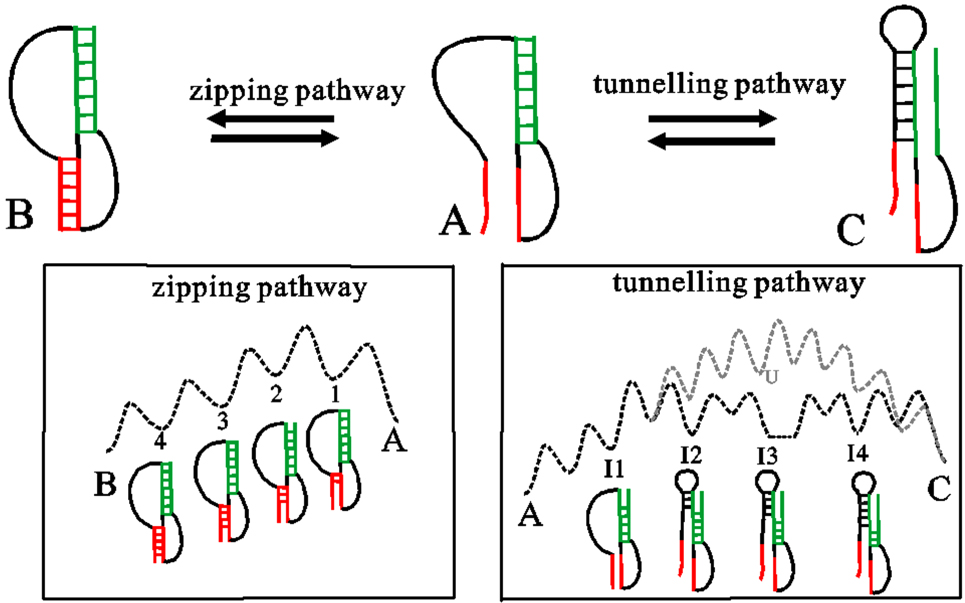
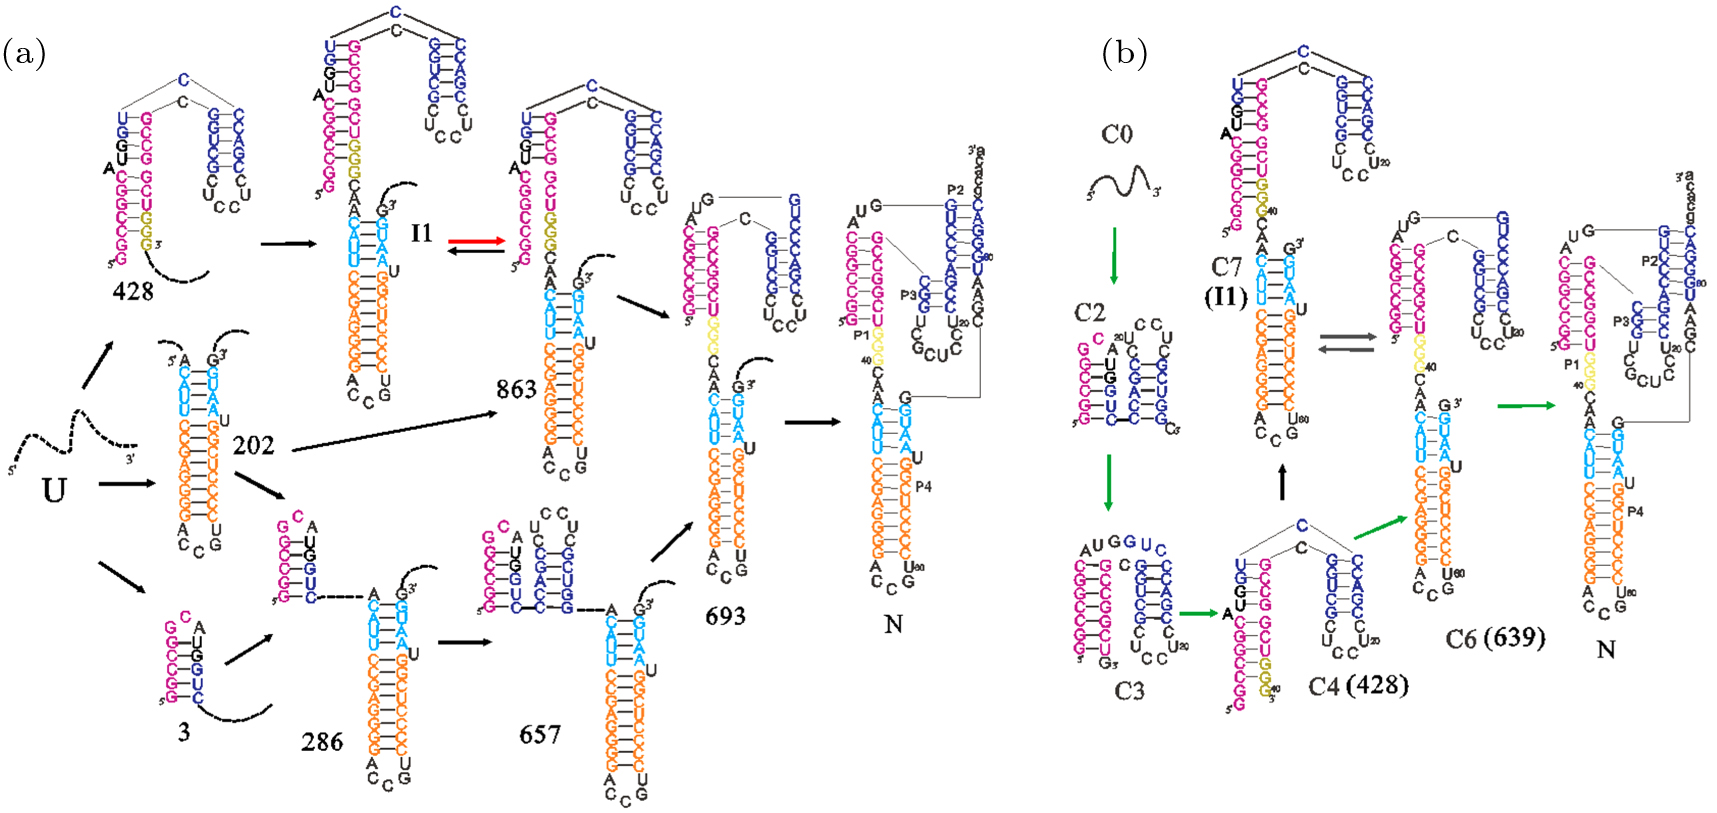
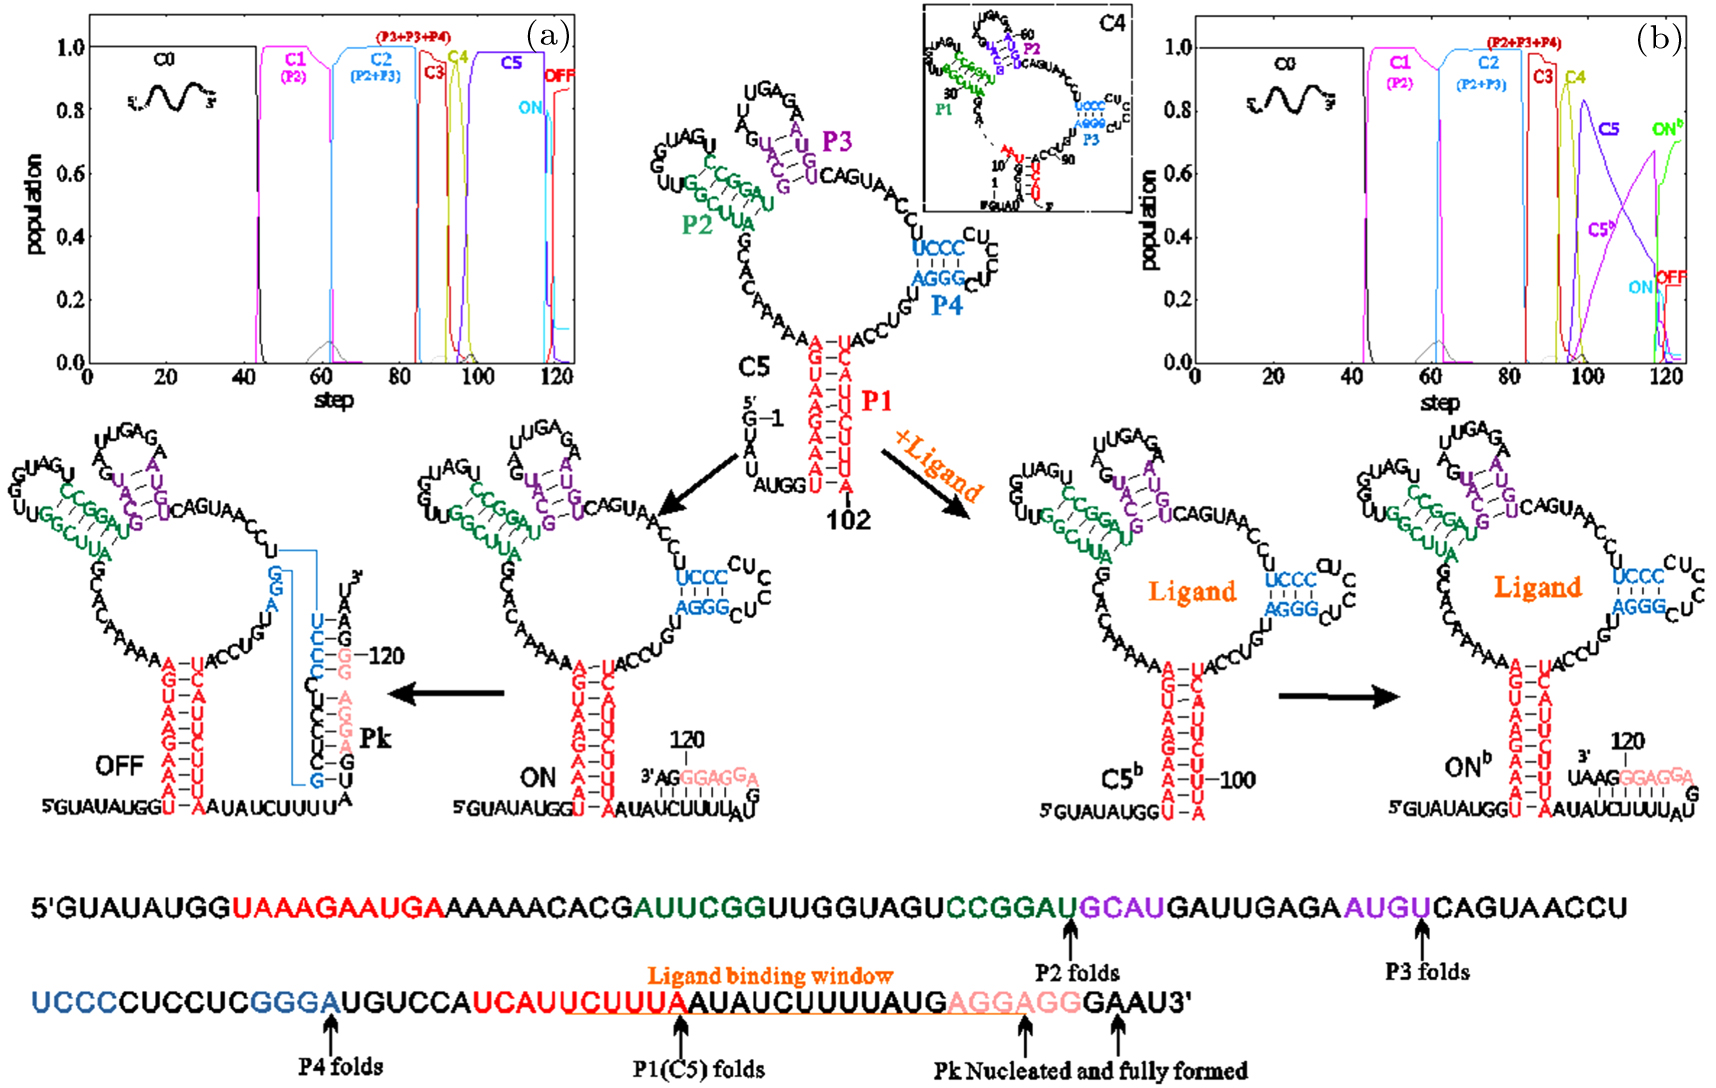
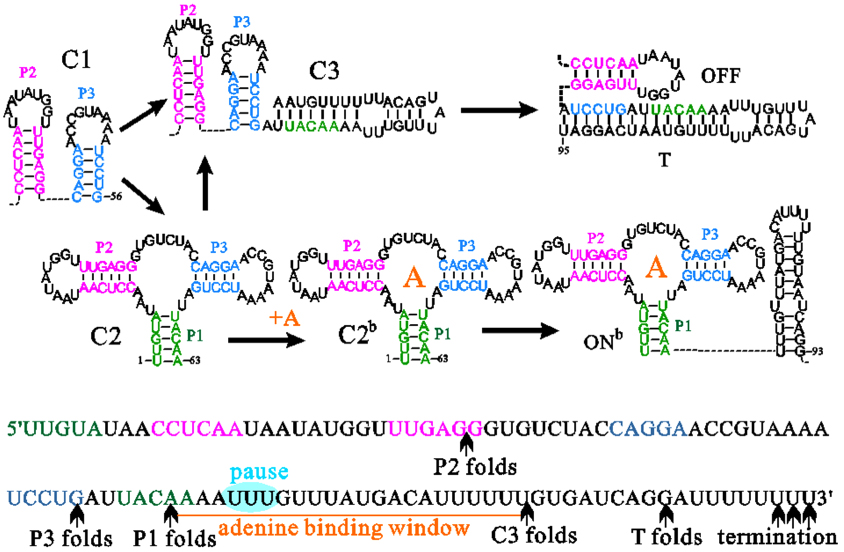
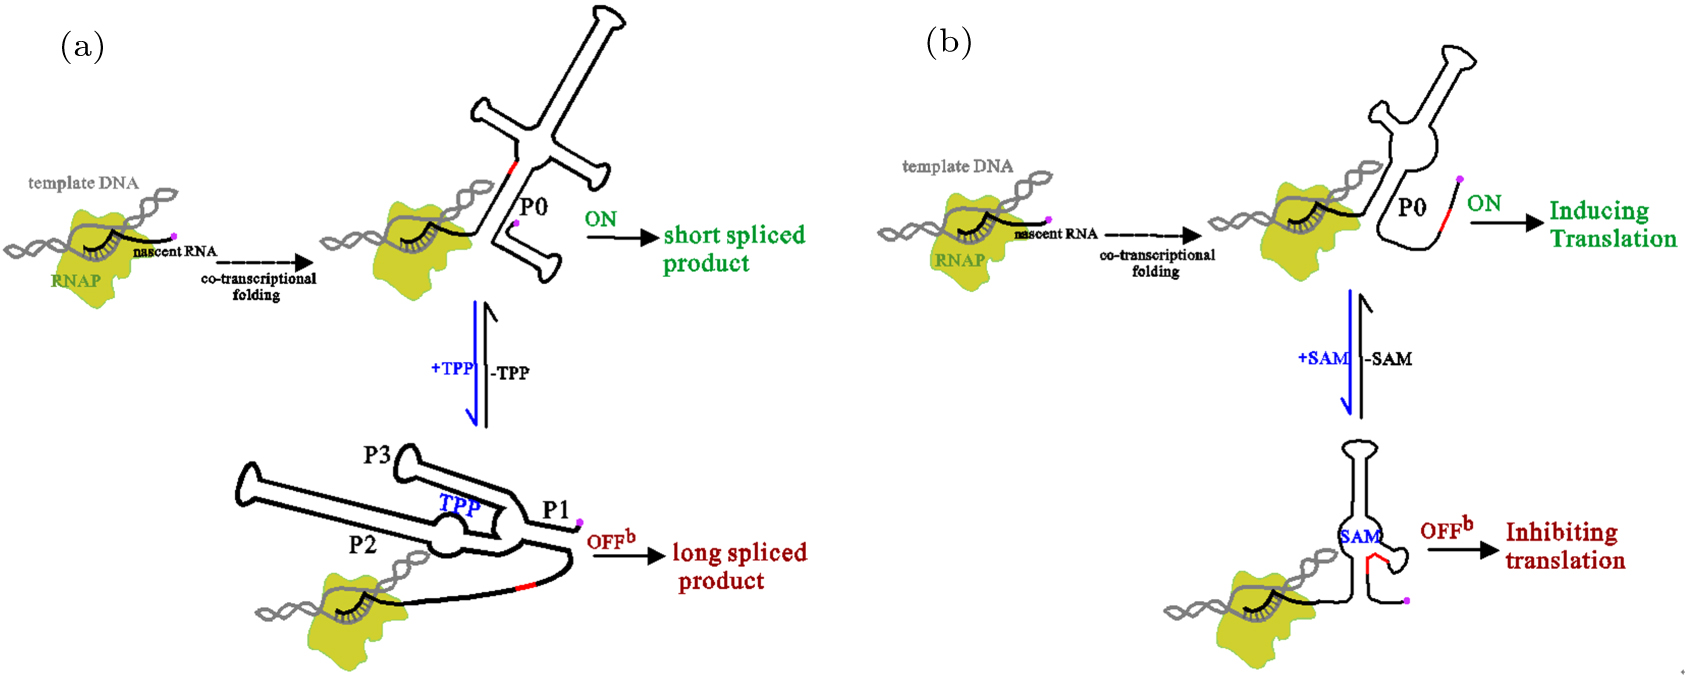
Abstract RNAs carry out diverse biological functions, partly because different conformations of the same RNA sequence can play different roles in cellular activities. To fully understand the biological functions of RNAs requires a conceptual framework to investigate the folding kinetics of RNA molecules, instead of native structures alone. Over the past several decades, many experimental and theoretical methods have been developed to address RNA folding. The helix-based RNA folding theory is the one which uses helices as building blocks, to calculate folding kinetics of secondary structures with pseudoknots of long RNA in two different folding scenarios. Here, we will briefly review the helix-based RNA folding theory and its application in exploring regulation mechanisms of several riboswitches and self-cleavage activities of the hepatitis delta virus (HDV) ribozyme.
|
Received: 29 June 2020
Revised: 30 July 2020
Accepted manuscript online: 01 August 2020
|
|
PACS:
|
87.14.gn
|
(RNA)
|
| |
87.15.bd
|
(Secondary structure)
|
| |
87.15.Cc
|
(Folding: thermodynamics, statistical mechanics, models, and pathways)
|
| |
87.18.Cf
|
(Genetic switches and networks)
|
|
|
Corresponding Authors:
†Corresponding author. E-mail: wbzhang@whu.edu.cn
|
| About author: †Corresponding author. E-mail: wbzhang@whu.edu.cn * Project supported by the Science Fund from the Key Laboratory of Hubei Province, China (Grant No. 201932003) and the National Natural Science Foundation of China (Grant Nos. 1157324 and 31600592). |
Cite this article:
Sha Gong(龚沙), Taigang Liu(刘太刚), Yanli Wang(王晏莉), and Wenbing Zhang(张文炳)† The theory of helix-based RNA folding kinetics and its application 2020 Chin. Phys. B 29 108703
|
| [1] |
|
| [2] |
Strulson C A, Molden R C, Keating C D, Bevilacqua P C 2012 Nat. Chem. 4 941 DOI: 10.1038/nchem.1466 |
| [3] |
|
| [4] |
Förster U, Weigand J E, Trojanowski P, Suess B, Wachtveitl J 2012 Nucleic Acids Res. 40 1807 DOI: 10.1093/nar/gkr835 |
| [5] |
|
| [6] |
|
| [7] |
Schluenzen F, Tocilj A, Zarivach R, Harms J, Gluehmann M, Janell D, Bashan A, Bartels H, Agmon I, Franceschi F, Yonath A 2000 Cell 102 615 DOI: 10.1016/S0092-8674(00)00084-2 |
| [8] |
|
| [9] |
Ahmad S, Muthukumar S, Kuncha S K, Routh S B, Yerabham A S K, Hussain T, Kamarthapu V, Kruparani S P, Sankaranarayanan R 2015 Nat. Commun. 6 1 DOI: 10.1038/ncomms8552 |
| [10] |
Zhong G, Wang H, He W, Li Y, Mou H, Tickner Z J, Tran M H, Ou T, Yin Y, Diao H, Farzan M 2020 Nat. Biotechnol. 38 169 DOI: 10.1038/s41587-019-0357-y |
| [11] |
Wimberly B T, Brodersen D E, Clemons W M, Morgan-Warren R J, Carter A P, Vonrhein C, Hartsch T, Ramakrishnan V 2000 Nature 407 327 DOI: 10.1038/35030006 |
| [12] |
|
| [13] |
Geis M, Flamm C, Wolfinger M T, Tanzer A, Hofacker I L, Middendorf M, Mandl C, Stadler P F, Thurner C 2008 J. Mol. Biol. 379 160 DOI: 10.1016/j.jmb.2008.02.064 |
| [14] |
|
| [15] |
|
| [16] |
|
| [17] |
|
| [18] |
|
| [19] |
|
| [20] |
|
| [21] |
DebRoy S, Gebbie M, Ramesh A, Goodson J R, Cruz M R, van Hoof A, Winkler W C, Garsin D A 2014 Science 345 937 DOI: 10.1126/science.1255091 |
| [22] |
Lemay J F, Desnoyers G, Blouin S, Heppell B, Bastet L, St-Pierre P, Massé E, Lafontaine D A 2011 PLoS Genet. 7 e1001278 DOI: 10.1371/journal.pgen.1001278 |
| [23] |
|
| [24] |
|
| [25] |
|
| [26] |
|
| [27] |
|
| [28] |
|
| [29] |
|
| [30] |
Pan T, Artsimovitch I, Fang X W, Landick R, Sosnick T R 1999 Proc. Natl. Acad. Sci. 96 9545 DOI: 10.1073/pnas.96.17.9545 |
| [31] |
|
| [32] |
|
| [33] |
|
| [34] |
Lutz B, Faber M, Verma A, Klumpp S, Schug A 2014 Nucleic Acids Res. 42 2687 DOI: 10.1093/nar/gkt1213 |
| [35] |
|
| [36] |
|
| [37] |
Danilova L V, Pervouchine D D, Favorov A V, Mironov A A 2006 J. Bioinform. Comput. Biol. 4 589 DOI: 10.1142/S0219720006001904 |
| [38] |
Hofacker I L, Flamm C, Heine C, Wolfinger M T, Scheuermann G, Stadler P F 2010 RNA 16 1308 DOI: 10.1261/rna.2093310 |
| [39] |
Xayaphoummine A, Bucher T, Thalmann F, Isambert H 2003 Proc. Natl. Acad. Sci. 100 15310 DOI: 10.1073/pnas.2536430100 |
| [40] |
Xayaphoummine A, Bucher T, Isambert H 2005 Nucleic Acids Res. 33 605 DOI: 10.1093/nar/gki166 |
| [41] |
|
| [42] |
|
| [43] |
|
| [44] |
|
| [45] |
|
| [46] |
Chen J W, Gong S, Wang Y J, Zhang W B 2014 J. Chem. Phys. 140 025102 DOI: 10.1063/1.4861037 |
| [47] |
|
| [48] |
|
| [49] |
|
| [50] |
|
| [51] |
|
| [52] |
Wang Y J, Gong S, Wang Z, Zhang W B 2016 J. Chem. Phys. 144 115101 DOI: 10.1063/1.4944067 |
| [53] |
|
| [54] |
Wang Y J, Wang Z, Wang Y L, Liu T G, Zhang W B 2018 J. Chem. Phys. 148 045101 DOI: 10.1063/1.5013282 |
| [55] |
|
| [56] |
|
| [57] |
Xia T, SantaLucia J, Burkard M E, Kierzek R, Schroeder S J, Jiao X, Cox C, Turner D H 1998 Biochemistry 37 14719 DOI: 10.1021/bi9809425 |
| [58] |
|
| [59] |
|
| [60] |
|
| [61] |
|
| [62] |
|
| [63] |
|
| [64] |
|
| [65] |
Chadalavada D M, Cerrone-Szakal A L, Bevilacqua P C 2007 RNA 13 2189 DOI: 10.1261/rna.778107 |
| [66] |
Delfosse V, Bouchard P, Bonneau E, Dagenais P, Centre-ville S 2010 Nucleic Acids Res. 38 2057 DOI: 10.1093/nar/gkp1080 |
| [67] |
Hennelly S P, Novikova I V, Sanbonmatsu K Y 2013 Nucleic Acids Res. 41 1922 DOI: 10.1093/nar/gks978 |
| [68] |
Perdrizet G A, Artsimovitch I, Furman R, Sosnick T R, Pan T 2012 Proc. Natl. Acad. Sci. USA 109 3323 DOI: 10.1073/pnas.1113086109 |
| [69] |
|
| [70] |
Feng J, Walter N G, Brooks C L 2011 J. Am. Chem. Soc. 133 4196 DOI: 10.1021/ja110411m |
| [71] |
|
| [72] |
Strobel B, Spöring M, Klein H, Blazevic D, Rust W, Sayols S, Hartig J S, Kreuz S 2020 Nat. Commun. 11 714 DOI: 10.1038/s41467-020-14491-x |
| [73] |
Weinberg Z, Wang J X, Bogue J, Yang J, Corbino K, Moy R H, Breaker R R 2010 Genome Biol. 11 R31 DOI: 10.1186/gb-2010-11-3-r31 |
| [74] |
|
| [75] |
|
| [76] |
|
| [77] |
Lin J C, Yoon J, Hyeon C, Thirumalai D 2015 Methods in Enzymology San Diego Elsevier Inc. 235 258 DOI: 10.1038/nrg2749 |
| [78] |
Reining A, Nozinovic S, Schlepckow K, Buhr F, Fürtig B, Schwalbe H 2013 Nature 499 355 DOI: 10.1038/nature12378 |
| [79] |
Wachter A, Tunc-Ozdemir M, Grove B C, Green P J, Shintani D K, Breaker R R 2007 Plant Cell 19 3437 DOI: 10.1105/tpc.107.053645 |
| [80] |
|
| [81] |
|
| [82] |
|
| [83] |
|
| [84] |
|
| [85] |
|
| [86] |
Ottink O M, Rampersad S M, Tessari M, Zaman G J R, Heus H A, Wijmenga S S 2007 RNA 13 2202 DOI: 10.1261/rna.635307 |
| [87] |
|
| [88] |
|
| [89] |
|
| No Suggested Reading articles found! |
|
|
Viewed |
|
|
|
Full text
|
|
|
|
|
Abstract
|
|
|
|
|
Cited |
|
|
|
|
Altmetric
|
|
blogs
Facebook pages
Wikipedia page
Google+ users
|
Online attention
Altmetric calculates a score based on the online attention an article receives. Each coloured thread in the circle represents a different type of online attention. The number in the centre is the Altmetric score. Social media and mainstream news media are the main sources that calculate the score. Reference managers such as Mendeley are also tracked but do not contribute to the score. Older articles often score higher because they have had more time to get noticed. To account for this, Altmetric has included the context data for other articles of a similar age.
View more on Altmetrics
|
|
|