| INTERDISCIPLINARY PHYSICS AND RELATED AREAS OF SCIENCE AND TECHNOLOGY |
Prev
Next
|
|
|
Modeling and analysis of the ocean dynamic with Gaussian complex network |
| Xin Sun(孙鑫)1, Yongbo Yu(于勇波)1, Yuting Yang(杨玉婷)1, Junyu Dong(董军宇)1,2,†, Christian B\"ohm3, and Xueen Chen(陈学恩)4 |
1 Department of Computer Science and Technology, Ocean University of China, Qingdao 266000, China
2 Frontiers Science Center for Deep Ocean Multispheres and Earth System, Qingdao 266000, China
3 Institut für Informatik, Ludwig Maximilian University of Munich, Munich 80331-81929, Germany
4 College of Physical and Environmental Oceanography, Ocean University of China, Qingdao 266000, China |
|
|
|
|
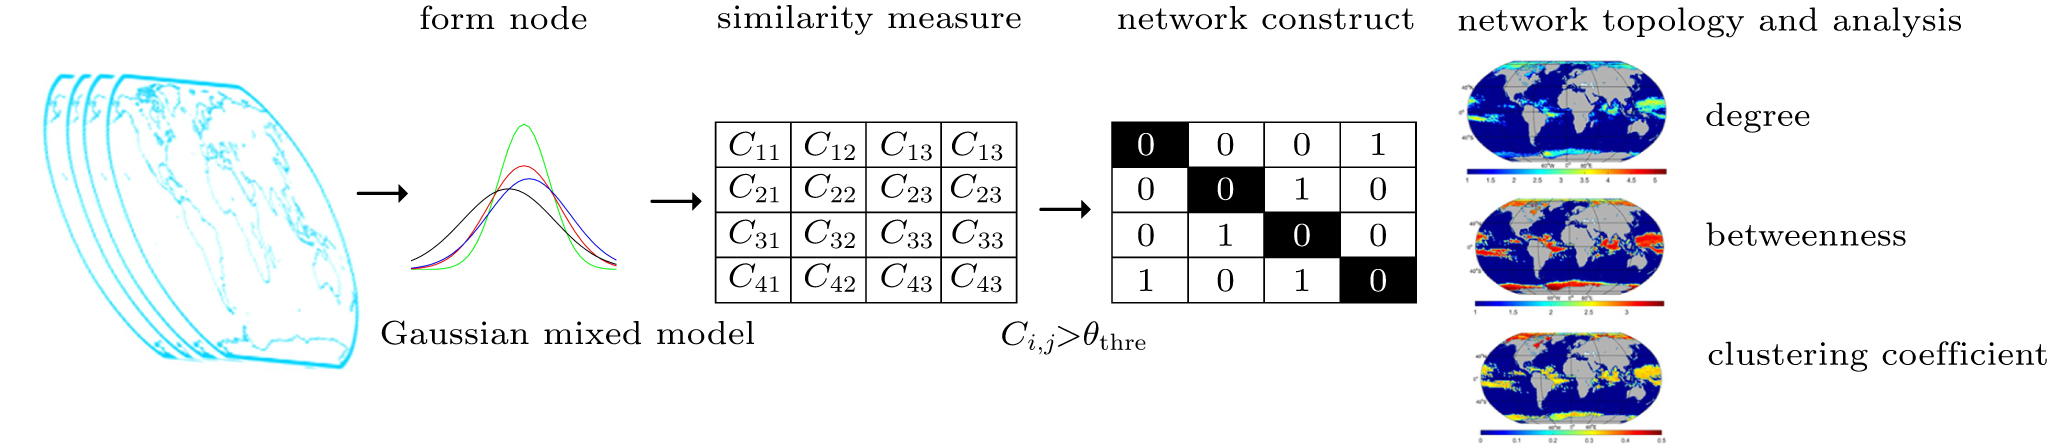
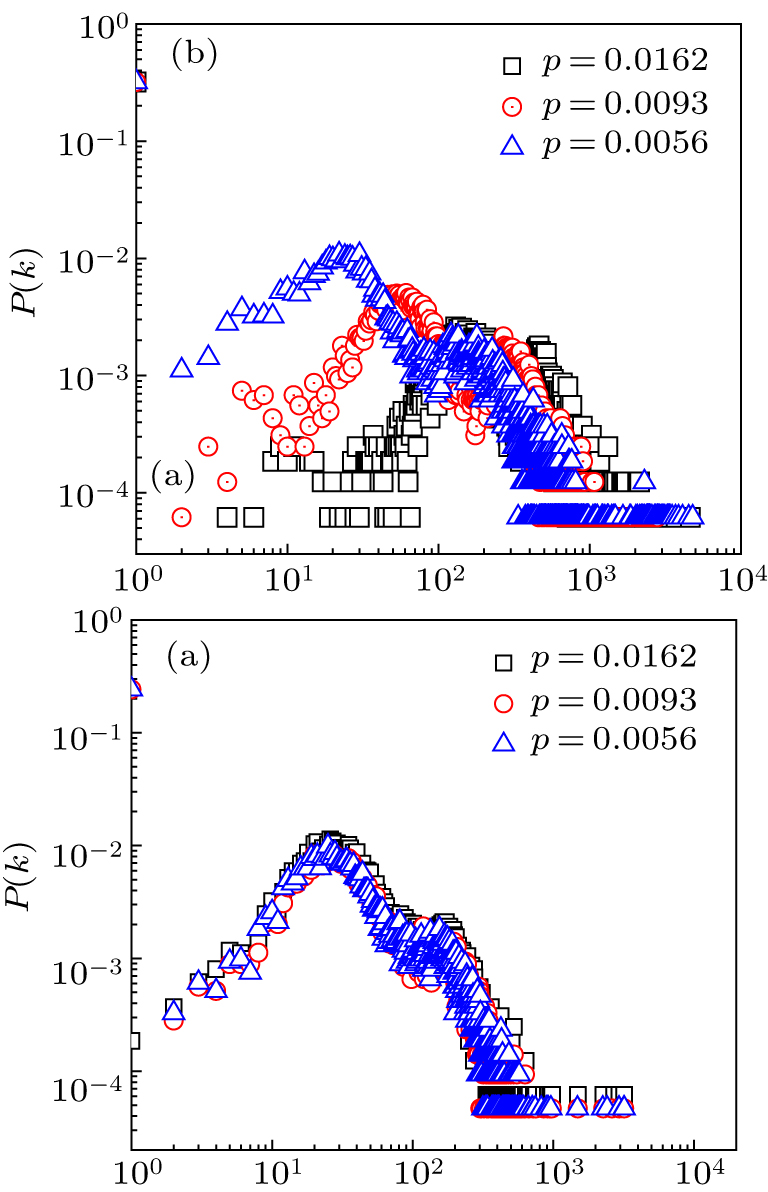
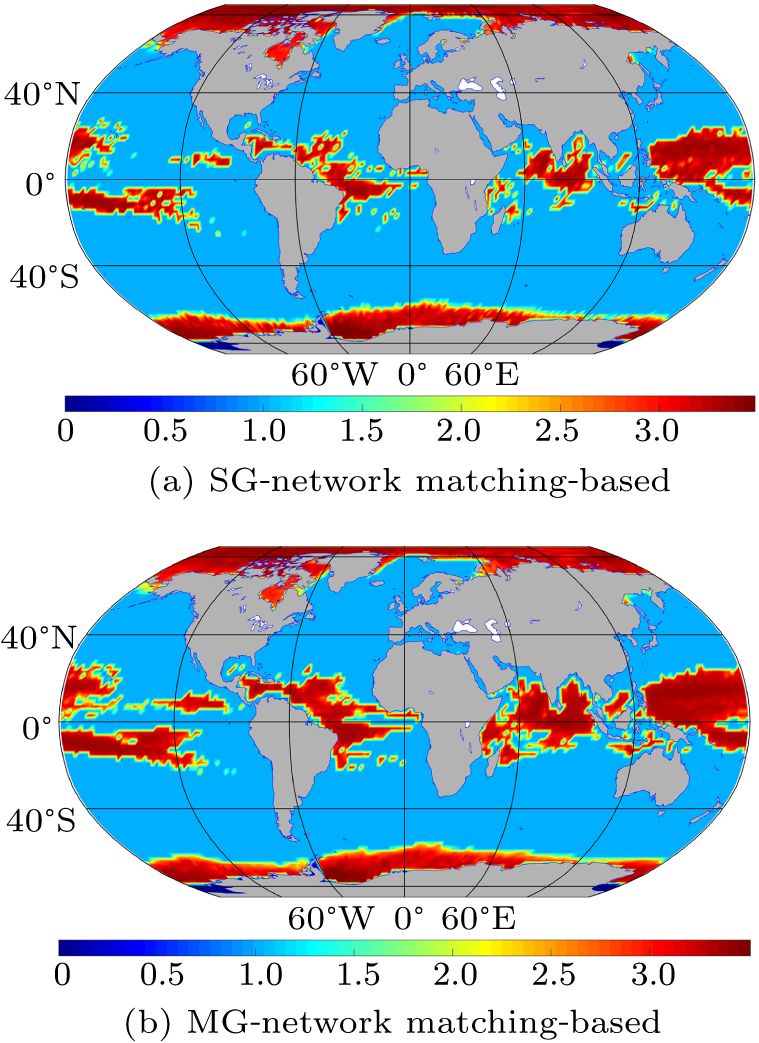
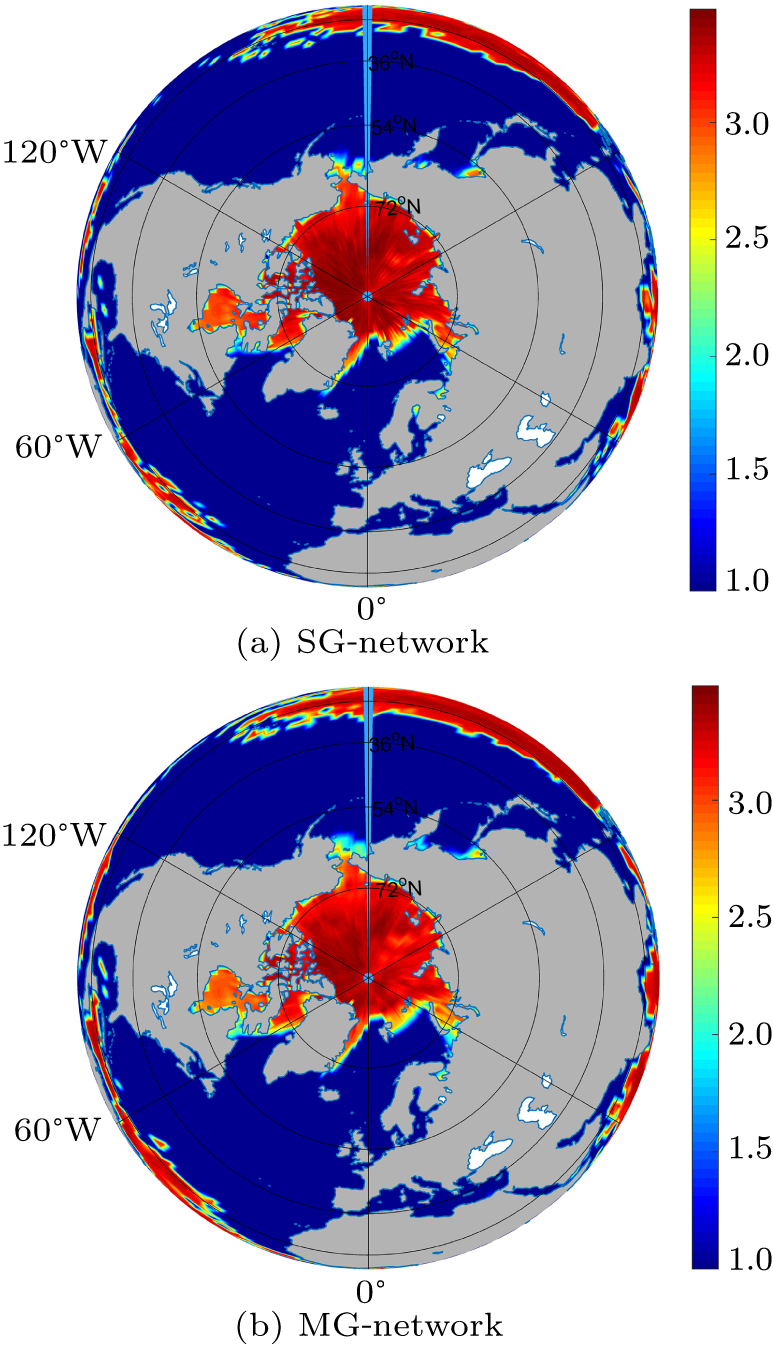
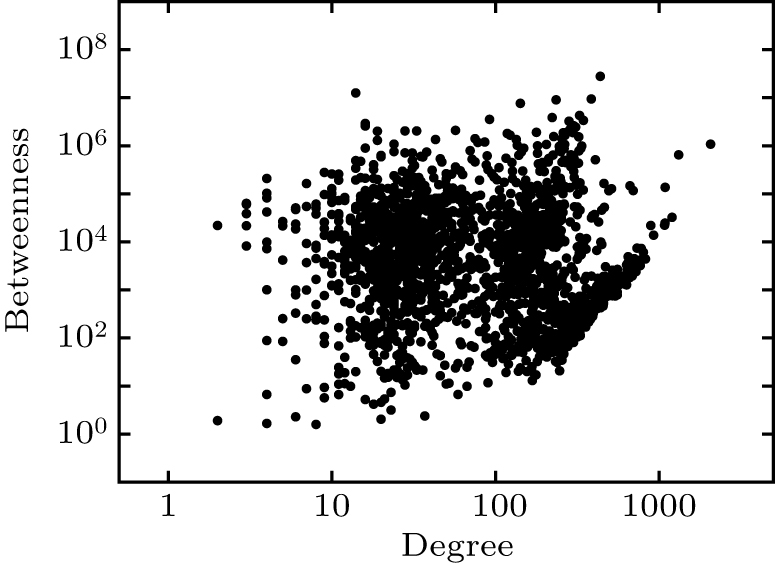
Abstract The techniques for oceanographic observation have made great progress in both space-time coverage and quality, which make the observation data present some characteristics of big data. We explore the essence of global ocean dynamic via constructing a complex network with regard to sea surface temperature. The global ocean is divided into discrete regions to represent the nodes of the network. To understand the ocean dynamic behavior, we introduce the Gaussian mixture models to describe the nodes as limit-cycle oscillators. The interacting dynamical oscillators form the complex network that simulates the ocean as a stochastic system. Gaussian probability matching is suggested to measure the behavior similarity of regions. Complex network statistical characteristics of the network are analyzed in terms of degree distribution, clustering coefficient and betweenness. Experimental results show a pronounced sensitivity of network characteristics to the climatic anomaly in the oceanic circulation. Particularly, the betweenness reveals the main pathways to transfer thermal energy of El Niño–Southern oscillation. Our works provide new insights into the physical processes of ocean dynamic, as well as climate changes and ocean anomalies.
|
Received: 17 April 2020
Revised: 19 June 2020
Accepted manuscript online: 03 July 2020
|
|
PACS:
|
89.75.Fb
|
(Structures and organization in complex systems)
|
| |
05.45.Tp
|
(Time series analysis)
|
| |
64.60.aq
|
(Networks)
|
|
|
Corresponding Authors:
†Corresponding author. E-mail: dongjunyu@ouc.edu.cn
|
| About author: †Corresponding author. E-mail: dongjunyu@ouc.edu.cn * Project supported by the National Natural Science Foundation of China (Grant Nos. U1706218, 61971388, and L1824025). |
Cite this article:
Xin Sun(孙鑫), Yongbo Yu(于勇波), Yuting Yang(杨玉婷), Junyu Dong(董军宇)†, Christian B\"ohm, and Xueen Chen(陈学恩) Modeling and analysis of the ocean dynamic with Gaussian complex network 2020 Chin. Phys. B 29 108901
|
| [1] |
|
| [2] |
|
| [3] |
Chave A D, Arrott M, Farcas C, Farcas E, Krueger I, Meisinger M, Orcutt J A, Vernon F L, Peach C, and S Oscar Oceans May 11–14, 2009 Bremen, Germany 1
|
| [4] |
|
| [5] |
Owens D, Best M, Guillemot E, Jenkyns R Oceans B 2010 May 24–27 2010 Sydney, Australia 1
|
| [6] |
|
| [7] |
Pradhan R, Aygun R S, Maskey M, Ramachandran R, Cecil D J 2017 IEEE Trans. Image Process. 27 692 DOI: 10.1109/TIP.2017.2766358 |
| [8] |
|
| [9] |
Wu Y, Shang Y, Chen M et al. 2008 IEEE Trans. Circuits Syst. 214 1335 DOI: 10.1063/1.2939136 |
| [10] |
Tominski C, Donges J F, Nocke T 2011 15th International Conference on Information Visualisation July 13–15, 2011 London, UK 298 305 DOI: 10.1109/IV.2011.12 |
| [11] |
|
| [12] |
|
| [13] |
Sun X, Song Z, Dong J, Yu Y, Plant C, Böhm C 2019 Thirty-Third AAAI Conference on Artificial Intelligence January 29–31, 2019 Hawaii, USA 5041 5048 DOI: 10.1609/aaai.v33i01.33015041 |
| [14] |
Steinhaeuser K, Chawla N V, Ganguly A R 2009 Proceedings of the Third International Workshop on Knowledge Discovery from Sensor Data June 28, 2009 Paris, France 23 31 DOI: 10.1145/1882471.1882476 |
| [15] |
|
| [16] |
Meng J, Fan J F, Ashkenazy Y, Havlin S 2017 Chaos: An Interdisciplinary J. Nonlinear Sci. 27 035807 DOI: 10.1063/1.4975766 |
| [17] |
|
| [18] |
Boers N, Bookhagen B, Marwan N, Kurths J, Marengo J 2013 Geophys. Res. Lett. 40 4386 DOI: 10.1002/grl.50681 |
| [19] |
Boers N, Bookhagen B, Barbosa H M J, Marwan N, Kurths J, Marengo J A 2014 Nat. Commun. 5 5199 DOI: 10.1038/ncomms6199 |
| [20] |
Josef L, Avi G, Mikhail I B, Armin B, Shlomo H, Hans J S 2014 Proc. Natl. Acad. Sci. USA 111 2064 DOI: 10.1073/pnas.1323058111 |
| [21] |
|
| [22] |
|
| [23] |
|
| [24] |
|
| [25] |
|
| [26] |
|
| [27] |
Ford J D, Tilleard S E, Lea B F, Araos M, Biesbroek R, Lesnikowski A C, MacDonald G K, Hsu A, Chen C, Bizikova L 2016 Proc. Natl. Acad. Sci. USA 113 10729 DOI: 10.1073/pnas.1614023113 |
| [28] |
|
| [29] |
Feng Q Y, Henk A D 2017 Chaos: An Interdisciplinary J. Nonlinear Sci. 27 035801 DOI: 10.1063/1.4971784 |
| [30] |
Wiedermann M, Radebach A, Donges J F, Kurths J, Donner R V 2016 Geophys. Res. Lett. 43 7176 DOI: 10.1002/2016GL069119 |
| [31] |
Tsonis A A, Swanson K L, Roebber P J 2006 Bull. Am. Meteorological Soc. 87 585 DOI: 10.1175/BAMS-87-5-585 |
| [32] |
Zerenner T, Friederichs P, Lehnertz K, Hense A 2014 Chaos: An Interdisciplinary J. Nonlinear Sci. 24 023103 DOI: 10.1063/1.4870402 |
| [33] |
|
| [34] |
|
| [35] |
Bohm C, Pryakhin A, Schubert M 2006 Proceedings of the 22nd International Conference on Data Engineering April 3–7, 2006 Atlanta, GA, USA 9 DOI: 10.1109/ICDE.2006.159 |
| [36] |
|
| [37] |
|
| [38] |
|
| [39] |
|
| No Suggested Reading articles found! |
|
|
Viewed |
|
|
|
Full text
|
|
|
|
|
Abstract
|
|
|
|
|
Cited |
|
|
|
|
Altmetric
|
|
blogs
Facebook pages
Wikipedia page
Google+ users
|
Online attention
Altmetric calculates a score based on the online attention an article receives. Each coloured thread in the circle represents a different type of online attention. The number in the centre is the Altmetric score. Social media and mainstream news media are the main sources that calculate the score. Reference managers such as Mendeley are also tracked but do not contribute to the score. Older articles often score higher because they have had more time to get noticed. To account for this, Altmetric has included the context data for other articles of a similar age.
View more on Altmetrics
|
|
|