| ELECTROMAGNETISM, OPTICS, ACOUSTICS, HEAT TRANSFER, CLASSICAL MECHANICS, AND FLUID DYNAMICS |
Prev
Next
|
|
|
Multi-scale elastoplastic mechanical model and microstructure damage analysis of solid expandable tubular |
| Hui-Juan Guo(郭慧娟)1,2, Ying-Hua Liu(刘应华)1, Yi-Nao Su(苏义脑)2, Quan-Li Zhang(张全立)2, and Guo-Dong Zhan(詹国栋)3,† |
1 Department of Engineering Mechanics, AML, Tsinghua University, Beijing 100084, China
2 Drilling Mechanical Department, CNPC Engineering Technology R & D Company Limited, Beijing 102206, China
3 Drilling Technology Division, EXPEC Advanced Research Center, Saudi Arabia |
|
|
|
|
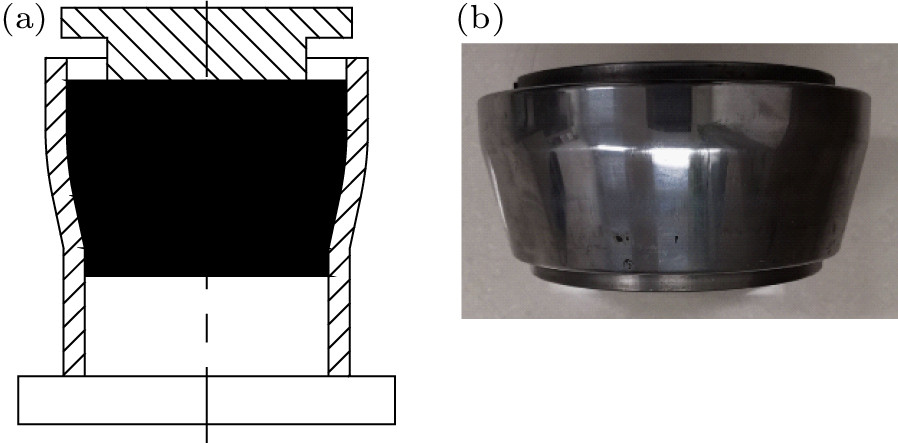
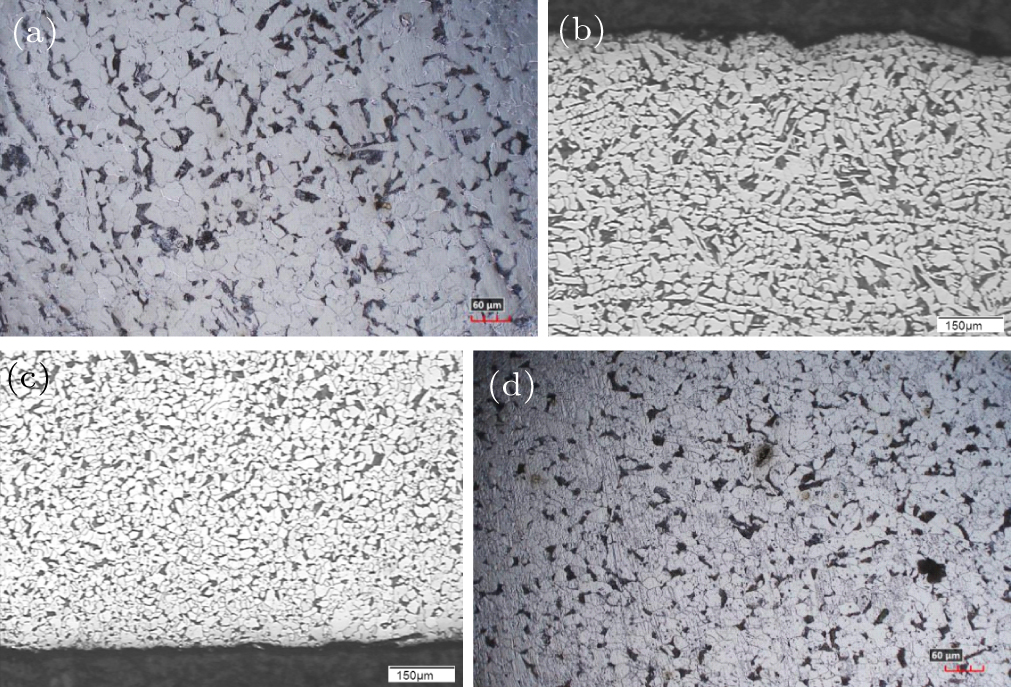
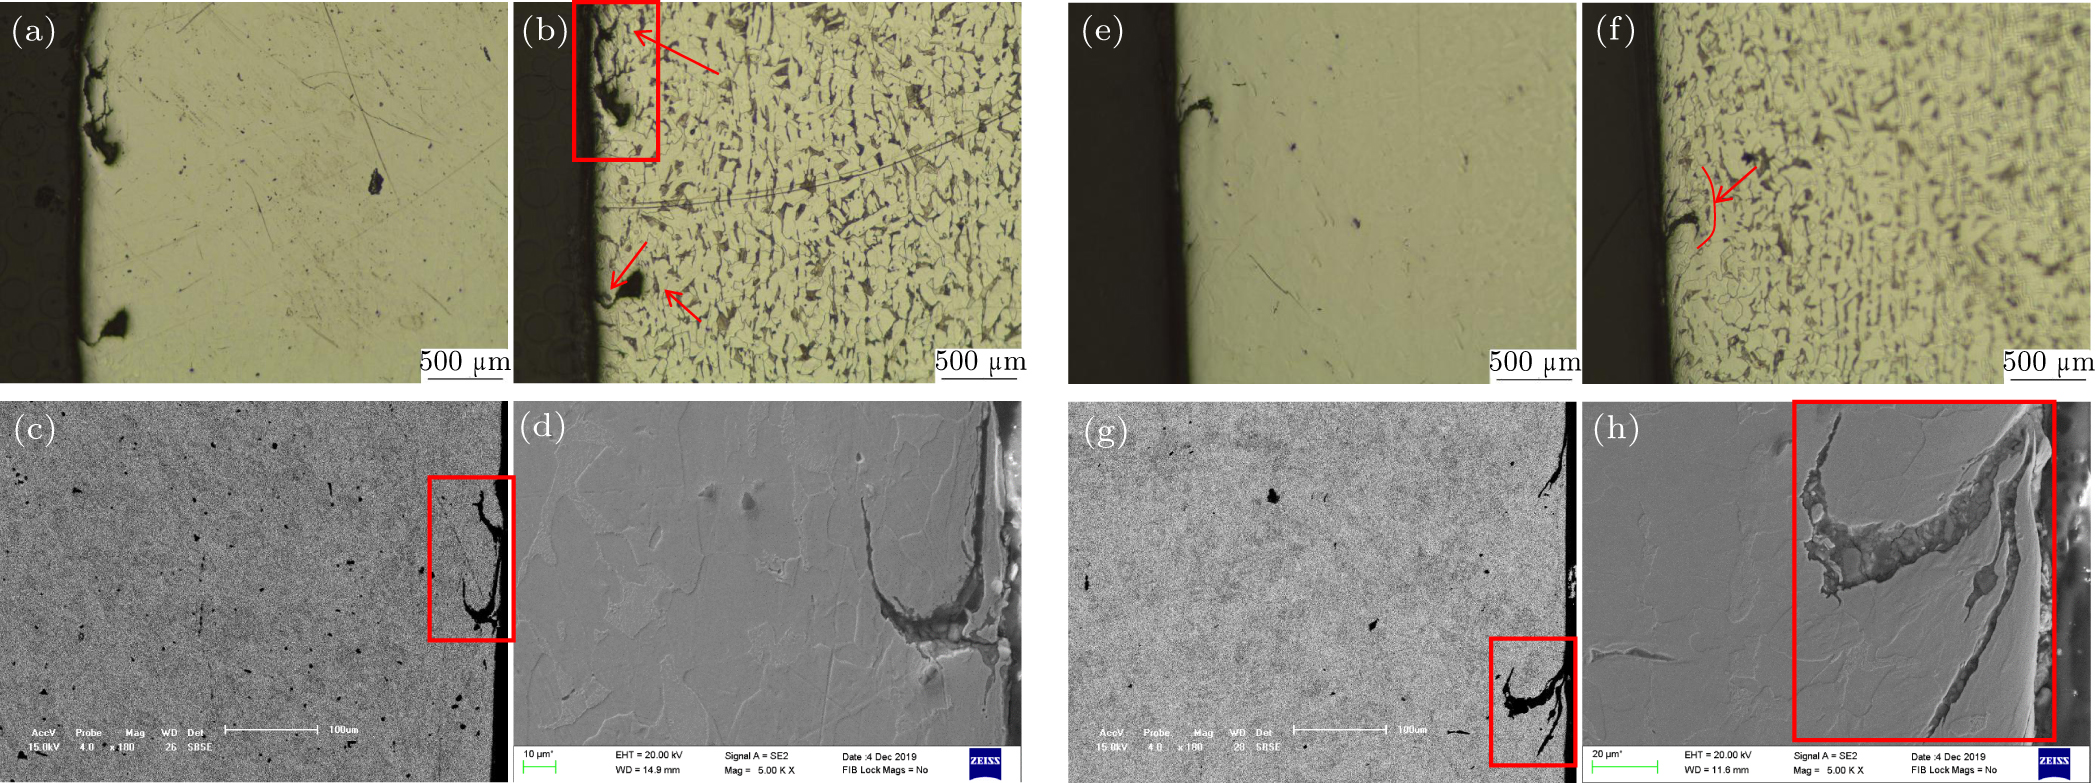
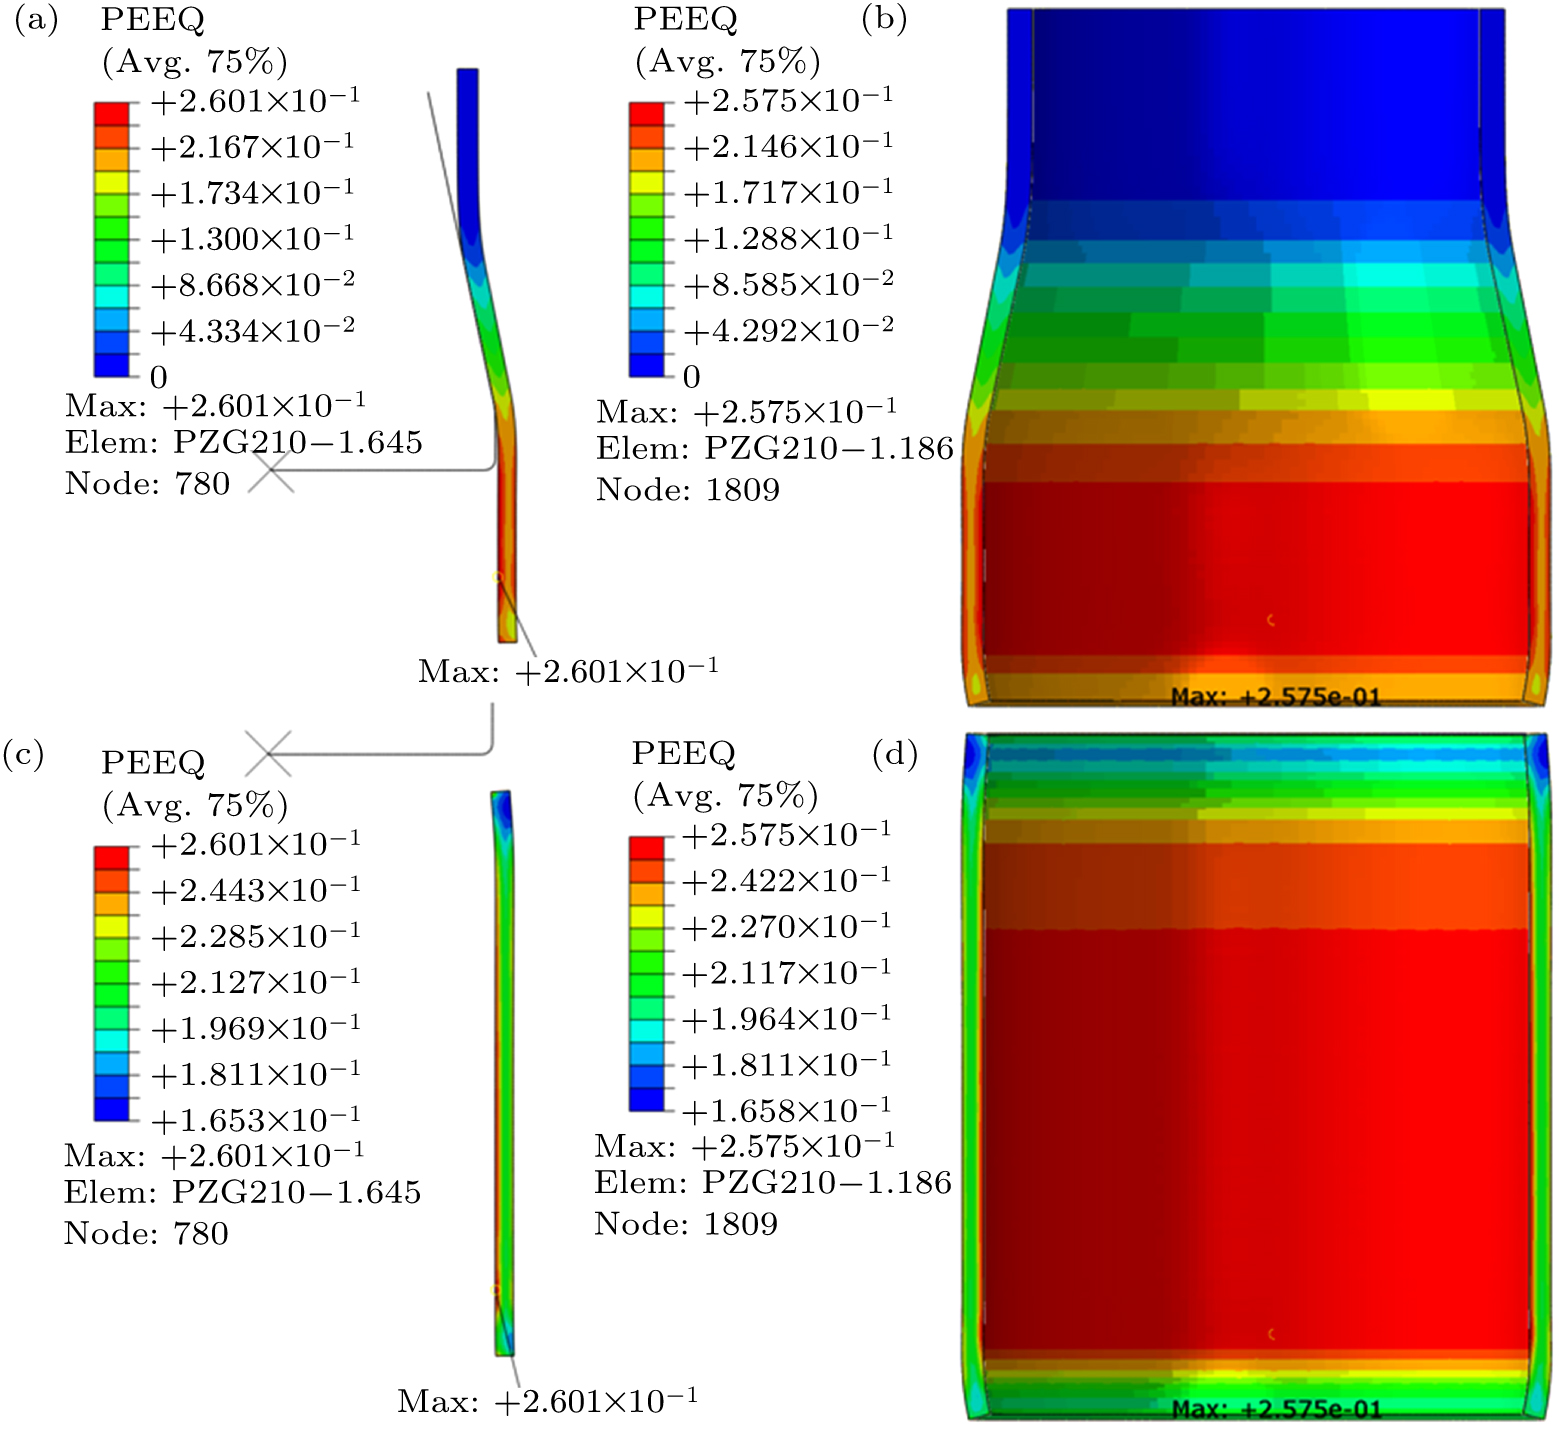
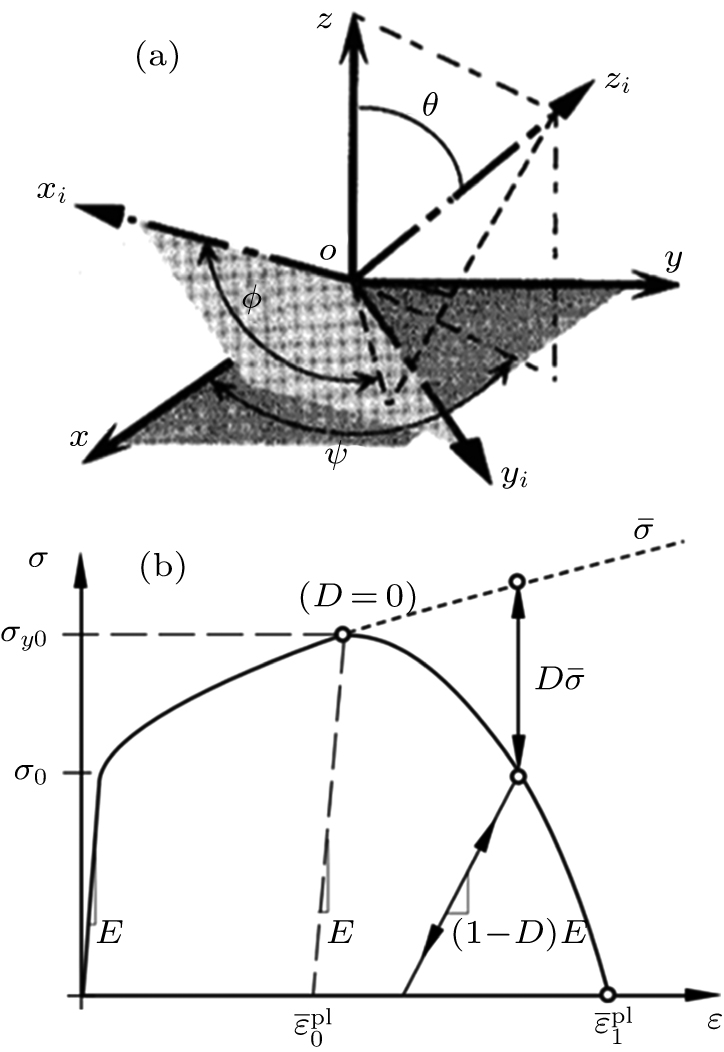
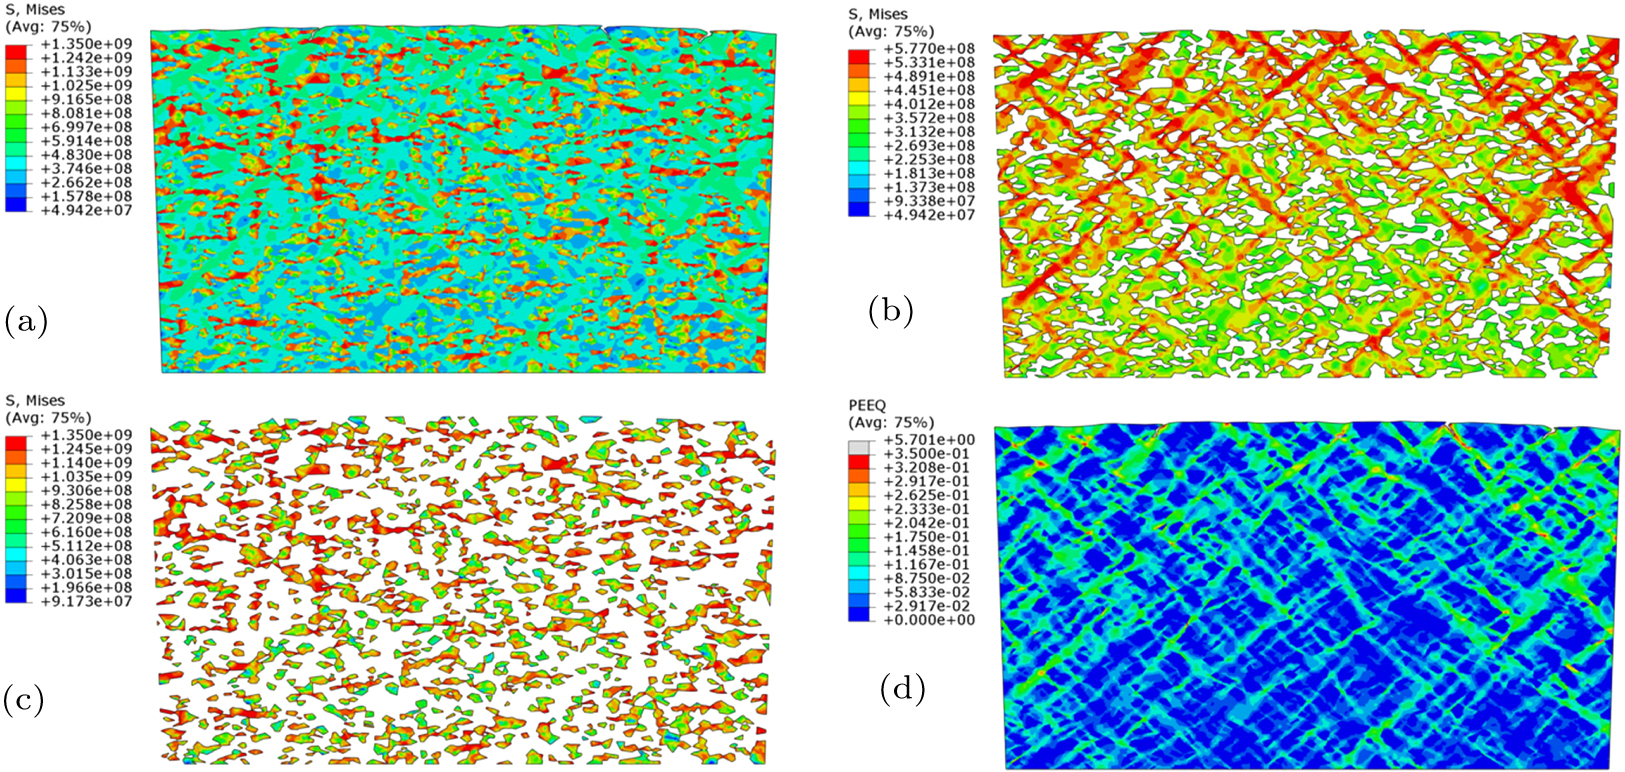
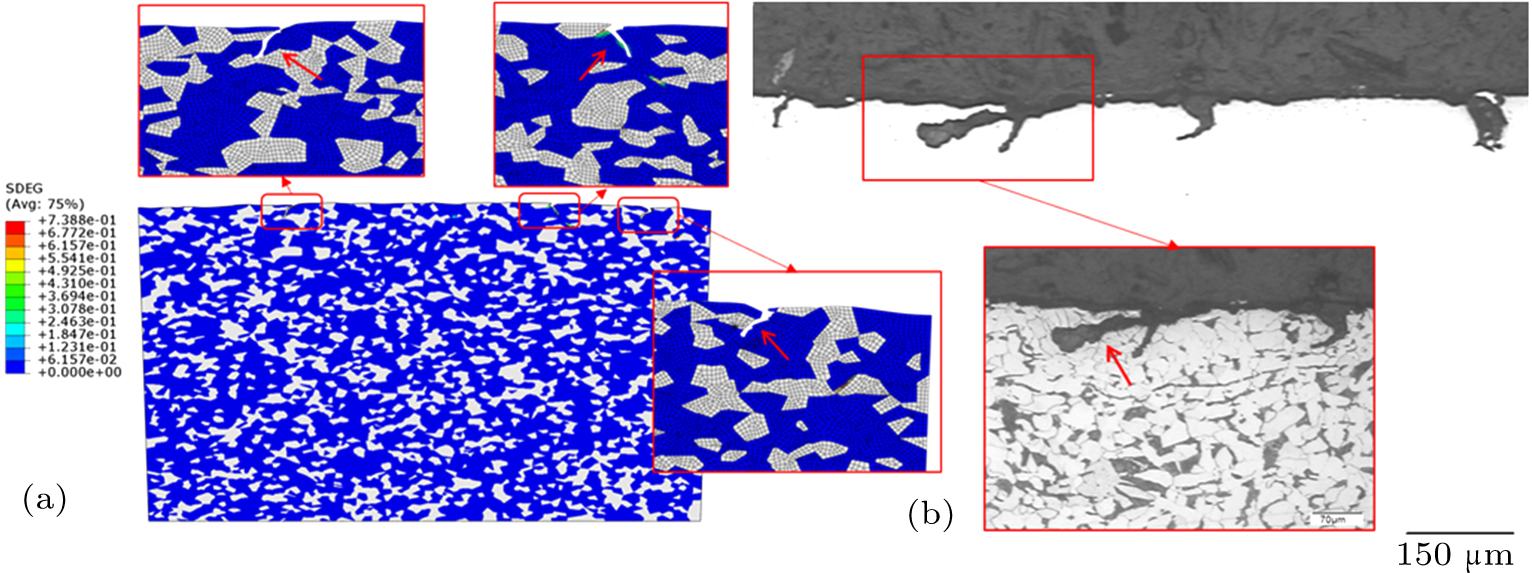
Abstract We present an in-depth study of the failure phenomenon of solid expandable tubular (SET) due to large expansion ratio in open holes of deep and ultra-deep wells. By examining the post-expansion SET, lots of microcracks are found on the inner surface of SET. Their morphology and parameters such as length and depth are investigated by use of metallographic microscope and scanning electron microscope (SEM). In addition, the Voronoi cell technique is adopted to characterize the multi-phase material microstructure of the SET. By using the anisotropic elastoplastic material constitutive model and macro/microscopic multi-dimensional cross-scale coupled boundary conditions, a sophisticated and multi-scale finite element model (FEM) of the SET is built successfully to simulate the material microstructure damage for different expansion ratios. The microcrack initiation and growth is simulated, and the structural integrity of the SET is discussed. It is concluded that this multi-scale finite element modeling method could effectively predict the elastoplastic deformation and the microscopic damage initiation and evolution of the SET. It is of great significance as a theoretical analysis tool to optimize the selection of appropriate tubular materials and it could be also used to substantially reduce costly failures of expandable tubulars in the field. This numerical analysis is not only beneficial for understanding the damage process of tubular materials but also effectively guides the engineering application of the SET technology.
|
Received: 27 March 2020
Revised: 10 May 2020
Accepted manuscript online: 01 August 2020
|
|
PACS:
|
46.50.+a
|
(Fracture mechanics, fatigue and cracks)
|
| |
81.40.Np
|
(Fatigue, corrosion fatigue, embrittlement, cracking, fracture, and failure)
|
| |
89.30.aj
|
(Oil, petroleum)
|
| |
91.60.Ed
|
(Crystal structure and defects, microstructure)
|
|
|
Corresponding Authors:
†Corresponding author. E-mail: guodong.zhan@aramco.com
|
| About author: †Corresponding author. E-mail: guodong.zhan@aramco.com * Project supported by the National Major Science & Technology Project of China (Grant No. 2016ZX05020-003). |
Cite this article:
Hui-Juan Guo(郭慧娟), Ying-Hua Liu(刘应华), Yi-Nao Su(苏义脑), Quan-Li Zhang(张全立), and Guo-Dong Zhan(詹国栋)† Multi-scale elastoplastic mechanical model and microstructure damage analysis of solid expandable tubular 2020 Chin. Phys. B 29 104602
|
| [1] |
Cales G L 2003 The development and applications of solid expandable tubular technology, Canadian International Petroleum Conference 10–12 June, 2003 Calgary, Alberta, Canada 136 DOI: 10.2118/2003-136 |
| [2] |
|
| [3] |
|
| [4] |
Zhang J, Zhao H 2015 Oil and Gas Well Expansion Tube Technology Beijing Petroleum Industry Press 47 in Chinese
|
| [5] |
Wei F, Bi Z Y, Li Y Z, Tang J, Wang T, Su W 2014 Steel Pipe 43 34 in Chinese
|
| [6] |
Shen W Z 2013 Study and development of the new expandable tubular ferrite/martensite dual phase steels Ph. D. Dissertation Chengdu Southwest Petroleum University in Chinese
|
| [7] |
Pervez T 2010 J. Achiev. Mater. Manuf. Eng. 41 147
|
| [8] |
|
| [9] |
|
| [10] |
|
| [11] |
|
| [12] |
Seibi A C, Al-Hiddabi S, Pervez T 2005 J. Energy Resour. Technol. 127 323 DOI: 10.1115/1.1926309 |
| [13] |
|
| [14] |
|
| [15] |
|
| [16] |
|
| [17] |
|
| [18] |
|
| [19] |
|
| [20] |
|
| [21] |
|
| [22] |
|
| [23] |
Peng H, Pei X Y, Li P, He H L, Bai J S 2015 Acta Phys. Sin. 64 216201 in Chinese DOI: 10.7498/aps.64.216201 |
| [24] |
|
| [25] |
|
| [26] |
|
| [27] |
|
| [28] |
|
| [29] |
|
| [30] |
|
| No Suggested Reading articles found! |
|
|
Viewed |
|
|
|
Full text
|
|
|
|
|
Abstract
|
|
|
|
|
Cited |
|
|
|
|
Altmetric
|
|
blogs
Facebook pages
Wikipedia page
Google+ users
|
Online attention
Altmetric calculates a score based on the online attention an article receives. Each coloured thread in the circle represents a different type of online attention. The number in the centre is the Altmetric score. Social media and mainstream news media are the main sources that calculate the score. Reference managers such as Mendeley are also tracked but do not contribute to the score. Older articles often score higher because they have had more time to get noticed. To account for this, Altmetric has included the context data for other articles of a similar age.
View more on Altmetrics
|
|
|