|
|
|
Quantized vortices in spinor Bose–Einstein condensates with time–space modulated interactions and stability analysis |
| Yu-Qin Yao(姚玉芹)1,† and Ji Li(李吉)2 |
1 Department of Applied Mathematics, China Agricultural University, Beijing 102206, China
2 Department of Physics, Taiyuan Normal University, Taiyuan 030031, China |
|
|
|
|
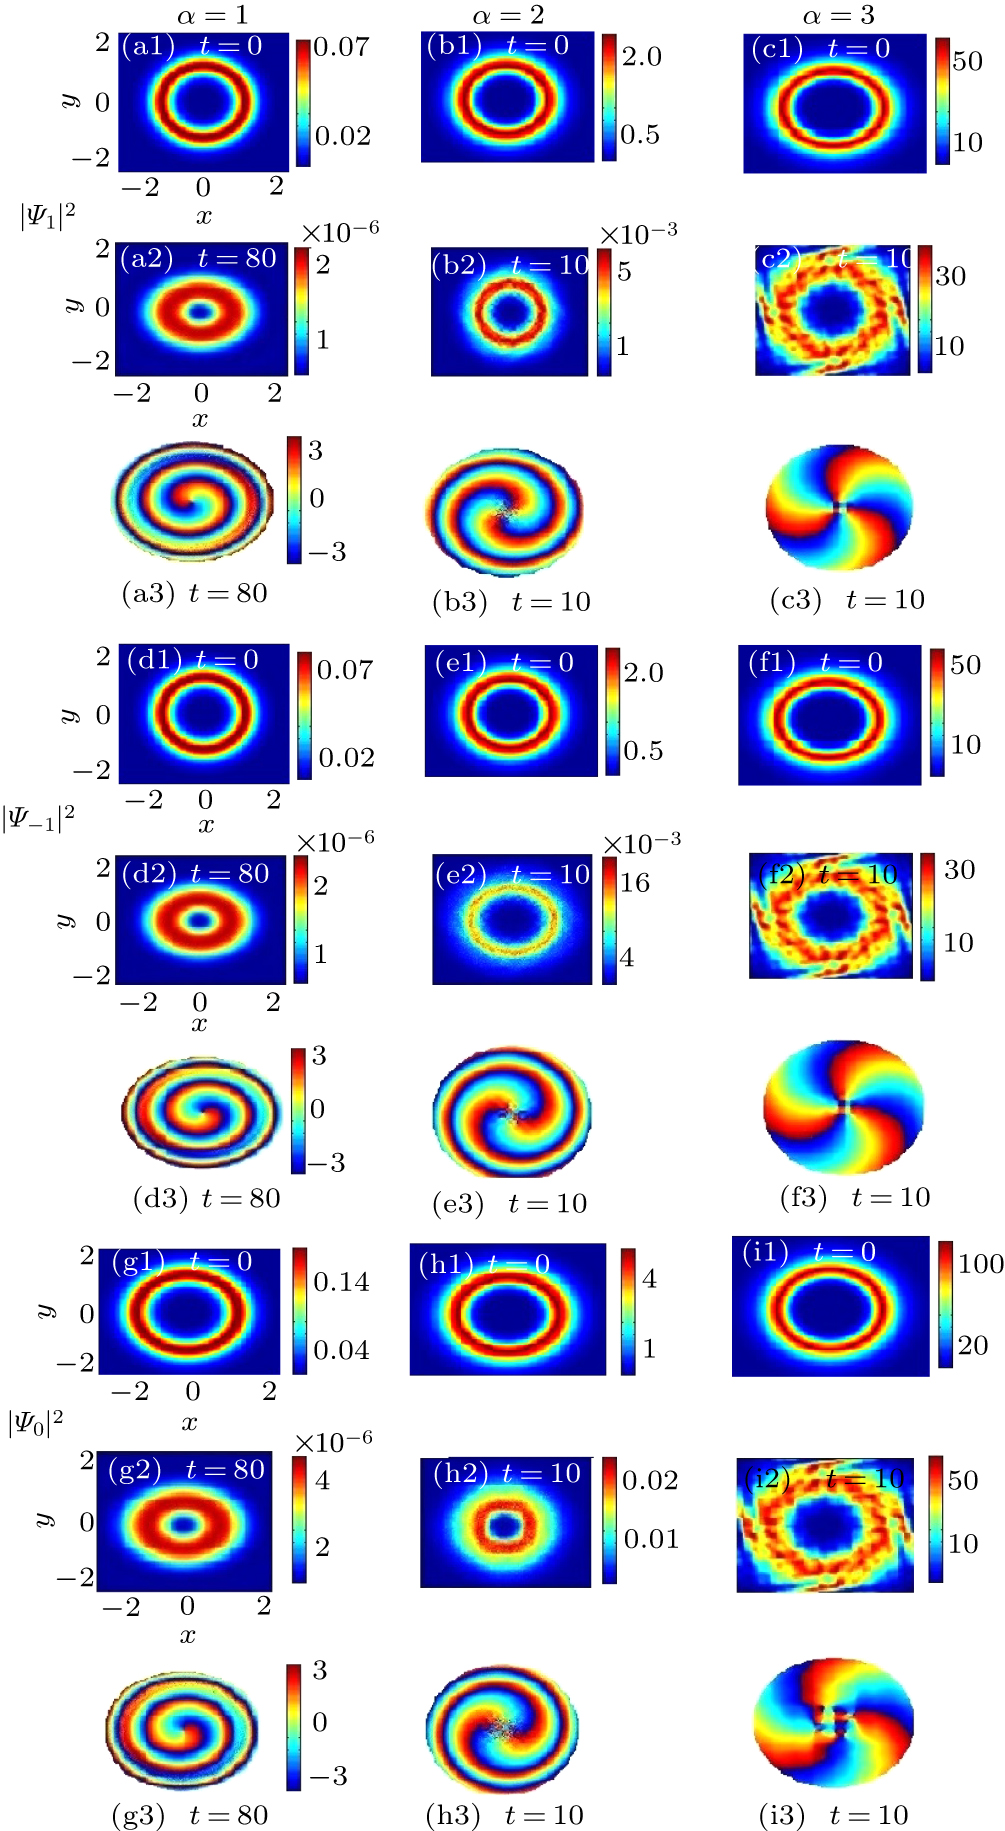
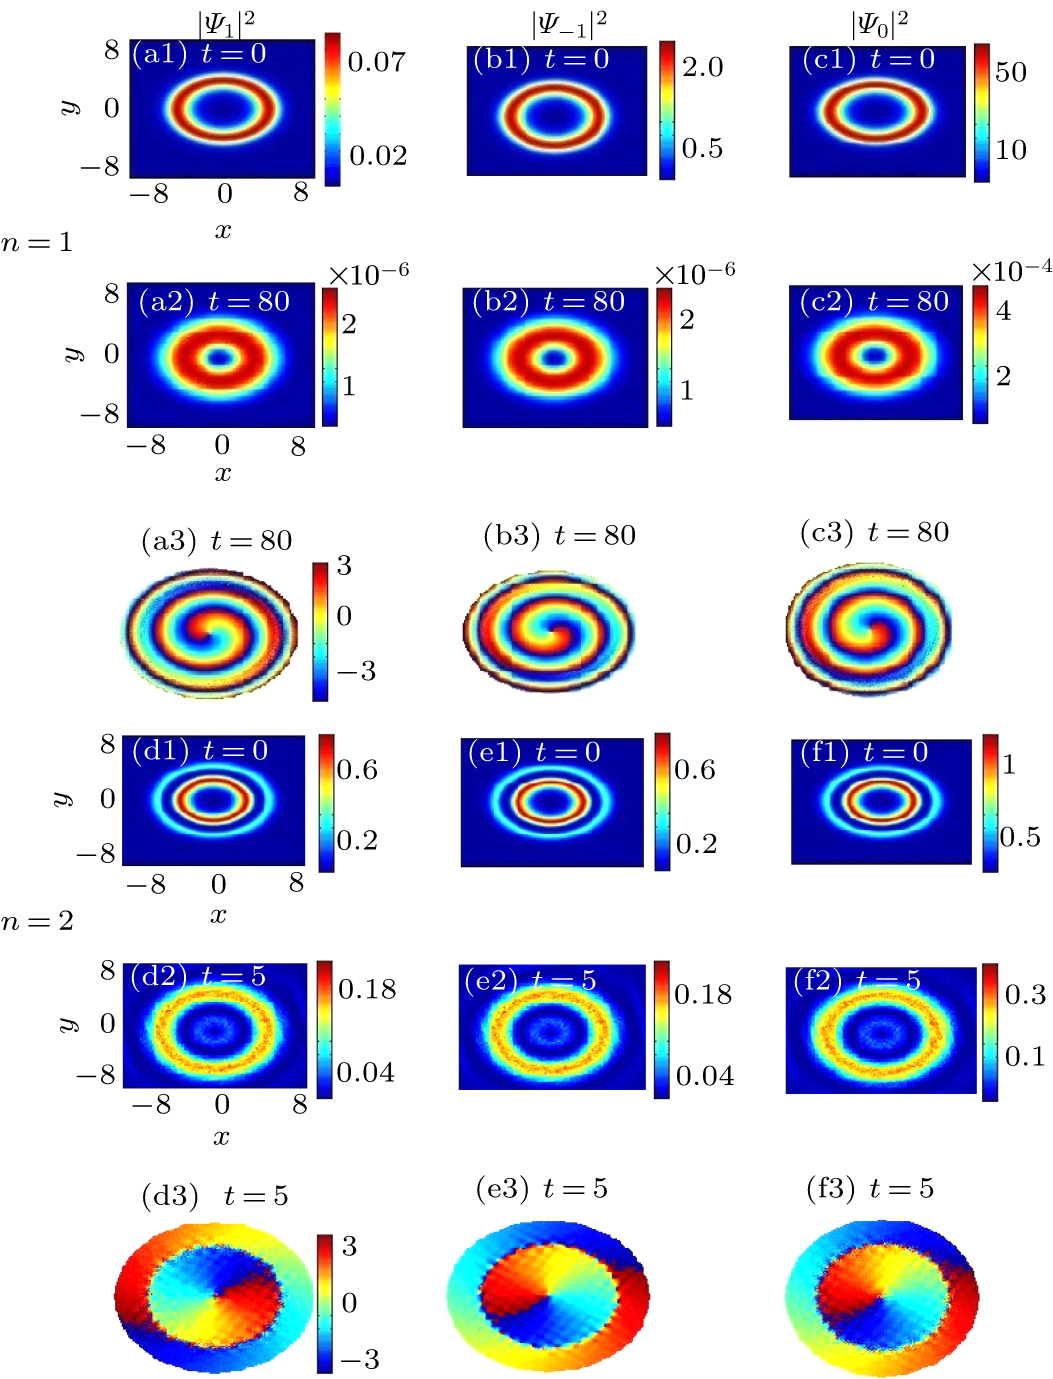
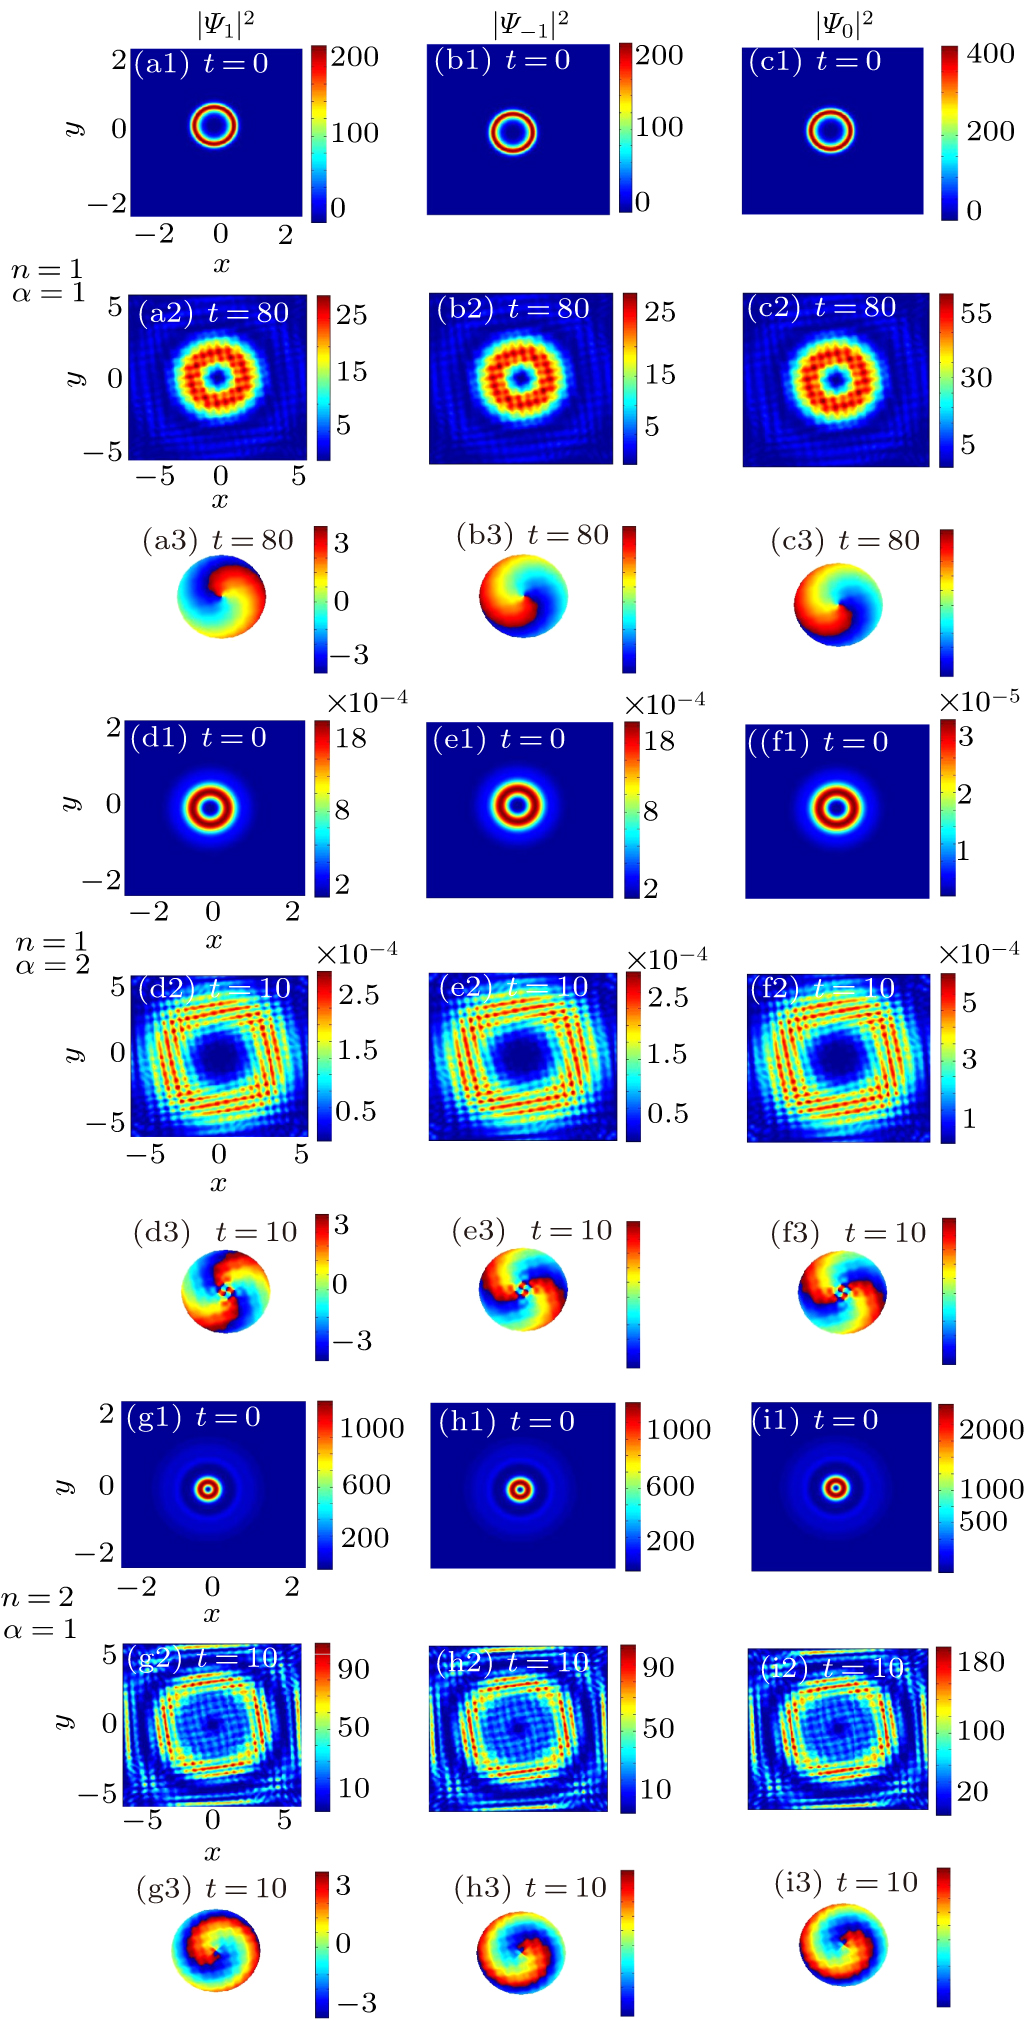
Abstract The three-component Gross–Pitaevskii equation with an angular momentum rotational term can be served as a model to study spinor Bose–Einstein condensates (BECs) with time–space modulated interactions. Vortex solutions of the spinor BECs with spatiotemporally modulated interactions are worked out by similarity transformation. Theoretical analysis and numerical simulation of vortex states are demonstrated. Stable vortex states are obtained by adjusting the frequency of the external potential and the spatiotemporally modulated interaction.
|
Received: 12 May 2020
Revised: 19 June 2020
Accepted manuscript online: 29 June 2020
|
|
PACS:
|
37.25.+k
|
(Atom interferometry techniques)
|
| |
03.75.Dg
|
(Atom and neutron interferometry)
|
|
|
Corresponding Authors:
†Corresponding author. E-mail: yyqinw@126.com
|
| About author: †Corresponding author. E-mail: yyqinw@126.com * Project supported by the Beijing Natural Science Foundation, China (Grand No. 1182009) and the National Natural Science Foundation of China (Grant No. 11471182). |
Cite this article:
Yu-Qin Yao(姚玉芹)† and Ji Li(李吉) Quantized vortices in spinor Bose–Einstein condensates with time–space modulated interactions and stability analysis 2020 Chin. Phys. B 29 103701
|
| [1] |
|
| [2] |
|
| [3] |
|
| [4] |
|
| [5] |
|
| [6] |
|
| [7] |
|
| [8] |
|
| [9] |
|
| [10] |
Ueda M 2014 Reports on Progress in Physics 77 2014
|
| [11] |
|
| [12] |
|
| [13] |
|
| [14] |
|
| [15] |
|
| [16] |
|
| [17] |
|
| [18] |
|
| [19] |
|
| [20] |
|
| [21] |
|
| [22] |
|
| [23] |
|
| [24] |
Yao Y Q, Li J, Han W, Liu W M 2016 Sci. Rep. 89 78
|
| [25] |
|
| [26] |
|
| [27] |
|
| [28] |
|
| [29] |
|
| [30] |
|
| [31] |
|
| No Suggested Reading articles found! |
|
|
Viewed |
|
|
|
Full text
|
|
|
|
|
Abstract
|
|
|
|
|
Cited |
|
|
|
|
Altmetric
|
|
blogs
Facebook pages
Wikipedia page
Google+ users
|
Online attention
Altmetric calculates a score based on the online attention an article receives. Each coloured thread in the circle represents a different type of online attention. The number in the centre is the Altmetric score. Social media and mainstream news media are the main sources that calculate the score. Reference managers such as Mendeley are also tracked but do not contribute to the score. Older articles often score higher because they have had more time to get noticed. To account for this, Altmetric has included the context data for other articles of a similar age.
View more on Altmetrics
|
|
|