| ELECTROMAGNETISM, OPTICS, ACOUSTICS, HEAT TRANSFER, CLASSICAL MECHANICS, AND FLUID DYNAMICS |
Prev
Next
|
|
|
Symmetry-controlled edge states in graphene-like topological sonic crystal |
| Zhang-Zhao Yang(杨彰昭)1, Jin-Heng Chen(陈晋恒)1, Yao-Yin Peng(彭尧吟)1, and Xin-Ye Zou(邹欣晔)1,2,† |
1 Key Laboratory of Modern Acoustics (MOE), Institute of Acoustics, Department of Physics, Collaborative Innovation Center of Advanced Microstructures, Nanjing University, Nanjing 210093, China
2 State Key Laboratory of Acoustics, Institute of Acoustics, Chinese Academy of Sciences, Beijing 100190, China |
|
|
|
|
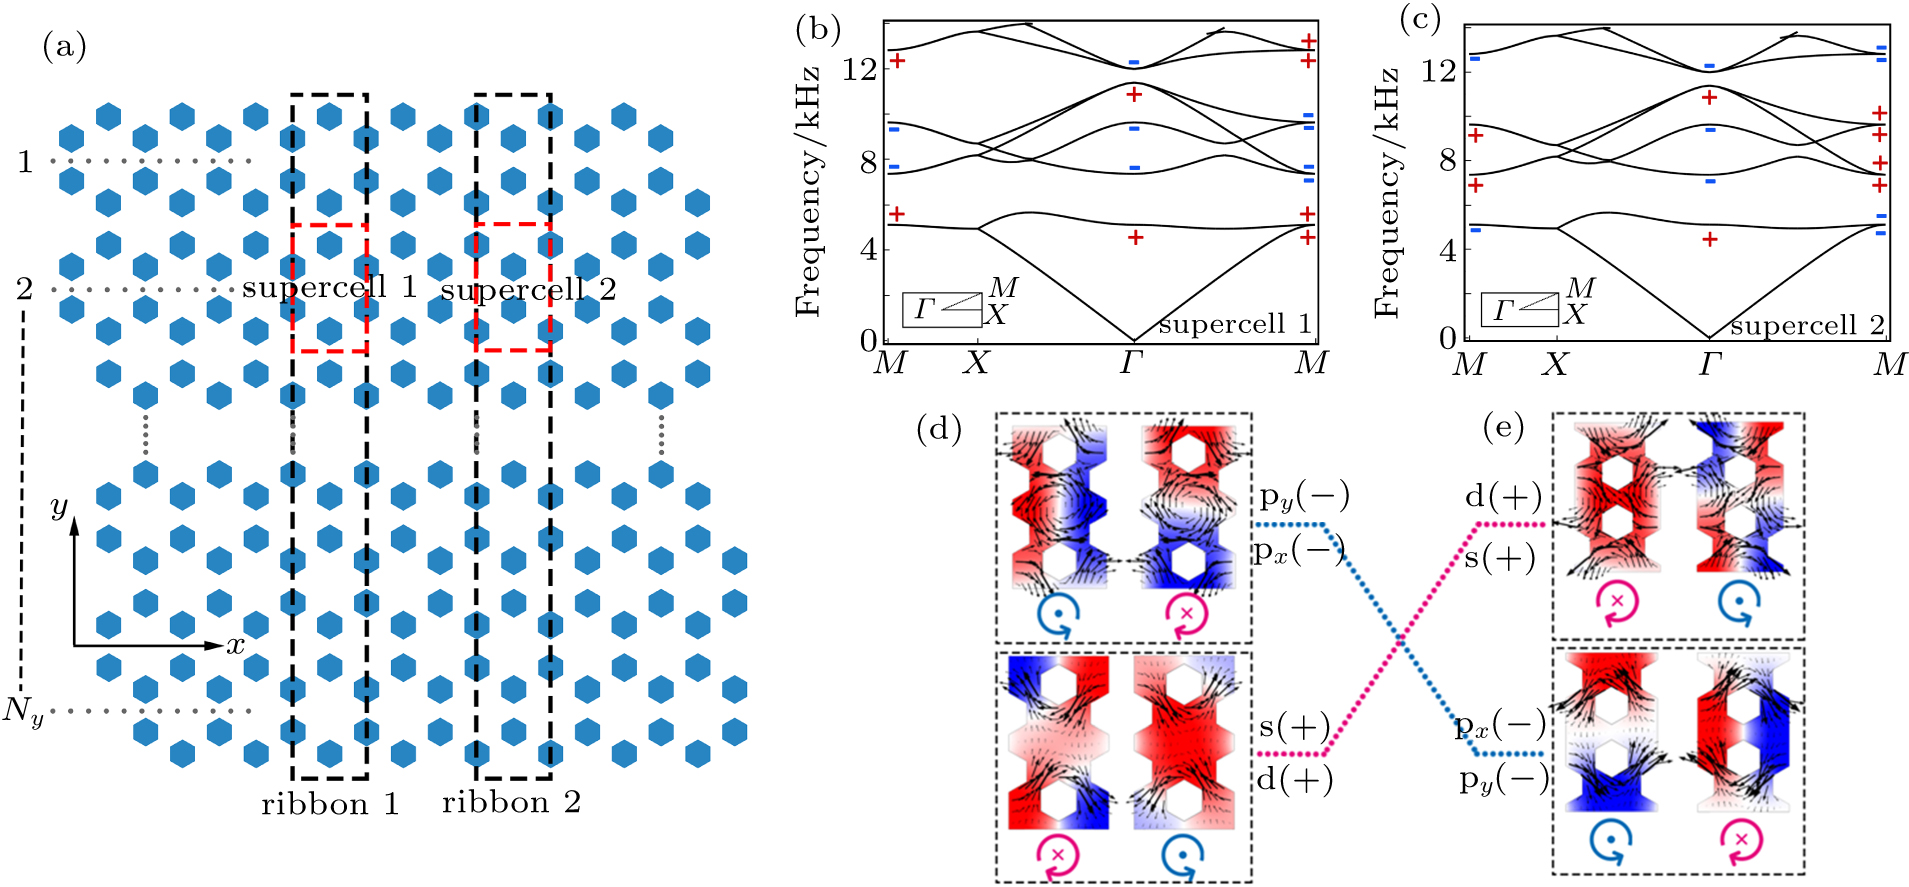
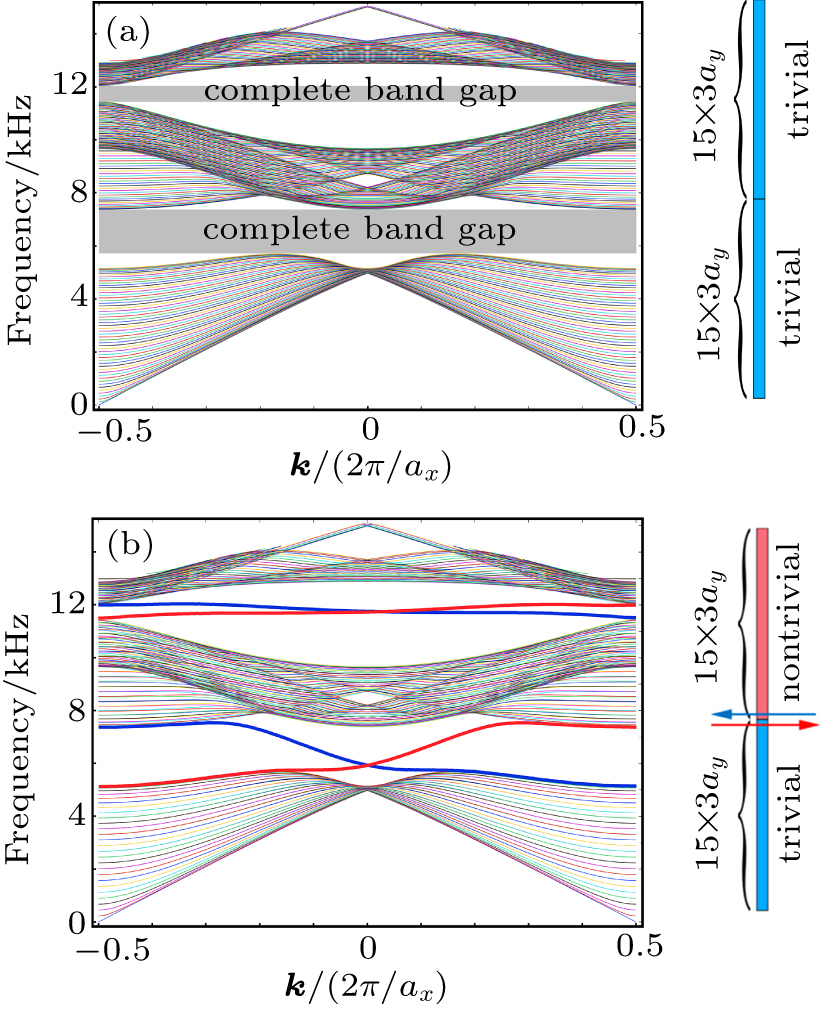
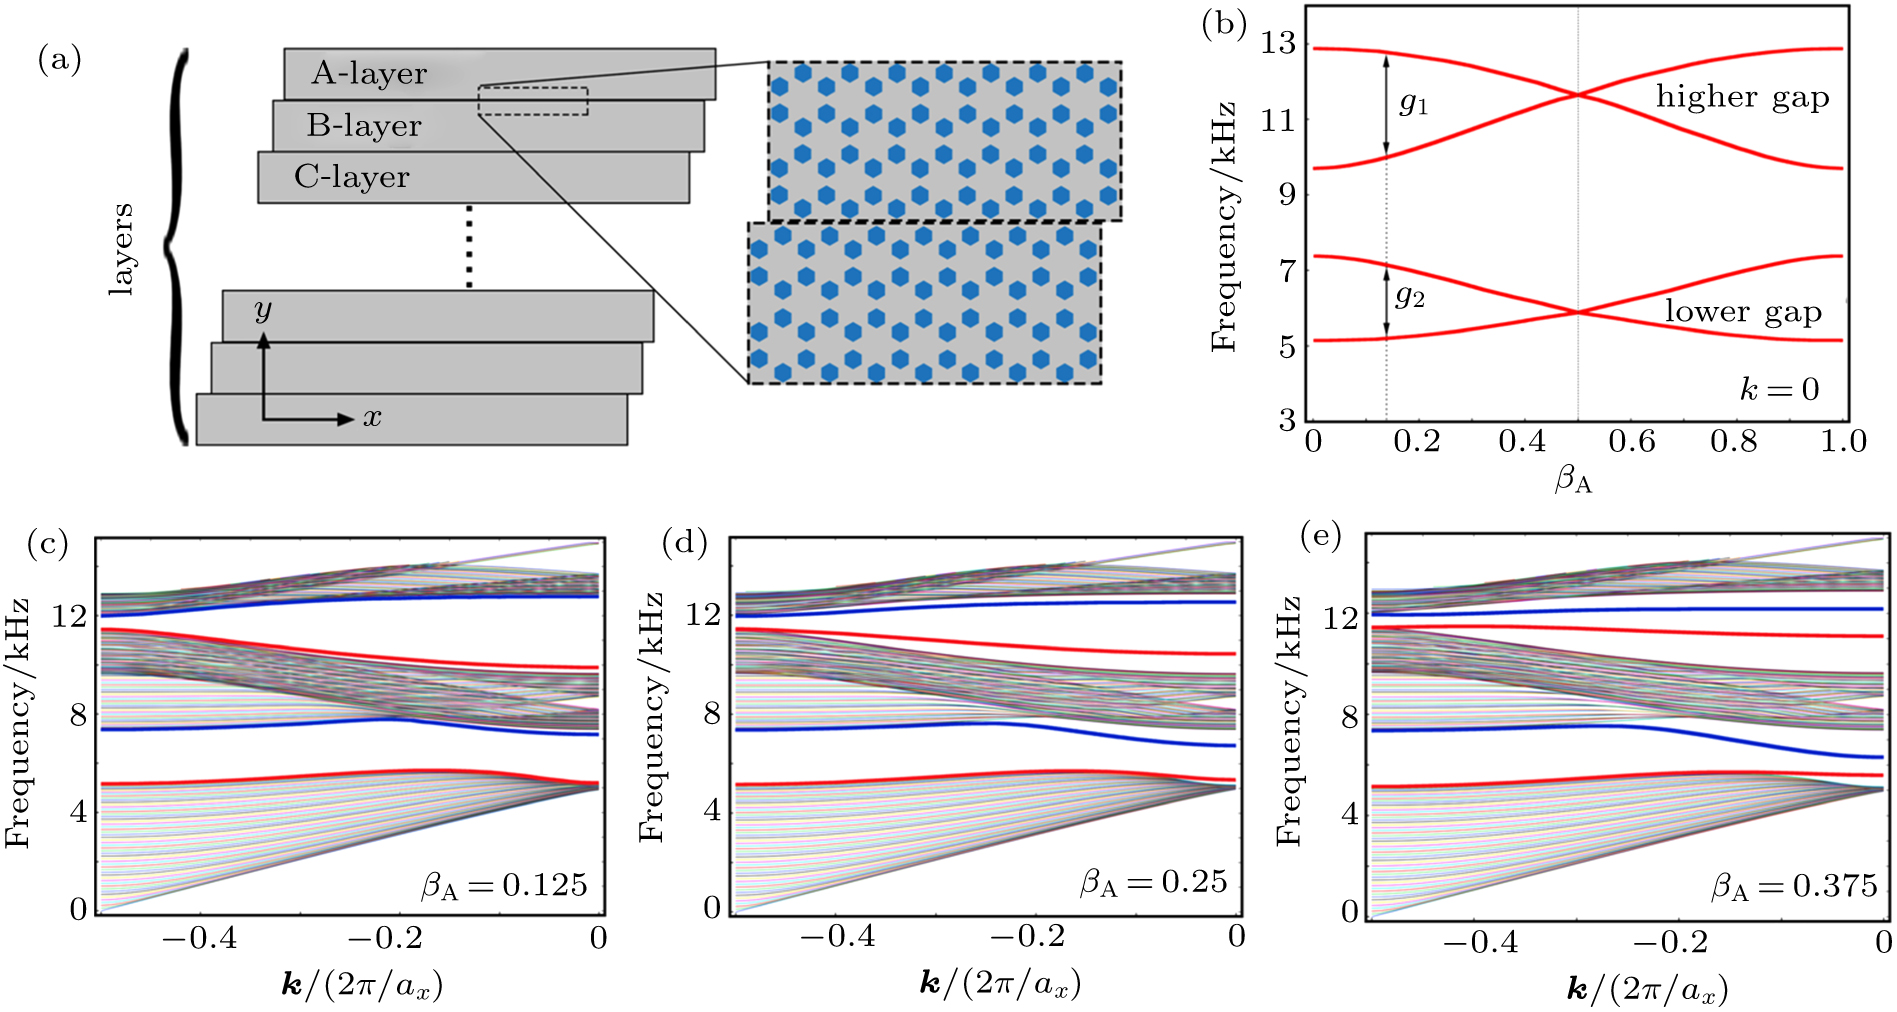
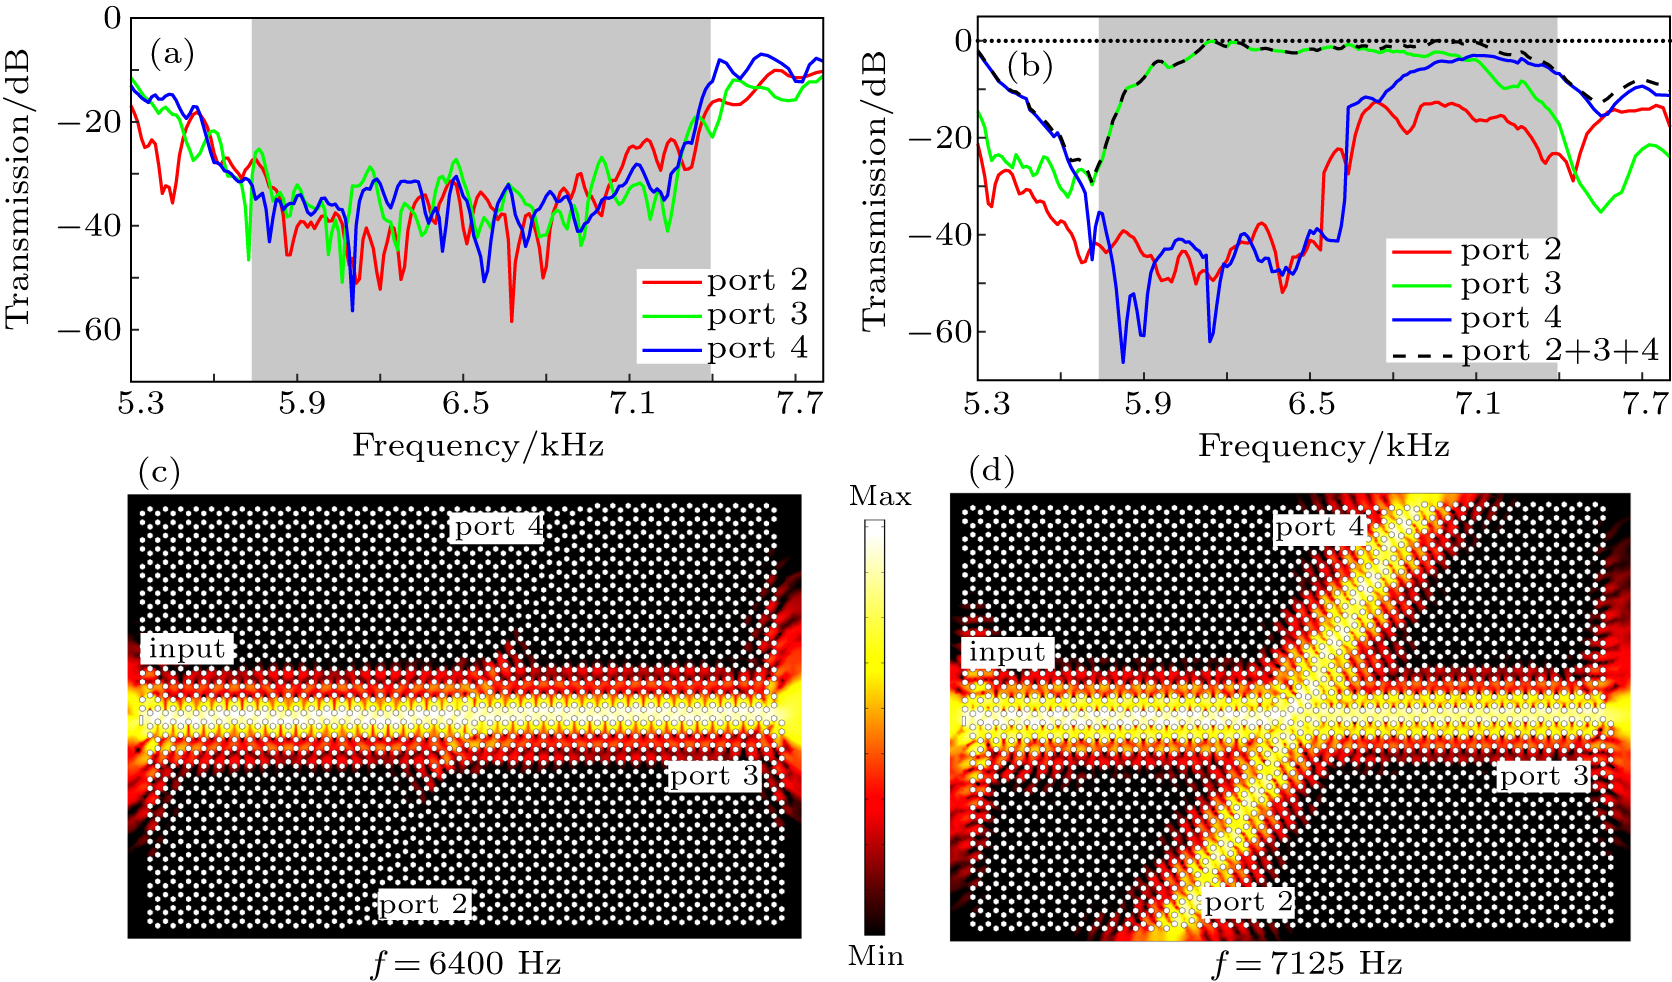
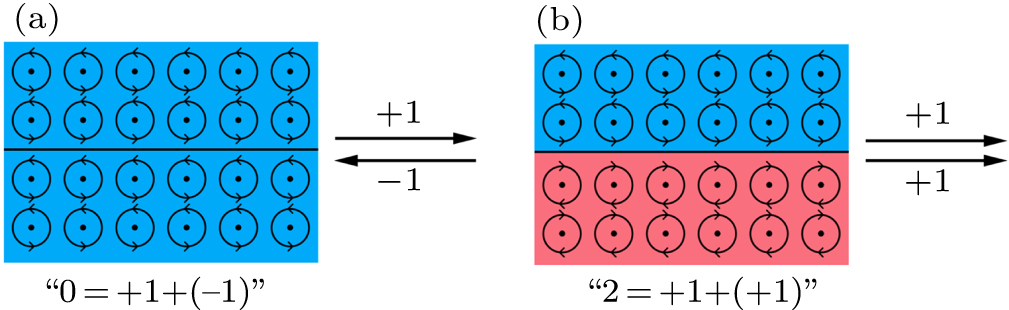
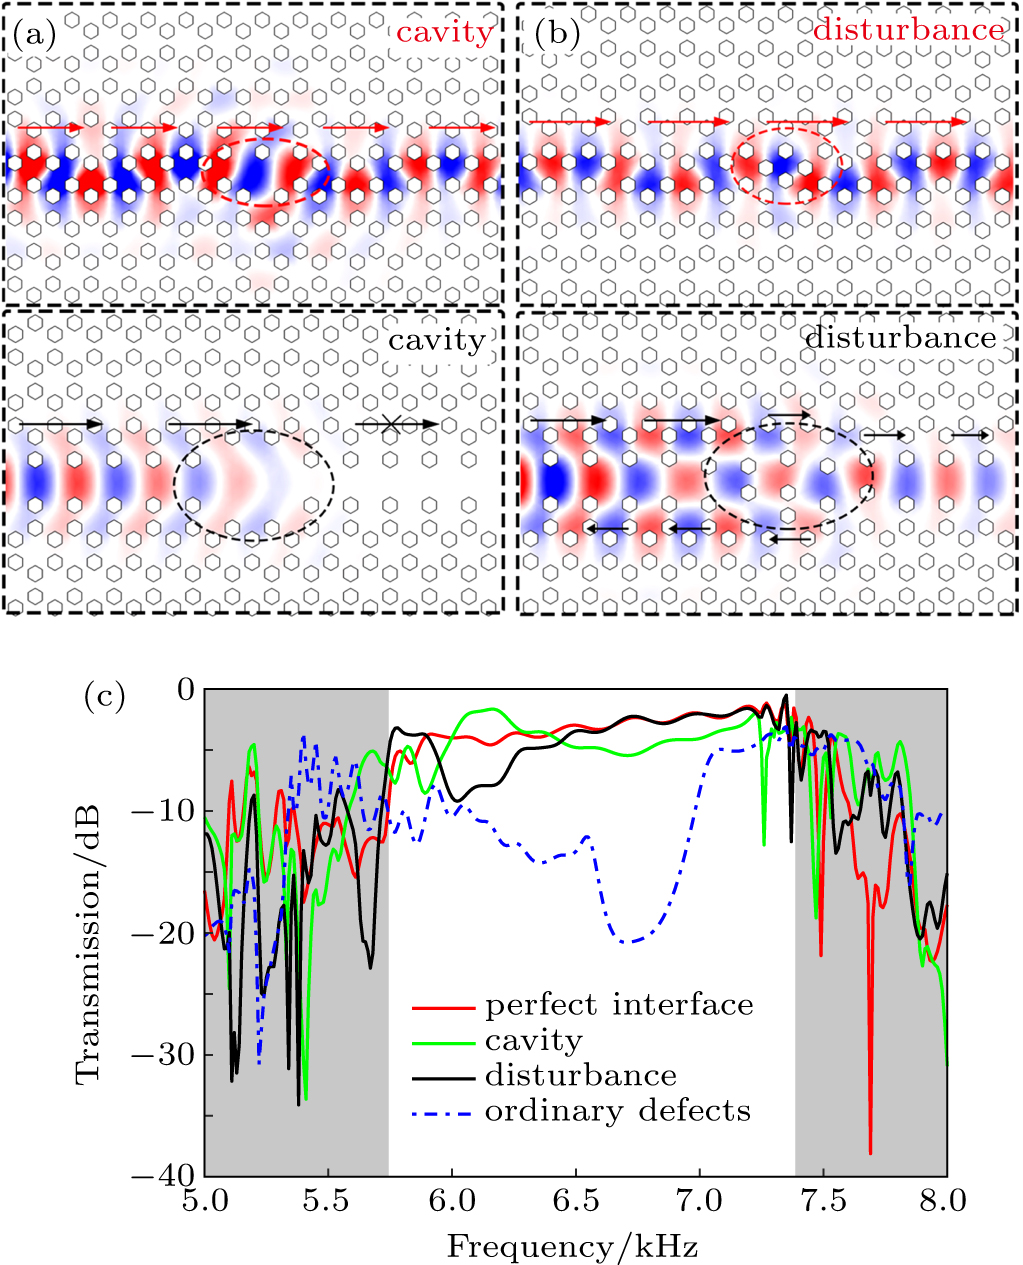
Abstract Unique topological states emerged in various topological insulators (TI) have been proved with great application value for robust wave regulation. In this work, we demonstrate the parity inversion related to the definition of the primitive cell in one common lattice, and realize a type of symmetry-controlled edge states confined on the zigzag interfaces of the graphene-like sonic topological crystal. By simply sliding the selected ‘layer’ near the interface, the coupling of the pseudospin states induced by the multiple scattering for the C6v lattice results in the adjustment of the edge states. Based on the physics of the states, we experimentally propose a prototype of acoustic topological filter hosting multiple channels with independent adjustable edge states and realize the selective high transmission. Our work diversifies the prospects for the applications of the gapped edge states in the robust wave regulation, and proposes a frame to design new topological devices.
|
Received: 11 April 2020
Revised: 23 May 2020
Accepted manuscript online: 12 June 2020
|
|
PACS:
|
43.20.+g
|
(General linear acoustics)
|
| |
43.35.+d
|
(Ultrasonics, quantum acoustics, and physical effects of sound)
|
| |
52.35.Dm
|
(Sound waves)
|
|
|
Corresponding Authors:
†Corresponding author. E-mail: xyzou@nju.edu.cn
|
| About author: †Corresponding author. E-mail: xyzou@nju.edu.cn * Project supported by the National Key R&D Program of China (Grant No. 2017YFA0303700), the National Natural Science Foundation of China (Grant Nos. 11634006, 11934009, and 11690030), the Natural Science Foundation of Jiangsu Province, China (Grant No. BK20191245), the Fundamental Research Funds for the Central Universities, China (Grant No. 020414380131), and the State Key Laboratory of Acoustics, Chinese Academy of Sciences. |
Cite this article:
Zhang-Zhao Yang(杨彰昭), Jin-Heng Chen(陈晋恒), Yao-Yin Peng(彭尧吟), and Xin-Ye Zou(邹欣晔)† Symmetry-controlled edge states in graphene-like topological sonic crystal 2020 Chin. Phys. B 29 104302
|
| [1] |
|
| [2] |
|
| [3] |
|
| [4] |
|
| [5] |
|
| [6] |
|
| [7] |
|
| [8] |
Hafezi M, Demler E A, Lukin M D, Taylor J M 2011 Nat. Phys. 7 907 DOI: 10.1038/nphys2063 |
| [9] |
|
| [10] |
Rechtsman M C, Zeuner J M, Plotnik Y, Lumer Y, Podolsky D, Dreisow F, Nolte S, Segev M, Szameit A 2013 Nature 496 196 DOI: 10.1038/nature12066 |
| [11] |
Khanikaev A B, Mousavi S H, Tse W, Kargarian M, MacDonald A H, Shvets G 2013 Nat. Mater. 12 233 DOI: 10.1038/nmat3520 |
| [12] |
|
| [13] |
|
| [14] |
|
| [15] |
|
| [16] |
Gao F, Xue H, Yang Z, Lai K, Yu Y, Lin X, Chong Y, Shvets G, Zhang B 2018 Nat. Phys. 14 140 DOI: 10.1038/nphys4304 |
| [17] |
Khanikaev A B, Fleury R, Mousavi S H, Alù A 2015 Nat. Commun. 6 8260 DOI: 10.1038/ncomms9260 |
| [18] |
|
| [19] |
|
| [20] |
|
| [21] |
Peng Y, Qin C, Zhao D, Shen Y, Xu X, Bao M, Jia H, Zhu X 2016 Nat. Commun. 7 13368 DOI: 10.1038/ncomms13368 |
| [22] |
He C, Ni X, Ge H, Sun X, Chen Y, Lu M, Liu X, Chen Y 2016 Nat. Phys. 12 1124 DOI: 10.1038/nphys3867 |
| [23] |
Lu J, Qiu C, Ye L, Fan X, Ke M, Zhang F, Liu Z 2017 Nat. Phys. 13 369 DOI: 10.1038/nphys3999 |
| [24] |
|
| [25] |
|
| [26] |
Ding Y J, Peng Y G, Zhu Y F, Fan X D, Yang J, Liang B, Zhu X F, Wan X G, Cheng J C 2019 Phys. Rev. Lett. 122 014302 DOI: 10.1103/PhysRevLett.122.014302 |
| [27] |
|
| [28] |
|
| [29] |
|
| [30] |
|
| [31] |
|
| [32] |
|
| [33] |
|
| [34] |
|
| [35] |
|
| [36] |
|
| [37] |
Serra-Garcia M, Peri V, Süsstrunk R, Bilal O R, Larsen T, Villanueva L G, Huber S D 2018 Nature 555 342 DOI: 10.1038/nature25156 |
| [38] |
|
| [39] |
|
| [40] |
Imhof S, Berger C, Bayer F, Brehm J, Molenkamp L W, Kiessling T, Schindler F, Lee C H, Greiter M, Neupert T, Thomale R 2018 Nat. Phys. 14 925 DOI: 10.1038/s41567-018-0246-1 |
| [41] |
Noh J, Benalcazar W A, Huang S, Collins M J, Chen K P, Hughes T L, Rechtsman M C 2018 Nat. Photon. 12 408 DOI: 10.1038/s41566-018-0179-3 |
| [42] |
|
| [43] |
|
| [44] |
Li M, Zhirihin D, Gorlach M, Ni X, Filonov D, Slobozhanyuk A, Alù A, Khanikaev A B 2020 Nat. Photon. 14 89 DOI: 10.1038/s41566-019-0561-9 |
| [45] |
|
| [46] |
|
| [47] |
|
| [48] |
|
| [49] |
|
| [50] |
|
| [51] |
Khelif A, Choujaa A, Benchabane S, Djafari-rouhani B, Laude V 2004 Appl. Phys. Lett. 84 4400 DOI: 10.1063/1.1757642 |
| [52] |
|
| [53] |
Ota Y, Liu F, Katsumi R, Watanabe K, Wakabayashi K, Arakawa Y, Iwamoto S 2019 Optica 6 786 DOI: 10.1364/OPTICA.6.000786 |
| [54] |
|
| [55] |
|
| [56] |
|
| No Suggested Reading articles found! |
|
|
Viewed |
|
|
|
Full text
|
|
|
|
|
Abstract
|
|
|
|
|
Cited |
|
|
|
|
Altmetric
|
|
blogs
Facebook pages
Wikipedia page
Google+ users
|
Online attention
Altmetric calculates a score based on the online attention an article receives. Each coloured thread in the circle represents a different type of online attention. The number in the centre is the Altmetric score. Social media and mainstream news media are the main sources that calculate the score. Reference managers such as Mendeley are also tracked but do not contribute to the score. Older articles often score higher because they have had more time to get noticed. To account for this, Altmetric has included the context data for other articles of a similar age.
View more on Altmetrics
|
|
|