| ELECTROMAGNETISM, OPTICS, ACOUSTICS, HEAT TRANSFER, CLASSICAL MECHANICS, AND FLUID DYNAMICS |
Prev
Next
|
|
|
Pseudo complementary measurement for traditional single-pixel cameras |
| Qian Dong(董乾)1, Xu-Ri Yao(姚旭日)2, †, Xin Liu(刘歆)3,4, Bing Liu(刘冰)2, and Guang-Jie Zhai(翟光杰)2,4$ |
1 State Key Laboratory of Computer Science, Institute of Software, Chinese Academy of Sciences, Beijing 100190, China
2 Key Laboratory of Electronics and Information Technology for Space Systems, National Space Science Center, Chinese Academy of Sciences, Beijing 100190, China
3 State Key Laboratory of Scientific and Engineering Computing, Academy of Mathematics and Systems Science, Chinese Academy of Sciences, Beijing 100190, China
4 University of Chinese Academy of Sciences, Beijing 100049, China |
|
|
|
|
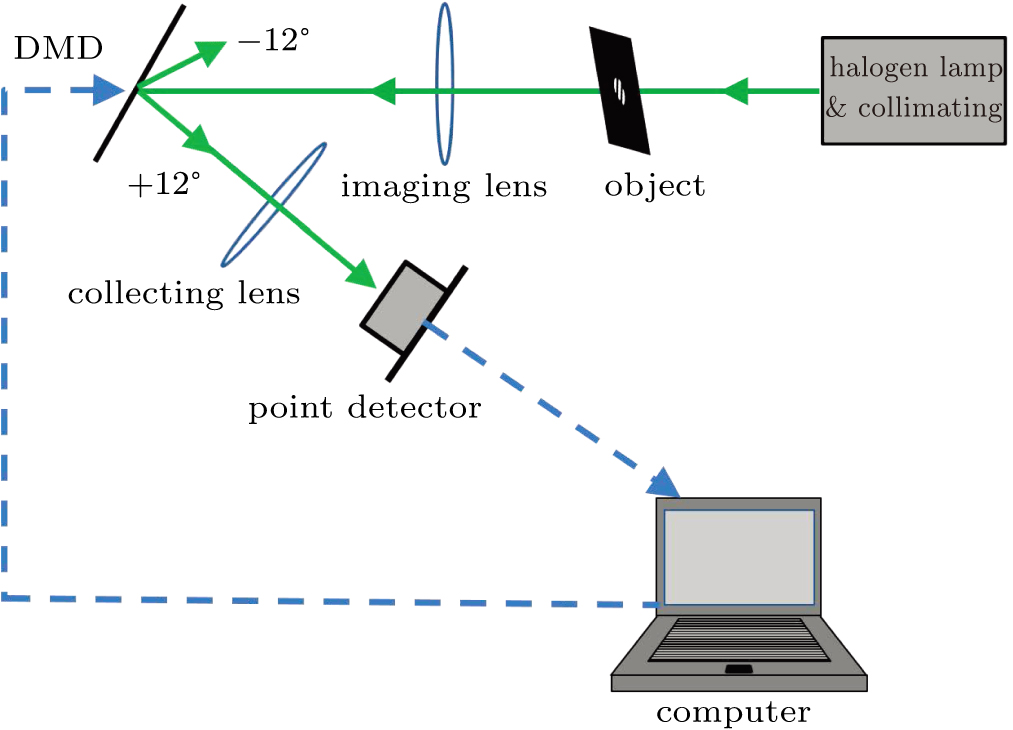
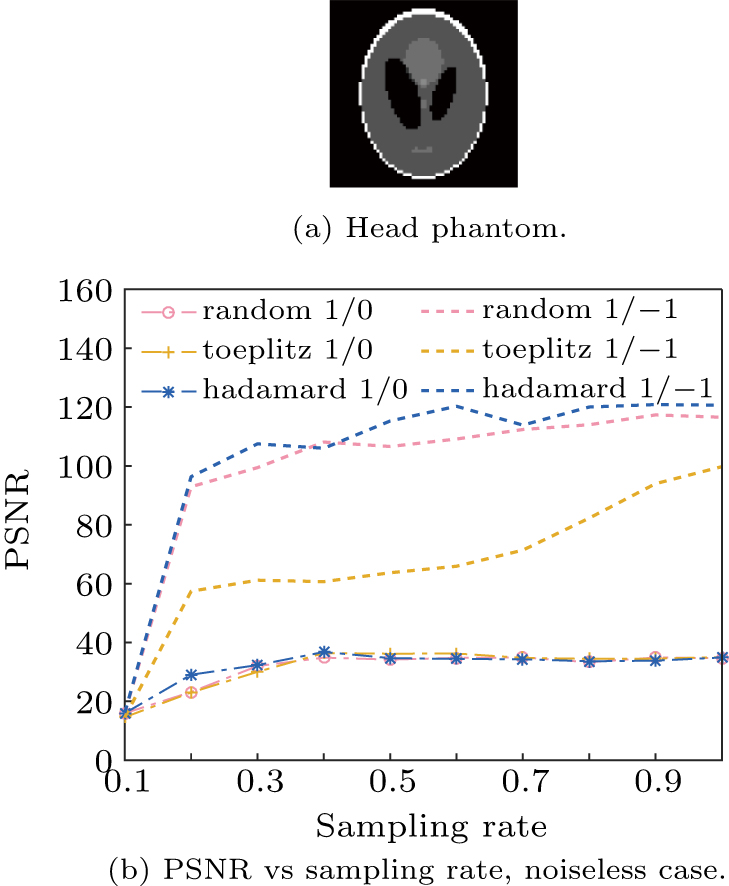
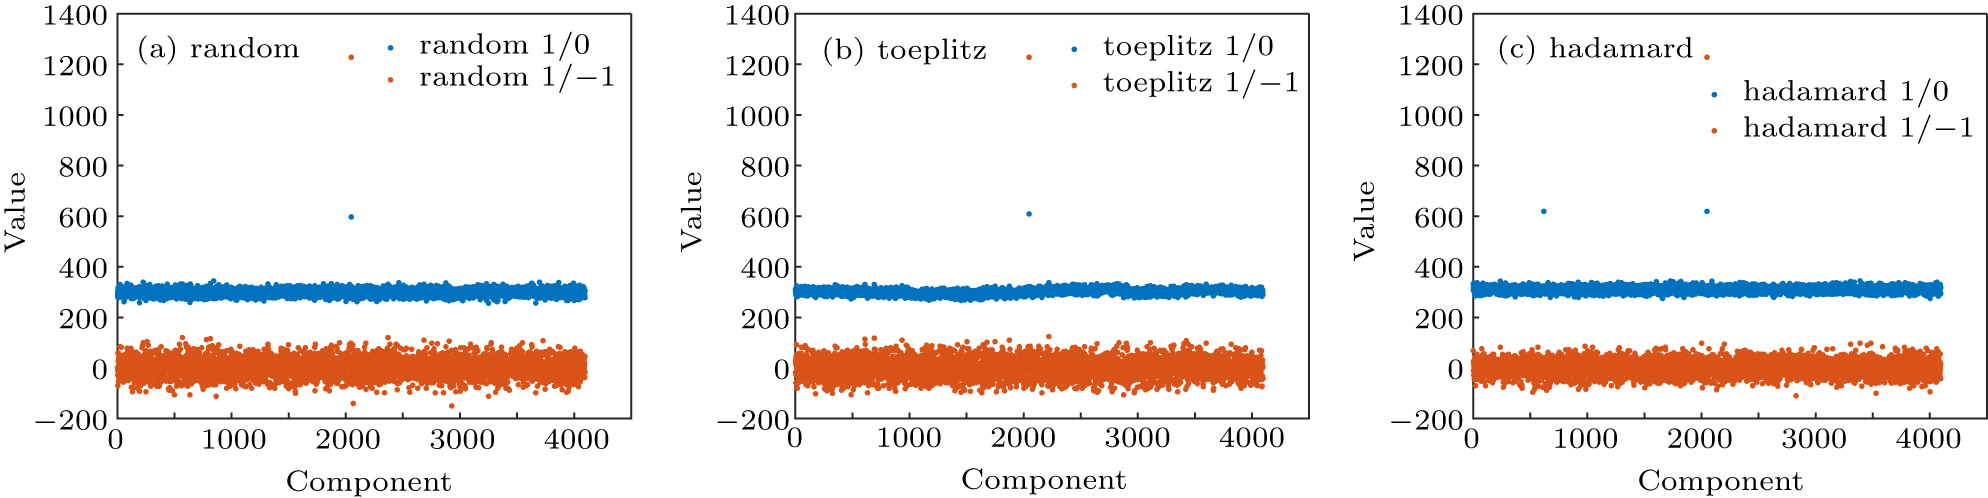
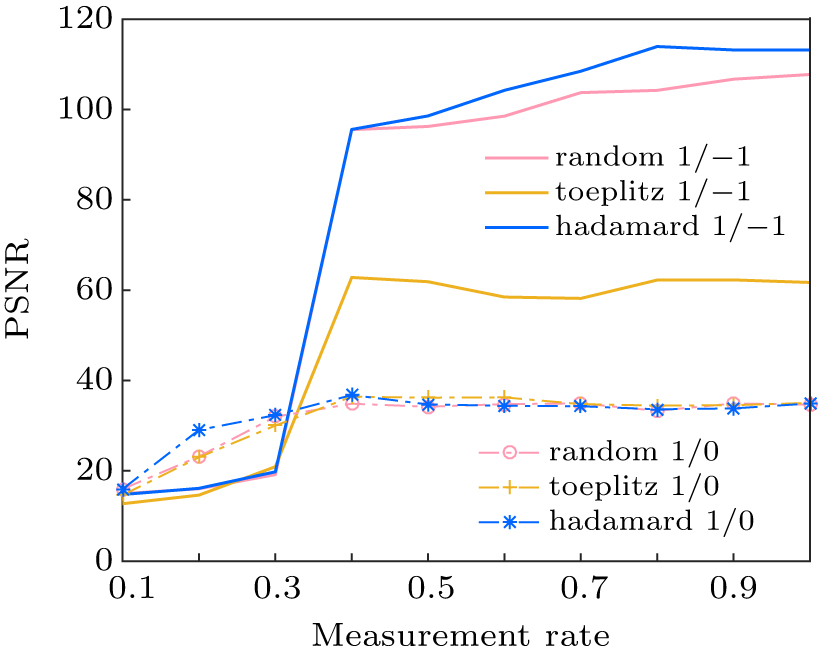
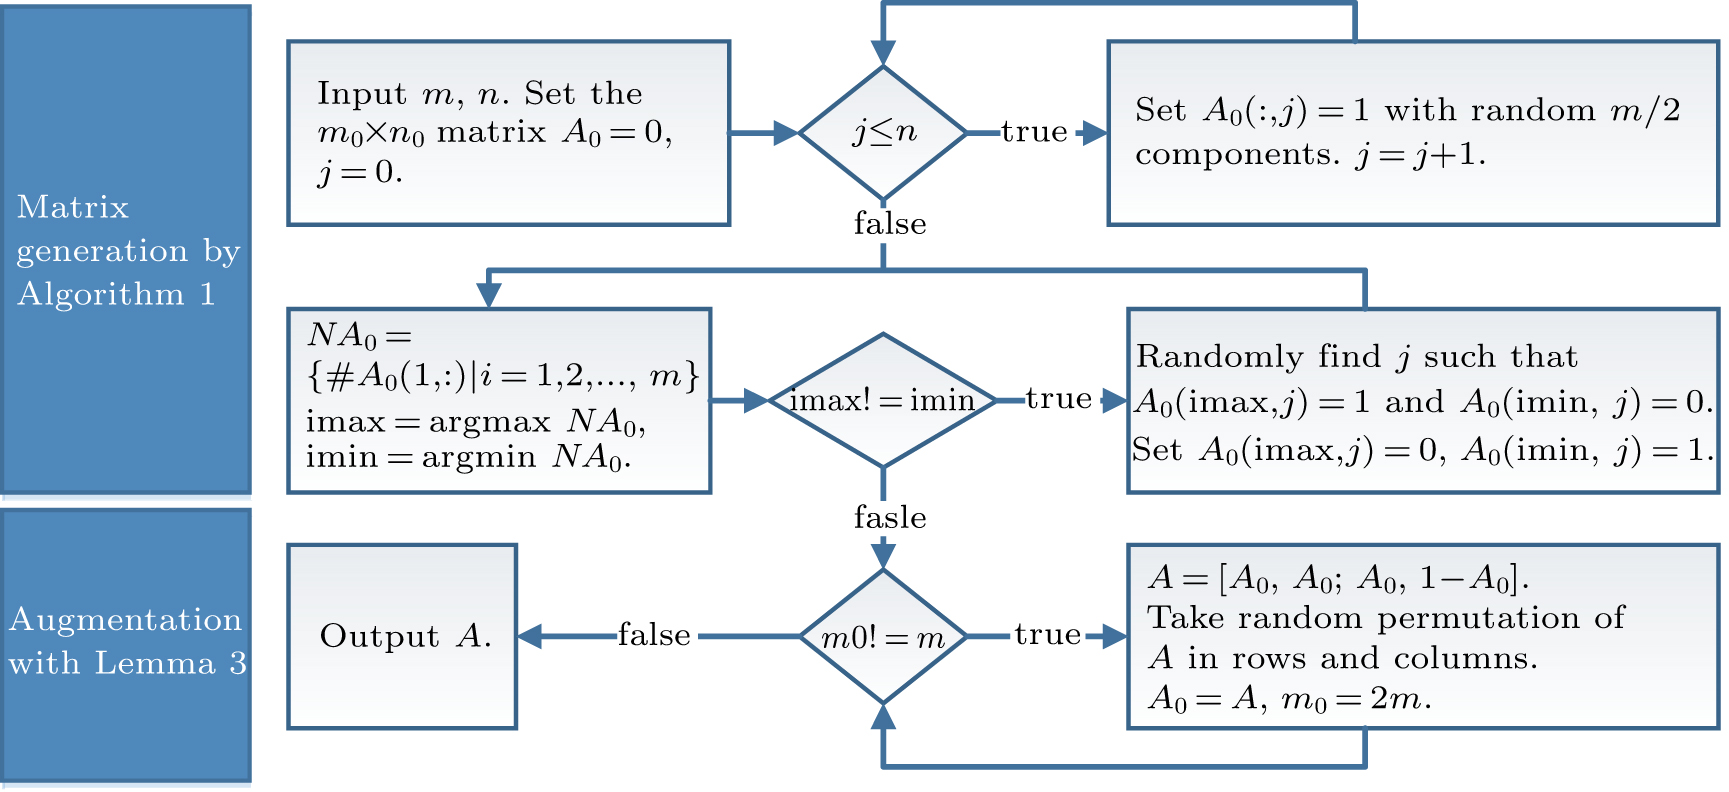
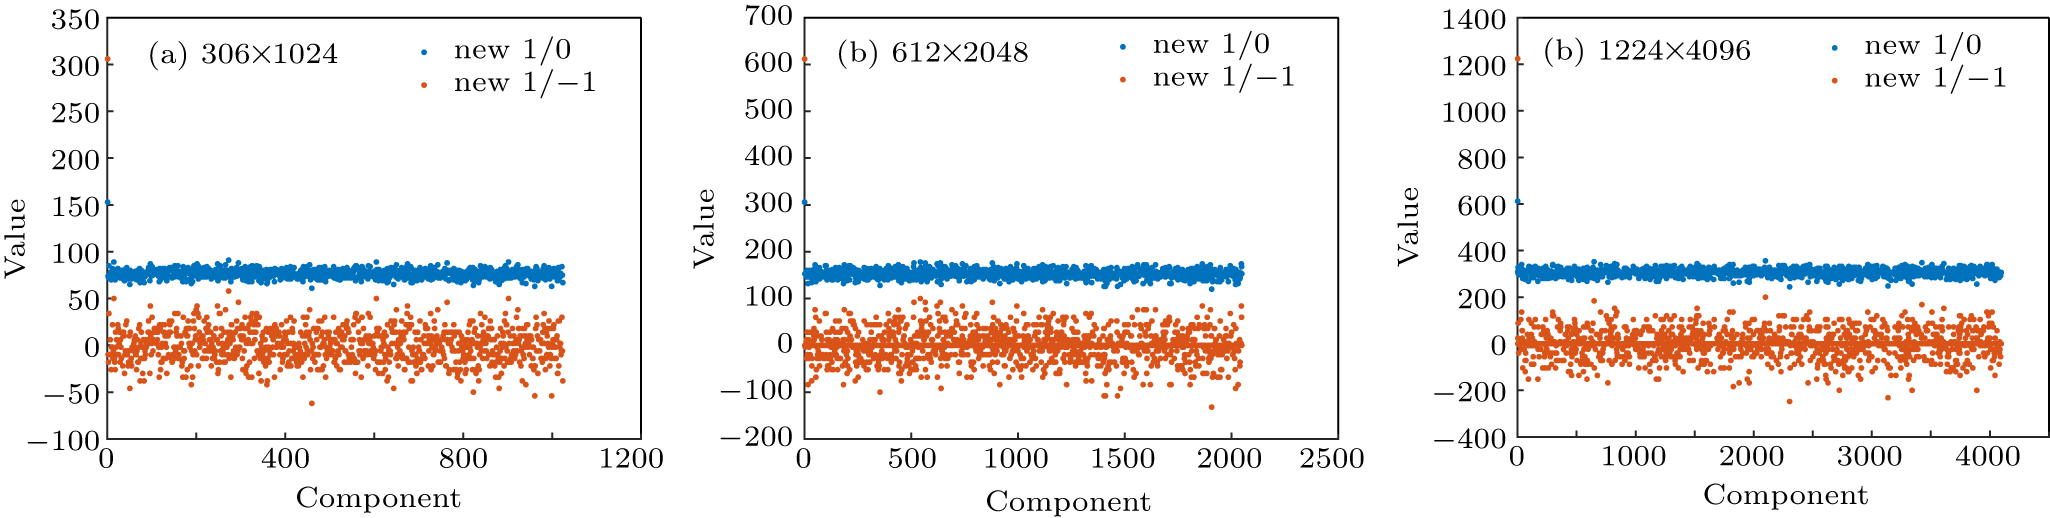
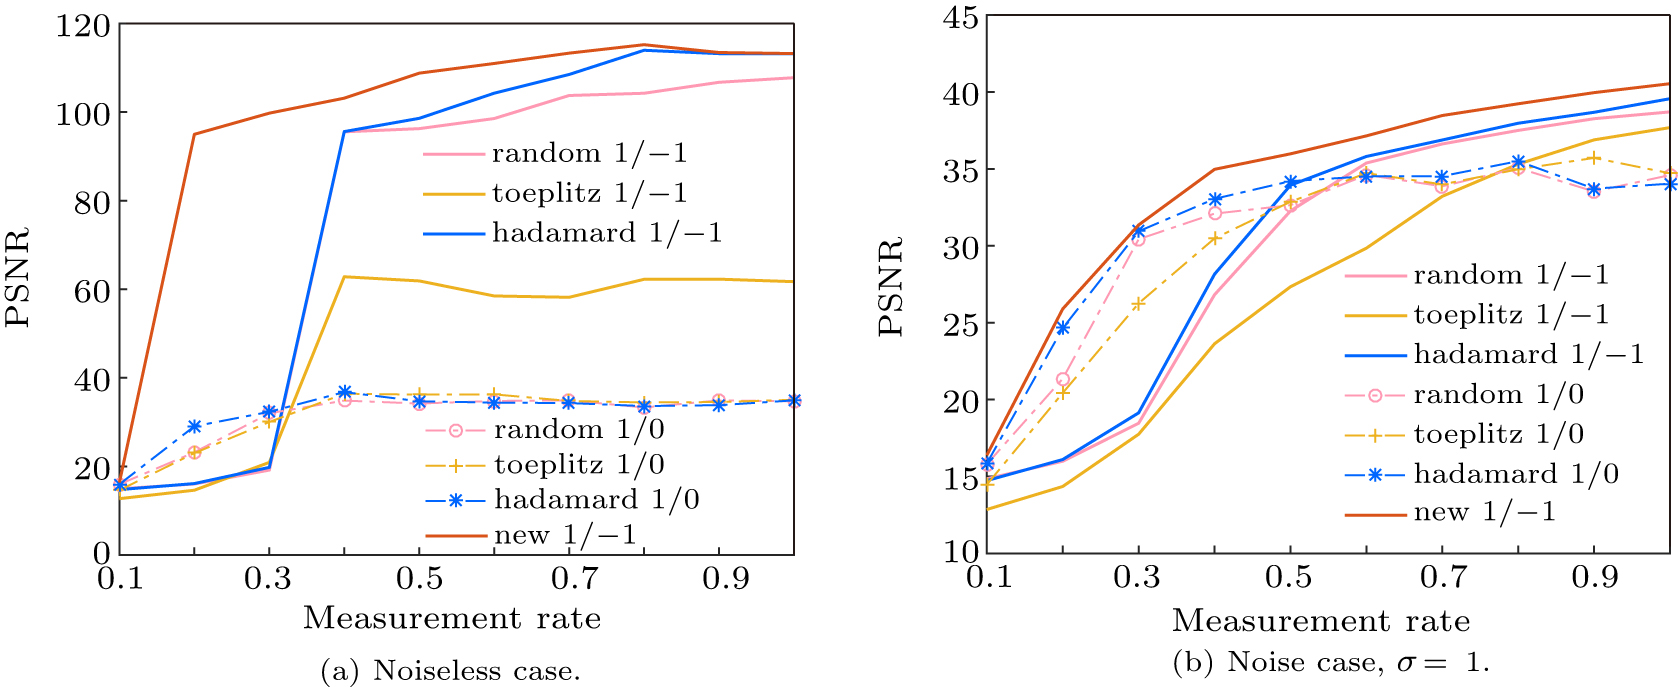
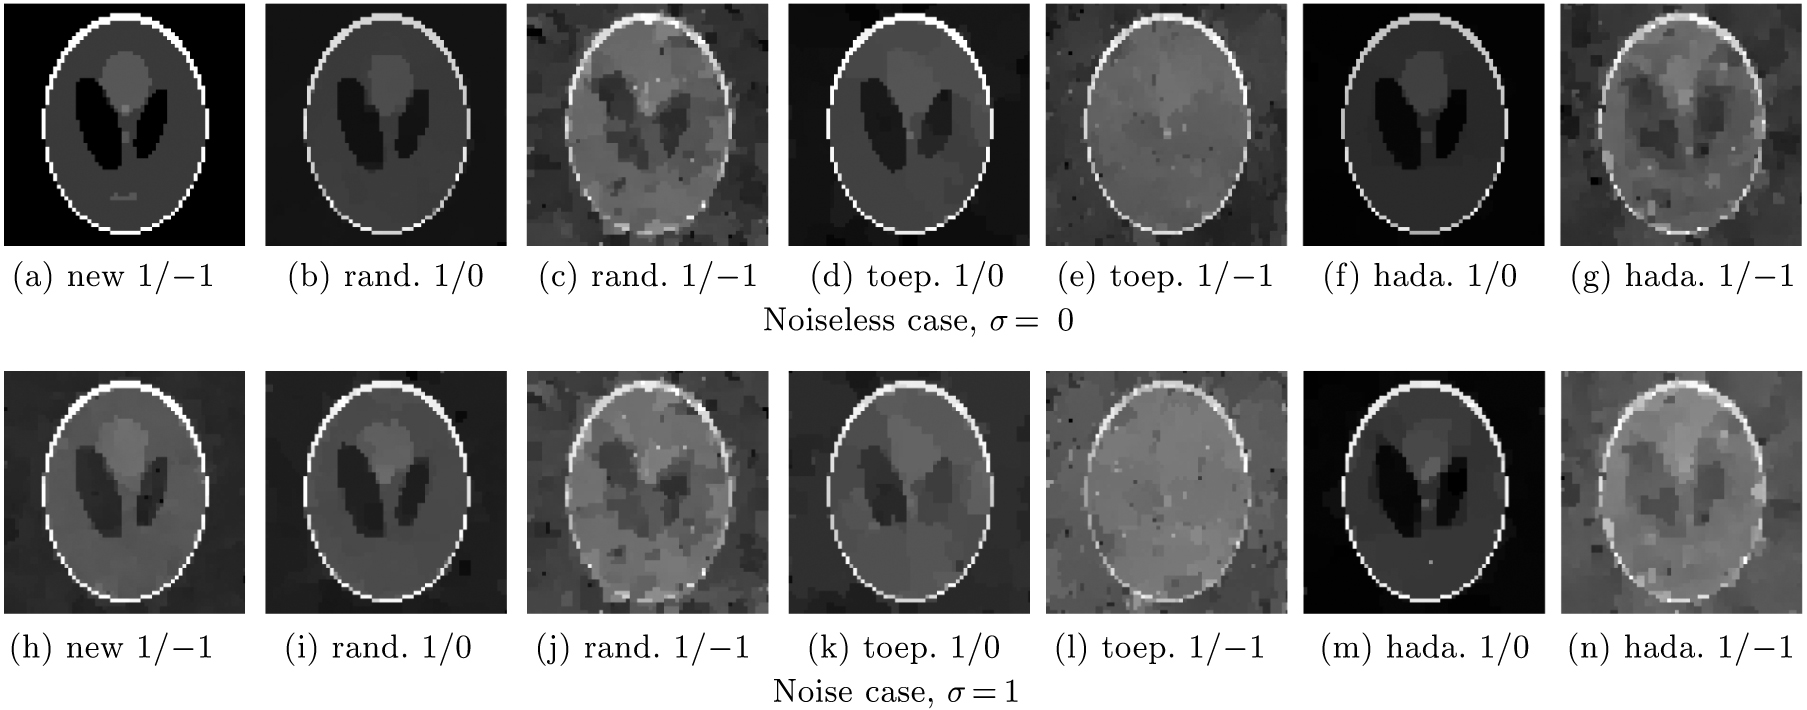
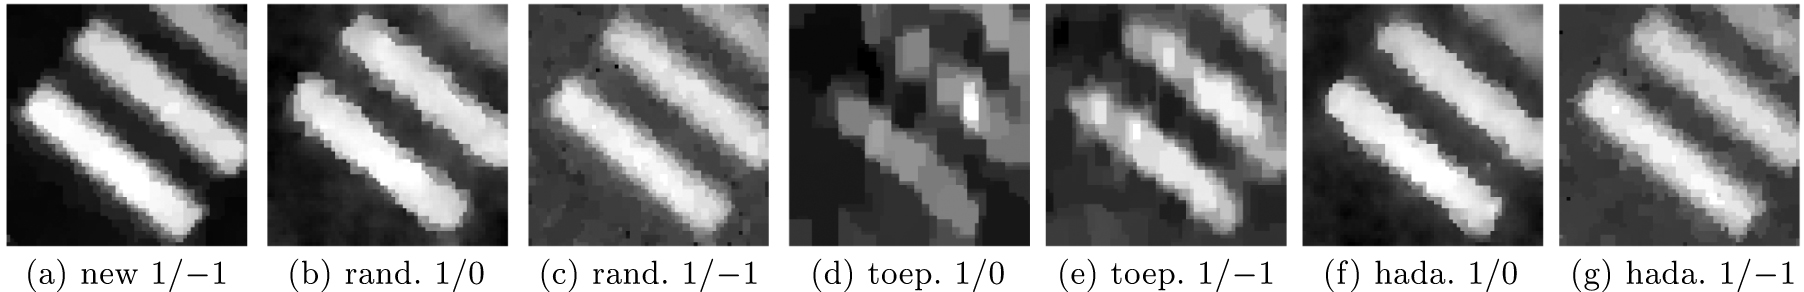
Abstract A traditional single-pixel camera needs a large number of measurements to reconstruct the object with compressive sensing computation. Compared with the 1/0 matrices in classical measurement, the 1/−1 matrices in the complementary measurement has better property for reconstruction computation and returns better reconstruction results. However, each row of the 1/−1 matrices needs two measurements with the traditional single-pixel camera which results into double measurements compared with the 1/0 matrices. In this paper, we consider the pseudo complementary measurement which only takes the same amount of measurements with the row number of some properly designed 1/0 matrix to compute the total luminous flux of the objective and derives the measurement data of the corresponding 1/−1 matrix in a mathematical way. The numerical simulation and experimental result show that the pseudo complementary measurement is an efficient tool for the traditional single-pixel camera imaging under low measurement rate, which can combine the advantages of the classical and complementary measurements and significantly improve the peak signal-to-noise ratio.
|
Received: 25 May 2020
Revised: 08 July 2020
Accepted manuscript online: 25 August 2020
|
| Fund: the National Key Research and Development Program of China (Grant No. 2018YFB0504302), the Youth Innovation Promotion Association of Chinese Academy of Sciences, and the National Natural Science Foundation of China (Grant Nos. 11701545, 11971466, and 11991021). |
|
Corresponding Authors:
†Corresponding author. E-mail: yaoxuri@nssc.ac.cn
|
Cite this article:
Qian Dong(董乾), Xu-Ri Yao(姚旭日), Xin Liu(刘歆), Bing Liu(刘冰), and Guang-Jie Zhai(翟光杰)$ Pseudo complementary measurement for traditional single-pixel cameras 2020 Chin. Phys. B 29 114202
|
| [1] |
|
| [2] |
|
| [3] |
Candès E J 2006 Proceedings of the International Congress of Mathematicians Madrid Spain 3 1433 DOI: 10.4171/022-3/69 |
| [4] |
|
| [5] |
|
| [6] |
Takhar D, Laska J, Wakin M B, Duarte M F, Baron D, Sarvotham S, Kelly K, Baraniuk R G 2006 IS&T/SPIE Computational Imaging IV 6065 606509 DOI: 10.1117/12.659602 |
| [7] |
Duarte M F, Davenport M A, Takbar D, Laska J N, Sun T, Kelly K F, Baraniuk R G 2008 IEEE Signal Process. Magaz. 25 83 DOI: 10.1109/MSP.2007.914730 |
| [8] |
Chan W L, Charan K, Takhar D, Kelly K F, Baraniuk R G, Mittleman D M 2008 Appl. Phys. Lett. 93 121105 DOI: 10.1063/1.2989126 |
| [9] |
Radwell N, Mitchell K J, Gibson G M, Edgar M P, Bowman R, Padgett M J 2014 Optica 1 285 DOI: 10.1364/OPTICA.1.000285 |
| [10] |
Edgar M P, Gibson G M, Bowman R W, Sun B, Radwell N, Mitchell K J, Welsh S S, Padgett M J 2015 Sci. Rep. 5 srep10669 DOI: 10.1038/srep10669 |
| [11] |
|
| [12] |
Sun M, Edgar M, Gibson G, Sun B, Radwell N, Lamb R N, Padgett M J 2016 Nat. Commun. 7 12010 DOI: 10.1038/ncomms12010 |
| [13] |
Li F, Chen H, Pediredla A, Yeh C, He K, Veeraraghavan A, Cossairt O 2017 Opt. Express 25 31096 DOI: 10.1364/OE.25.031096 |
| [14] |
Studer V, Bobin J, Chahid M, Mousavi H S, Candès J, Dahan M 2012 Proc. Natl. Acad. Sci. USA 109 E1679 DOI: 10.1073/pnas.1119511109 |
| [15] |
|
| [16] |
Arce G R, Brady D J, Carin L, Arguello H, Kittle D S 2014 IEEE Signal Process. Magaz. 31 105 DOI: 10.1109/MSP.2013.2278763 |
| [17] |
|
| [18] |
|
| [19] |
|
| [20] |
|
| [21] |
|
| [22] |
Yu W, Liu X, Yao X, Wang C, Zhai Y, Zhai G 2014 Sci. Rep. 4 5834 DOI: 10.1038/srep05834 |
| [23] |
|
| [24] |
Sun B, Welsh S S, Edgar M P, Shapiro J H, Padgett M J 2012 Opt. Express 20 16892 DOI: 10.1364/OE.20.016892 |
| [25] |
Soldevila F, Clemente P, Tajahuerce E, Uribe-Patarroyo N, Andrès P, Lancis J 2016 Sci. Rep. 6 29181 DOI: 10.1038/srep29181 |
| [26] |
|
| [27] |
Zhang G, Jiao S, Xu X, Wang L 2010 IEEE International Conference on Information and Automation (ICIA) 455 DOI: 10.1109/ICINFA.2010.5512379 |
| [28] |
Do T T, Tran T D, Gan L 2008 IEEE International Conference on Acoustics, Speech and Signal Processing 3369 DOI: 10.1109/ICIP.2010.5652780 |
| [29] |
Monajemi H, Jafarpour S, Gavish M, Collaboration S C, Donoho D L 2013 Proc. Natl. Acad. Sci. USA 110 1181 DOI: 10.1073/pnas.1219540110 |
| [30] |
|
| [31] |
Bajwa W U, Haupt J D, Raz G M, Wright S J, Nowak R D 2007 IEEE/SP 14th Workshop on Statistical Signal Processing 294 DOI: 10.1109/SSP.2007.4301266 |
| [32] |
|
| [33] |
Sebert F, Zou Y, Ying L 2008 IEEE ITAB International Conference on Information Technology and Applications in Biomedicine 47 DOI: 10.1109/ITAB.2008.4570587 |
| [34] |
|
| No Suggested Reading articles found! |
|
|
Viewed |
|
|
|
Full text
|
|
|
|
|
Abstract
|
|
|
|
|
Cited |
|
|
|
|
Altmetric
|
|
blogs
Facebook pages
Wikipedia page
Google+ users
|
Online attention
Altmetric calculates a score based on the online attention an article receives. Each coloured thread in the circle represents a different type of online attention. The number in the centre is the Altmetric score. Social media and mainstream news media are the main sources that calculate the score. Reference managers such as Mendeley are also tracked but do not contribute to the score. Older articles often score higher because they have had more time to get noticed. To account for this, Altmetric has included the context data for other articles of a similar age.
View more on Altmetrics
|
|
|