|
Special Issue:
SPECIAL TOPIC — Modeling and simulations for the structures and functions of proteins and nucleic acids
|
| SPECIAL TOPIC—Modeling and simulations for the structures and functions of proteins and nucleic acids |
Prev
Next
|
|
|
Application of topological soliton in modeling protein folding: Recent progress and perspective |
| Xu-Biao Peng(彭绪彪)1,†, Jiao-Jiao Liu(刘娇娇)1, Jin Dai(戴劲)1,2, Antti J Niemi1,2,‡, and Jian-Feng He(何建锋)1,§ |
1 School of Physics, Beijing Institute of Technology, Beijing 100081, China
2 Nordita, Stockholm University, Roslagstullsbacken 23, SE-106 91 Stockholm, Sweden |
|
|
|
|
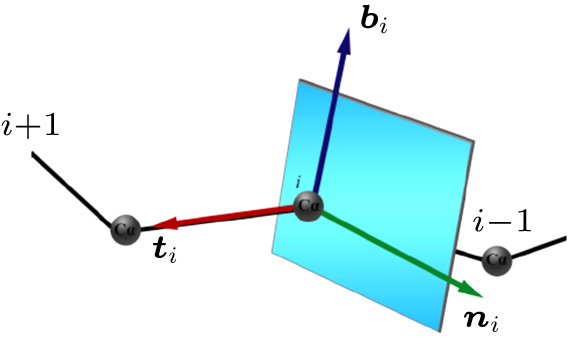
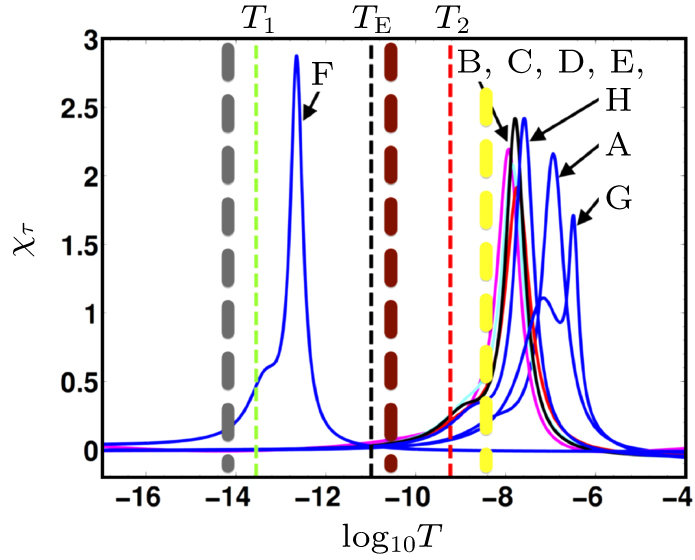
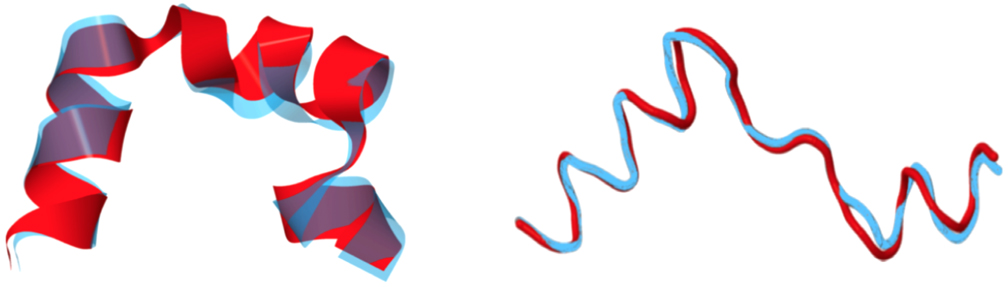
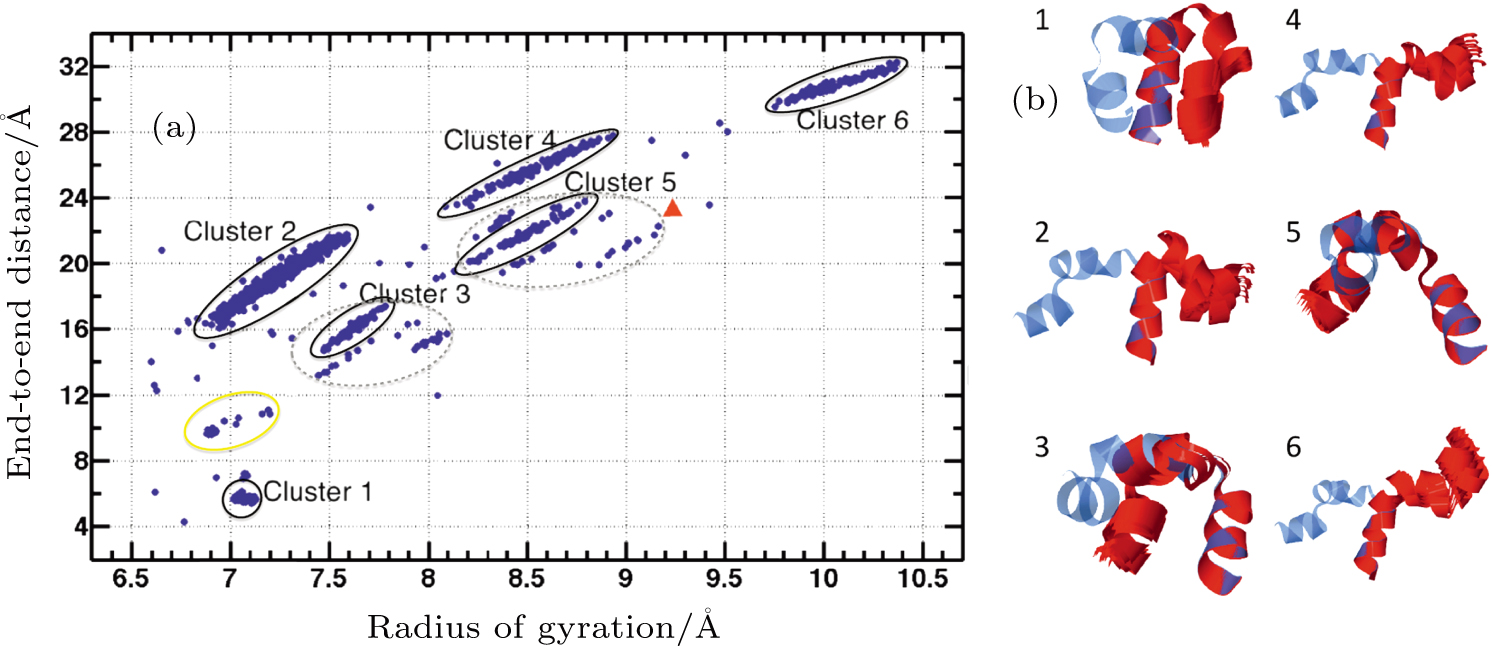
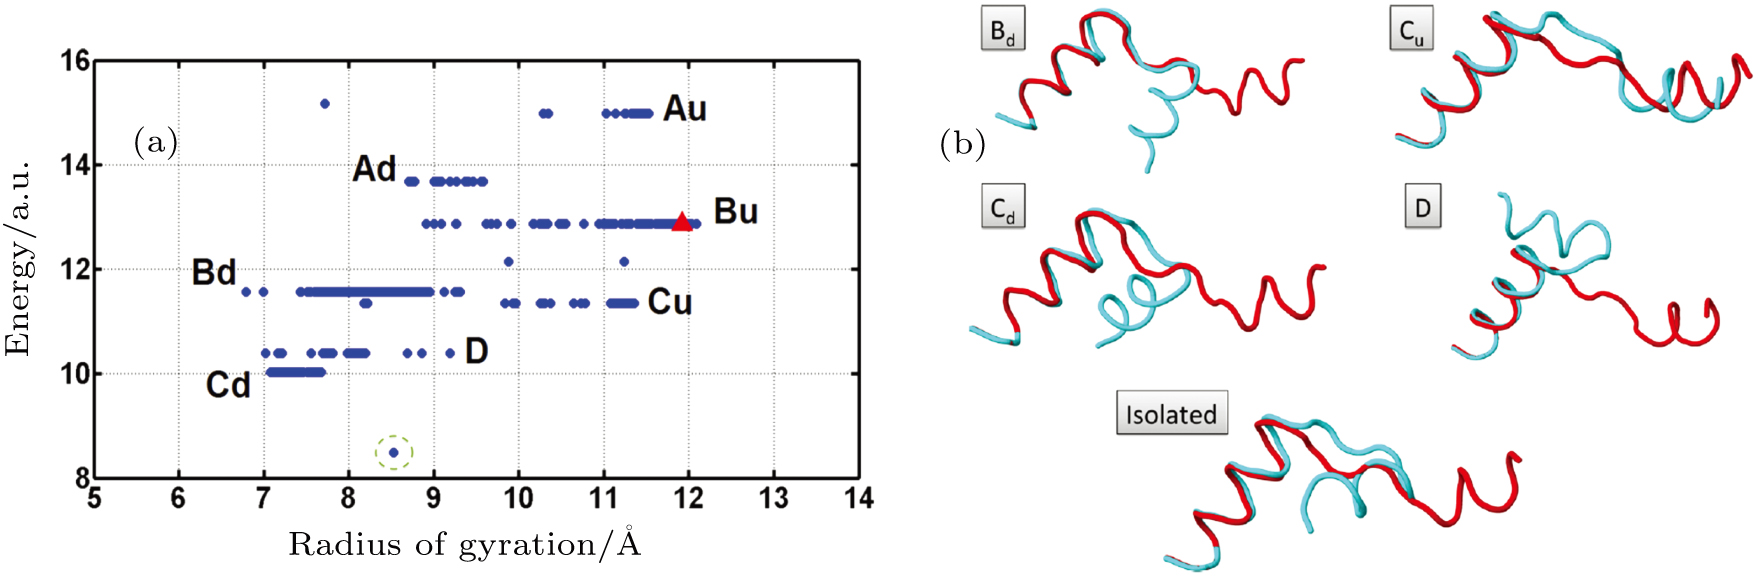
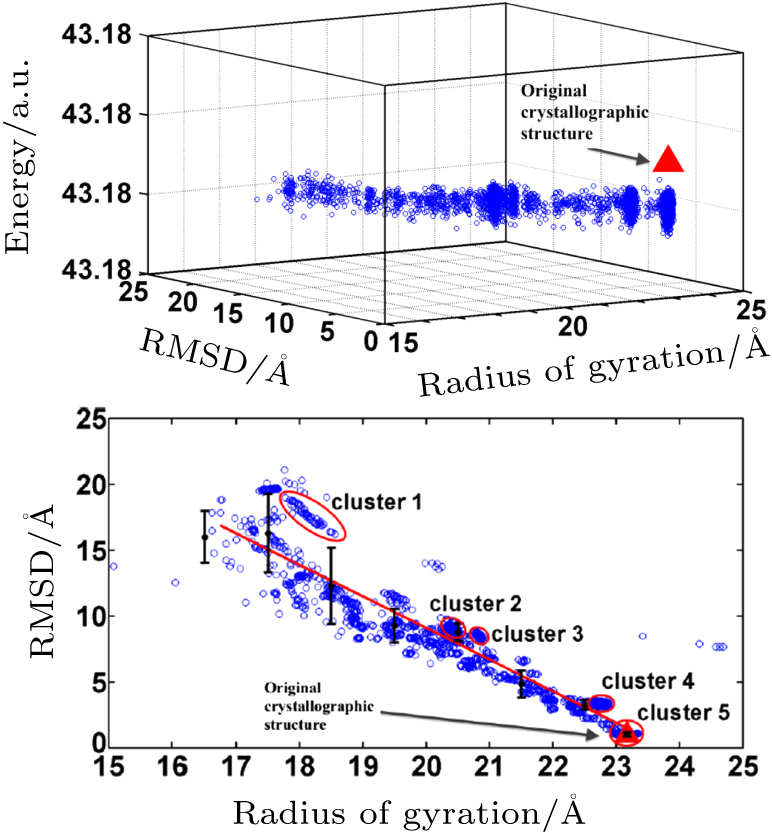
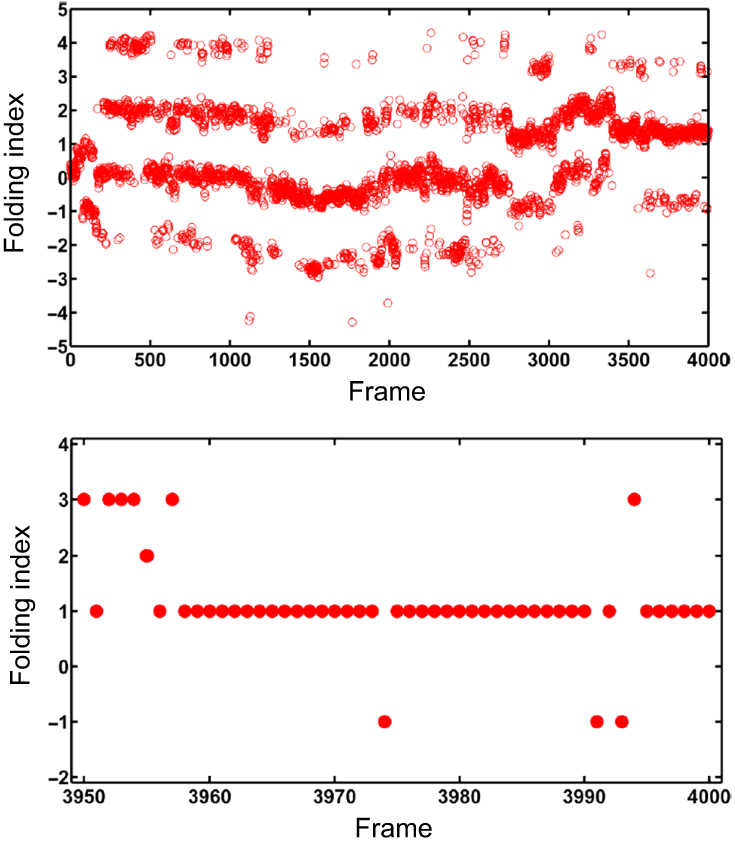
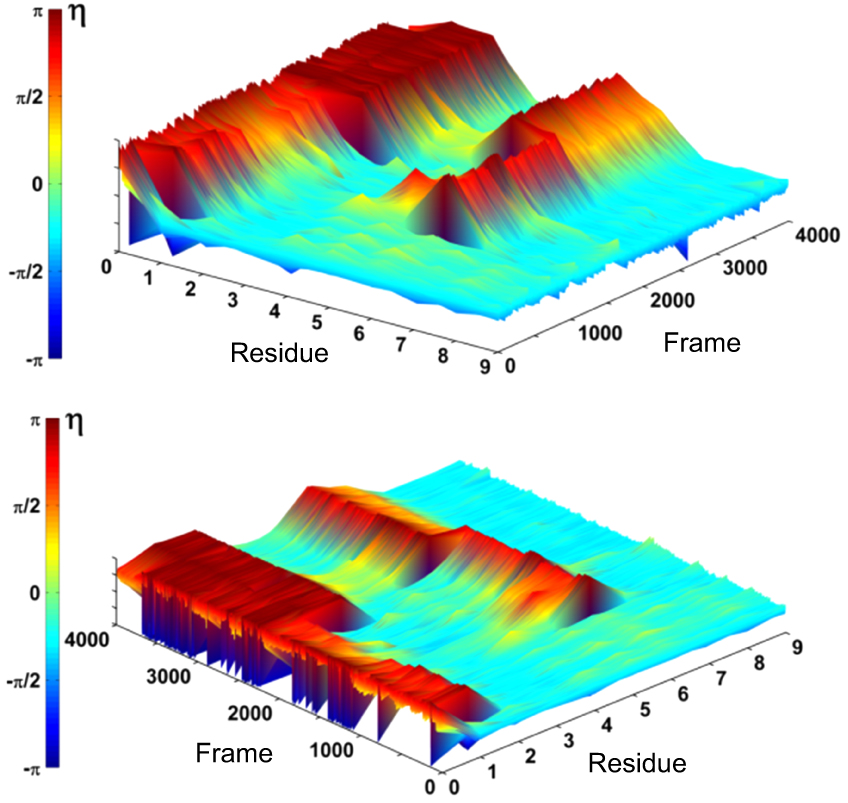
Abstract Proteins are important biological molecules whose structures are closely related to their specific functions. Understanding how the protein folds under physical principles, known as the protein folding problem, is one of the main tasks in modern biophysics. Coarse-grained methods play an increasingly important role in the simulation of protein folding, especially for large proteins. In recent years, we proposed a novel coarse-grained method derived from the topological soliton model, in terms of the backbone Cα chain. In this review, we will first systematically address the theoretical method of topological soliton. Then some successful applications will be displayed, including the thermodynamics simulation of protein folding, the property analysis of dynamic conformations, and the multi-scale simulation scheme. Finally, we will give a perspective on the development and application of topological soliton.
|
Received: 30 June 2020
Revised: 08 August 2020
Accepted manuscript online: 13 August 2020
|
|
PACS:
|
87.15.Cc
|
(Folding: thermodynamics, statistical mechanics, models, and pathways)
|
| |
87.14.E-
|
(Proteins)
|
| |
87.15.A-
|
(Theory, modeling, and computer simulation)
|
| |
87.15.hm
|
(Folding dynamics)
|
|
|
Corresponding Authors:
†E-mail: xubiaopeng@bit.edu.cn ‡E-mail: Antti.Niemi@physics.uu.se §Corresponding author. E-mail: hjf@bit.edu.cn
|
Cite this article:
Xu-Biao Peng(彭绪彪)†, Jiao-Jiao Liu(刘娇娇), Jin Dai(戴劲), Antti J Niemi‡, and Jian-Feng He(何建锋)§ Application of topological soliton in modeling protein folding: Recent progress and perspective 2020 Chin. Phys. B 29 108705
|
| [1] |
|
| [2] |
|
| [3] |
|
| [4] |
|
| [5] |
|
| [6] |
|
| [7] |
|
| [8] |
|
| [9] |
|
| [10] |
Domingo E 2016 Virus as Populations London Elsevier 299
|
| [11] |
|
| [12] |
|
| [13] |
Wang J, Mao K, Zhao Y, Zeng C, Xiang J, Zhang Y, Xiao Y 2017 Nucleic Acids Res. 45 6299 DOI: 10.1093/nar/gkx386 |
| [14] |
Yang J, Anishchenko I, Park H, Peng Z, Ovchinnikov S, Baker D 2020 Proc. Natl. Acad. Sci. USA 117 1496 DOI: 10.1073/pnas.1914677117 |
| [15] |
|
| [16] |
Chen H, Yuan G, Winardhi R S, Yao M, Popa I, Fernandez J M, Yan J 2015 J. Am. Chem. Soc. 137 3540 DOI: 10.1021/ja5119368 |
| [17] |
|
| [18] |
|
| [19] |
|
| [20] |
|
| [21] |
|
| [22] |
|
| [23] |
|
| [24] |
|
| [25] |
|
| [26] |
Khalili M, Liwo A, Jagielska A, Scheraha H 2005 J. Phys. Chem. B 109 13798 DOI: 10.1021/jp058007w |
| [27] |
|
| [28] |
|
| [29] |
|
| [30] |
|
| [31] |
|
| [32] |
Wang Y, Chu X, Suo Z, Wang E, Wang J 2012 J. Am. Chem. Soc. 134 13755 DOI: 10.1021/ja3045663 |
| [33] |
|
| [34] |
|
| [35] |
He J F, Dai J, Li J, Peng X B, Niemi A J 2015 J. Chem. Phys. 142 045102 DOI: 10.1063/1.4905586 |
| [36] |
|
| [37] |
|
| [38] |
|
| [39] |
|
| [40] |
|
| [41] |
Landau L D, Lifshitz E M 2013 Statistical Physics 5 London Elsevier 429
|
| [42] |
|
| [43] |
|
| [44] |
|
| [45] |
|
| [46] |
|
| [47] |
|
| No Suggested Reading articles found! |
|
|
Viewed |
|
|
|
Full text
|
|
|
|
|
Abstract
|
|
|
|
|
Cited |
|
|
|
|
Altmetric
|
|
blogs
Facebook pages
Wikipedia page
Google+ users
|
Online attention
Altmetric calculates a score based on the online attention an article receives. Each coloured thread in the circle represents a different type of online attention. The number in the centre is the Altmetric score. Social media and mainstream news media are the main sources that calculate the score. Reference managers such as Mendeley are also tracked but do not contribute to the score. Older articles often score higher because they have had more time to get noticed. To account for this, Altmetric has included the context data for other articles of a similar age.
View more on Altmetrics
|
|
|