| CONDENSED MATTER: STRUCTURAL, MECHANICAL, AND THERMAL PROPERTIES |
Prev
Next
|
|
|
Structure and tribological properties of Si/a-C:H(Ag) multilayer film in stimulated body fluid |
| Yan-Xia Wu(吴艳霞)1, Yun-Lin Liu(刘云琳)1, Ying Liu(刘颖)1, Bing Zhou(周兵)1, Hong-Jun Hei(黑鸿君)1, Yong Ma(马永)1, Sheng-Wang Yu(于盛旺)1, †, and Yu-Cheng Wu(吴玉程)1, 2,, ‡ |
1 Institute of New Carbon Materials, Taiyuan University of Technology, Taiyuan 030024, China
2 Key Laboratory of Interface Science and Engineering in Advanced Materials (Taiyuan University of Technology), Ministry of Education, Taiyuan 030024, China |
|
|
|
|
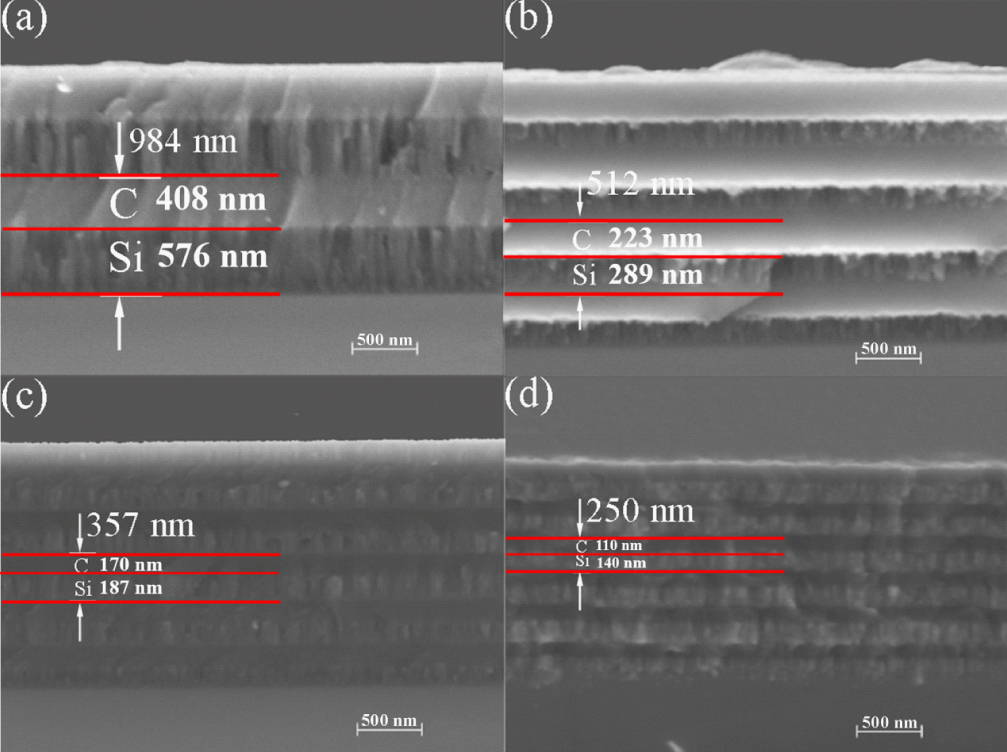
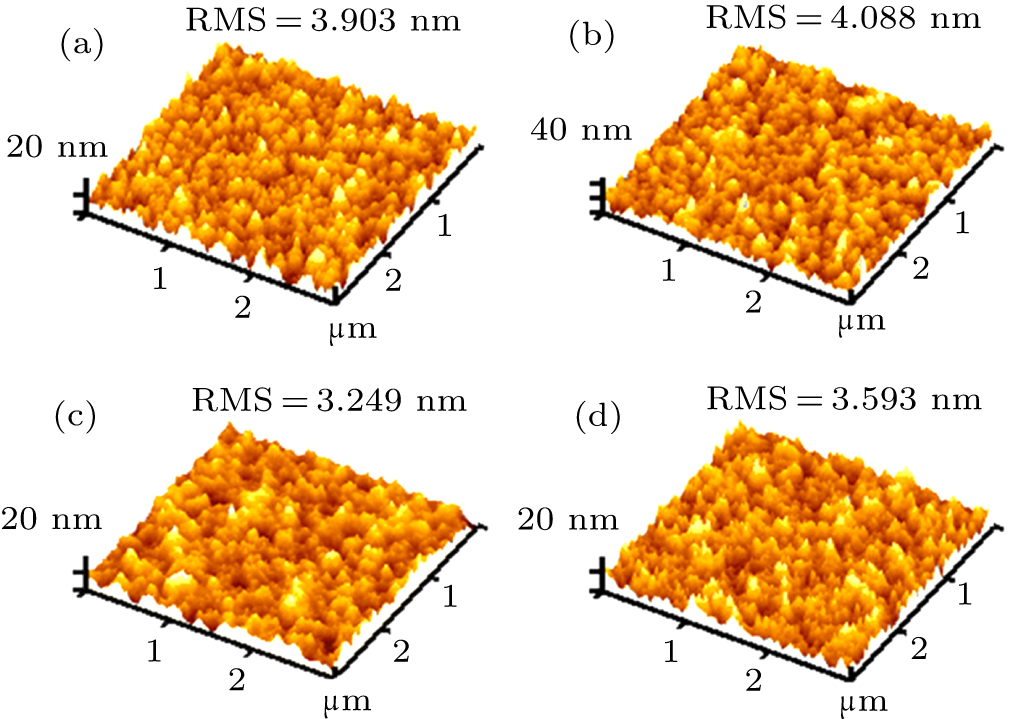
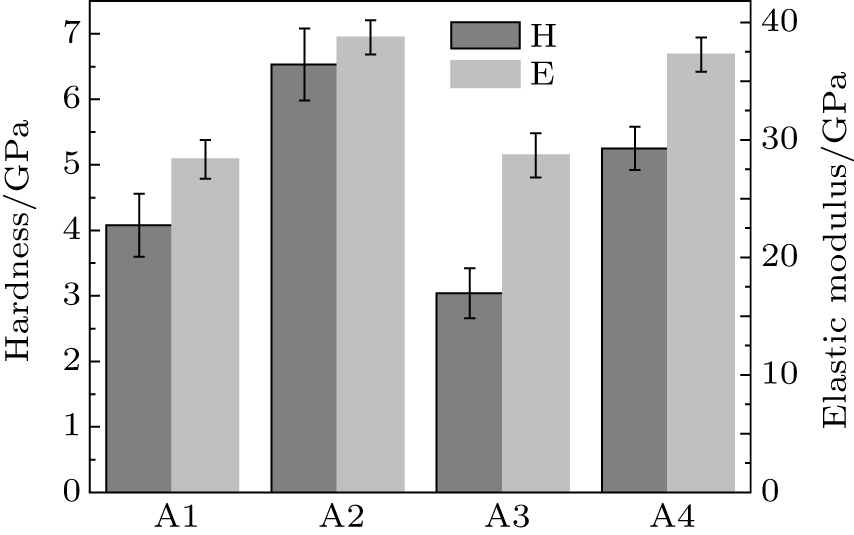
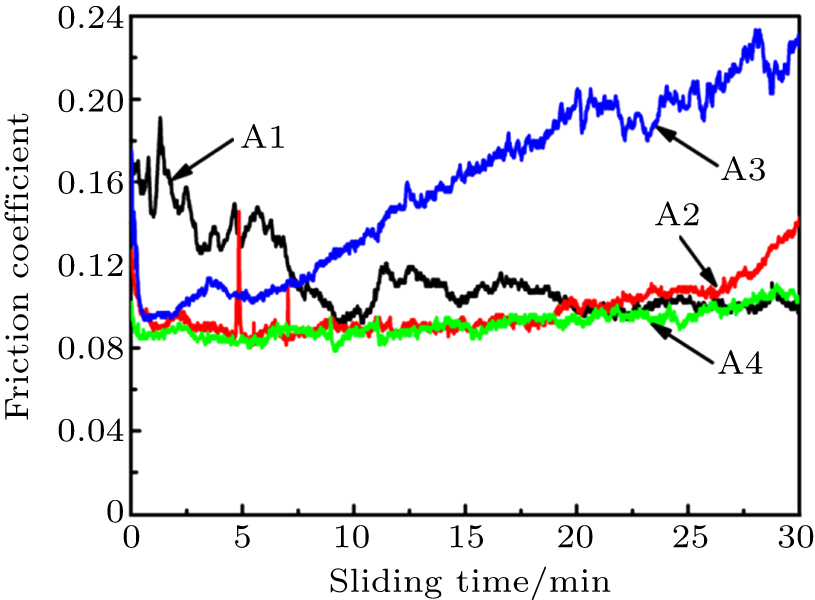
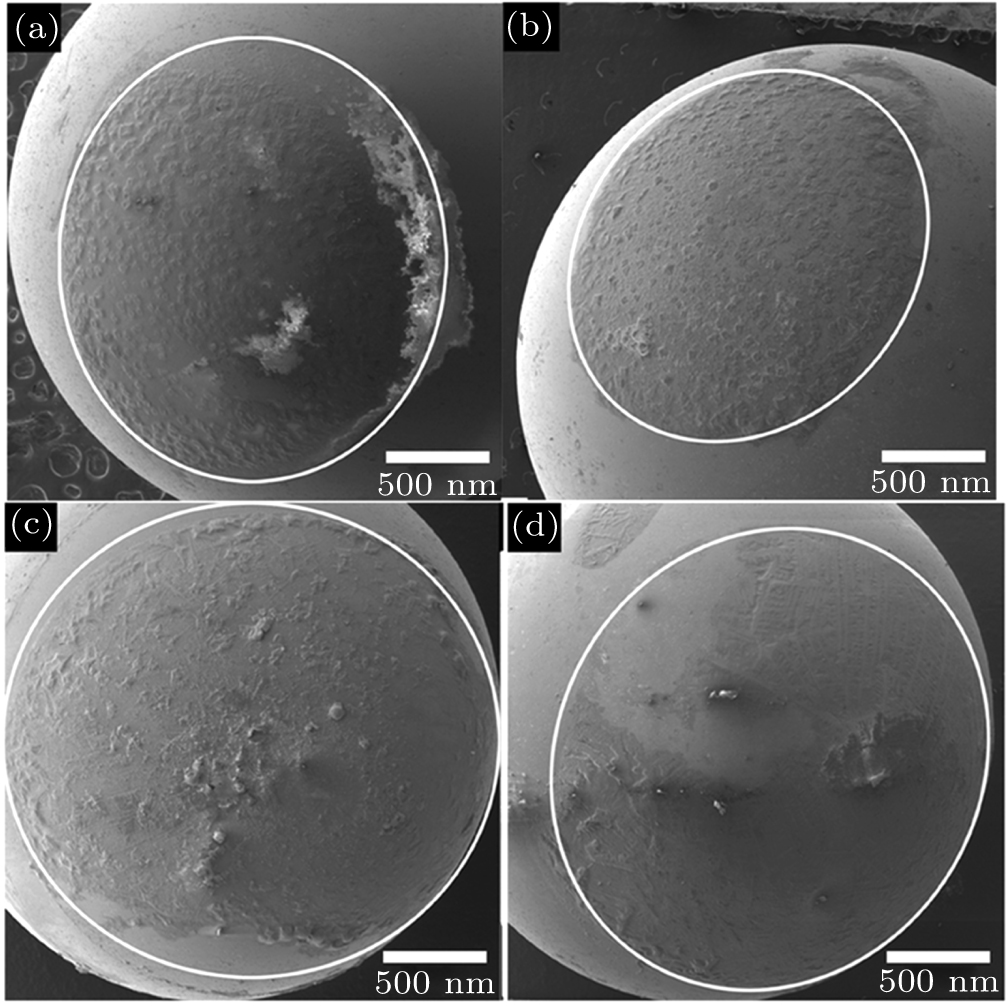
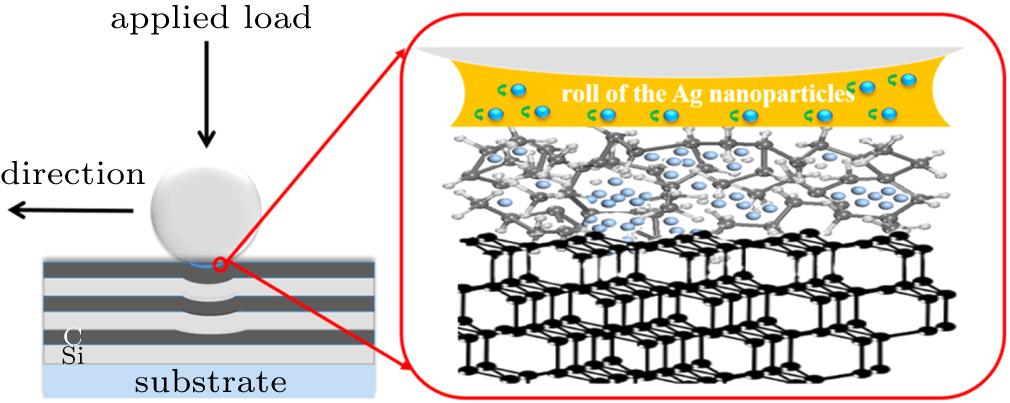
Abstract Si/a-C:H(Ag) multilayer films with different modulation periods are prepared to test their potential applications in human body. The composition, microstructure, mechanical and tribological properties in the simulated body fluid are investigated. The results show the concentration of Ag first decreases and then increases with the modulation period decreasing from 984 nm to 250 nm. Whereas the C content has an opposite variation trend. Notably, the concentration of Ag plays a more important role than the modulation period in the properties of the multilayer film. The a-C:H sublayer of the film with an appropriate Ag concentration (8.97 at.%) (modulation period of 512 nm) maintains the highest sp3/sp2 ratio, surface roughness and hardness, and excellent tribological property in the stimulated body fluid. An appropriate number of Ag atoms and size of Ag atom allow the Ag atoms to easily enter into the contact interface for load bearing and lubricating. This work proves that the Ag nanoparticles in the a-C:H sublayer plays a more important role in the tribological properties of the composite-multilayer film in stimulated body fluid condition.
|
Received: 21 April 2020
Revised: 25 May 2020
Accepted manuscript online: 12 June 2020
|
| Fund: the National Natural Science Foundation of China (Grant Nos. 51801133, 51505318, and 51671140), the Science and Technology Major Project of Shanxi Province, China (Grant No. 20181102013), the Shanxi Provincial Youth Fund, China (Grant No. 201801D221135), and the “1331 Project” Engineering Research Center of Shanxi Province, China (Grant No. PT201801). |
|
Corresponding Authors:
†Corresponding author. E-mail: yushengwang@tyut.edu.cn ‡Corresponding author. E-mail: wyc@tyut.edu.cn
|
Cite this article:
Yan-Xia Wu(吴艳霞), Yun-Lin Liu(刘云琳), Ying Liu(刘颖), Bing Zhou(周兵), Hong-Jun Hei(黑鸿君), Yong Ma(马永), Sheng-Wang Yu(于盛旺), and Yu-Cheng Wu(吴玉程) Structure and tribological properties of Si/a-C:H(Ag) multilayer film in stimulated body fluid 2020 Chin. Phys. B 29 116101
|
| [1] |
|
| [2] |
|
| [3] |
|
| [4] |
|
| [5] |
|
| [6] |
|
| [7] |
|
| [8] |
Yaremchuk I, Meskinis S, Fitio V, Bobitski Y, Slapikas K, Ciegis A, Balevicius Z, Selskis A, Tamulevicius S 2015 Nanoscale Res. Lett. 157 7 DOI: 10.1186/s11671-015-0854-y |
| [9] |
|
| [10] |
|
| [11] |
Linan Z, Yanxia W, Shujiao Z, Shengwang Y, Bin T, Ying L, Bing Z, Yanyan S 2018 J. Phys. D: Appl. Phys. 51 035302 DOI: 10.1088/1361-6463/aa9b72 |
| [12] |
Li T T, Yang T, Fang J, Zhang D K, Sun J, Wei C C, Xu S Z, Wang G C, Liu C C, Zhao Y, Zhang X D 2016 Chin. Phys. B 25 046101 DOI: 10.1088/1674-1056/25/4/046101 |
| [13] |
Wang J, Li S, Zhao Y, Shi J, Lv L, Wang H, Zhang Z, Feng W 2018 RSC Adv. 8 6660 DOI: 10.1039/C7RA12027C |
| [14] |
|
| [15] |
|
| [16] |
|
| [17] |
|
| [18] |
Chandraá Mathpal M, KumaráTripathi A, KumaráSingh M 2015 RSC Adv. 5 12555 DOI: 10.1039/C4RA14061C |
| [19] |
Manoj B, Kunjomana A 2012 Int. J. Electrochem. Sci. 7 3127
|
| [20] |
|
| [21] |
|
| [22] |
|
| [23] |
|
| [24] |
|
| [25] |
Mohsen Soltani E, Ghorannevis Z, Shirazi M 2013 Adv. Mater. Sci. Eng. 15 DOI: 10.1155/2013/142450 |
| [26] |
|
| [27] |
Tavares C, Rebouta L, Alves E, Almeida B, Sousa J B, Da Silva M, Soares J 1998 Nucl. Instrum. Methods Phys. Res. B 136 278
|
| [28] |
|
| [29] |
|
| [30] |
|
| [31] |
|
| [32] |
Holleck H, Schier 1995 Surf. Coatings Technol. 76 328
|
| [33] |
|
| [34] |
|
| [35] |
|
| [36] |
|
| [37] |
|
| [38] |
|
| No Suggested Reading articles found! |
|
|
Viewed |
|
|
|
Full text
|
|
|
|
|
Abstract
|
|
|
|
|
Cited |
|
|
|
|
Altmetric
|
|
blogs
Facebook pages
Wikipedia page
Google+ users
|
Online attention
Altmetric calculates a score based on the online attention an article receives. Each coloured thread in the circle represents a different type of online attention. The number in the centre is the Altmetric score. Social media and mainstream news media are the main sources that calculate the score. Reference managers such as Mendeley are also tracked but do not contribute to the score. Older articles often score higher because they have had more time to get noticed. To account for this, Altmetric has included the context data for other articles of a similar age.
View more on Altmetrics
|
|
|