| ELECTROMAGNETISM, OPTICS, ACOUSTICS, HEAT TRANSFER, CLASSICAL MECHANICS, AND FLUID DYNAMICS |
Prev
Next
|
|
|
Dependence of interferogram phase on incident wavenumber and phase stability of Doppler asymmetric spatial heterodyne spectroscopy |
| Ya-Fei Zhang(张亚飞)1,2, Yu-Tao Feng(冯玉涛)1,†, Di Fu(傅頔)1, Peng-Chong Wang(王鹏冲)1, Jian Sun(孙剑)1, and Qing-Lan Bai(白清兰)1 |
1 Xi’an Institute of Optics and Precision Mechanics, Chinese Academy of Sciences, Xi’an 710119, China
2 University of Chinese Academy of Sciences, Beijing 100049, China |
|
|
|
|
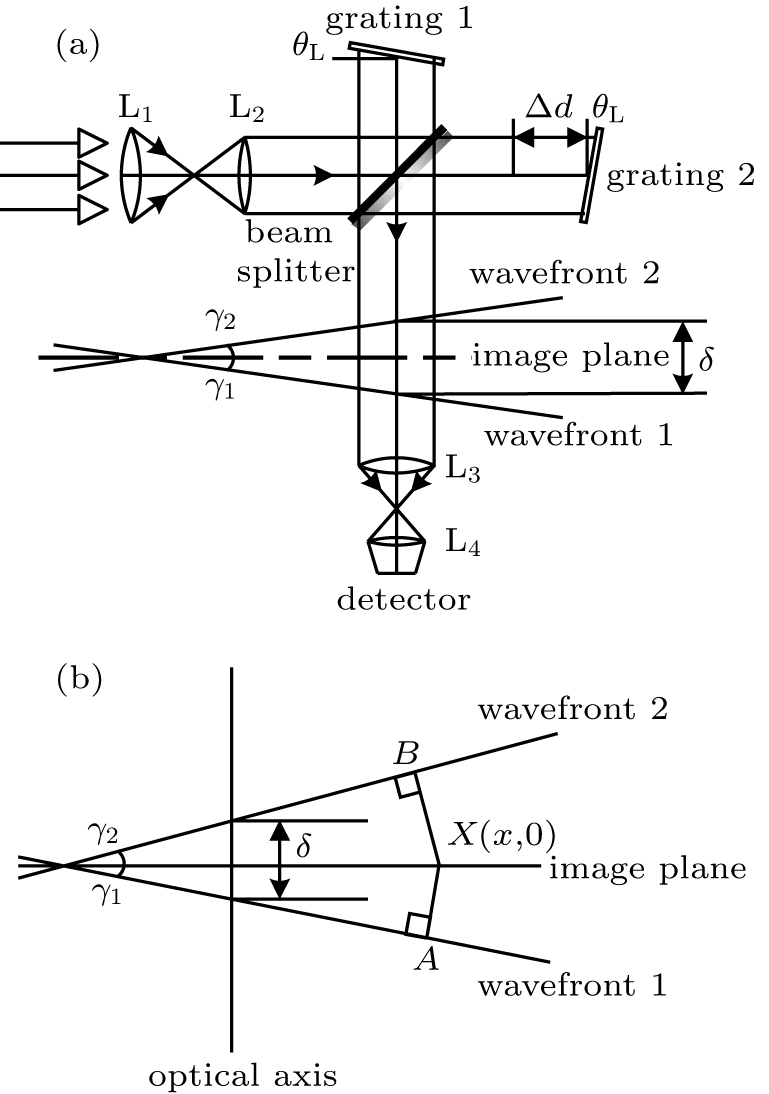
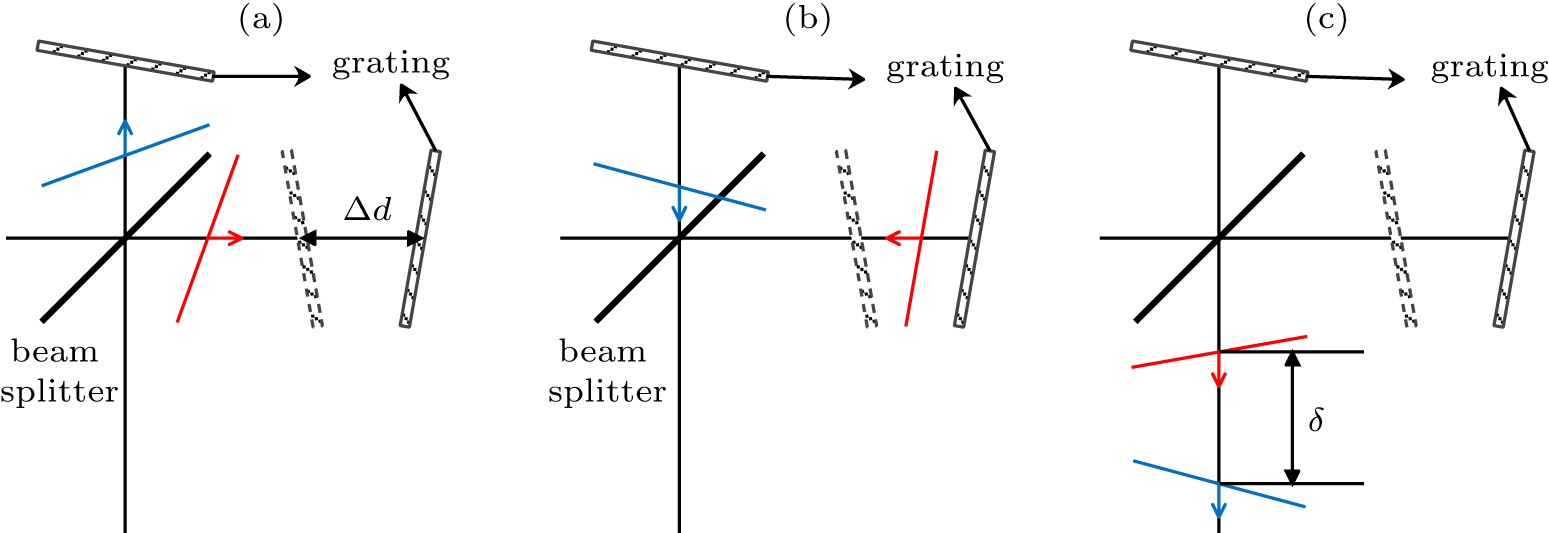
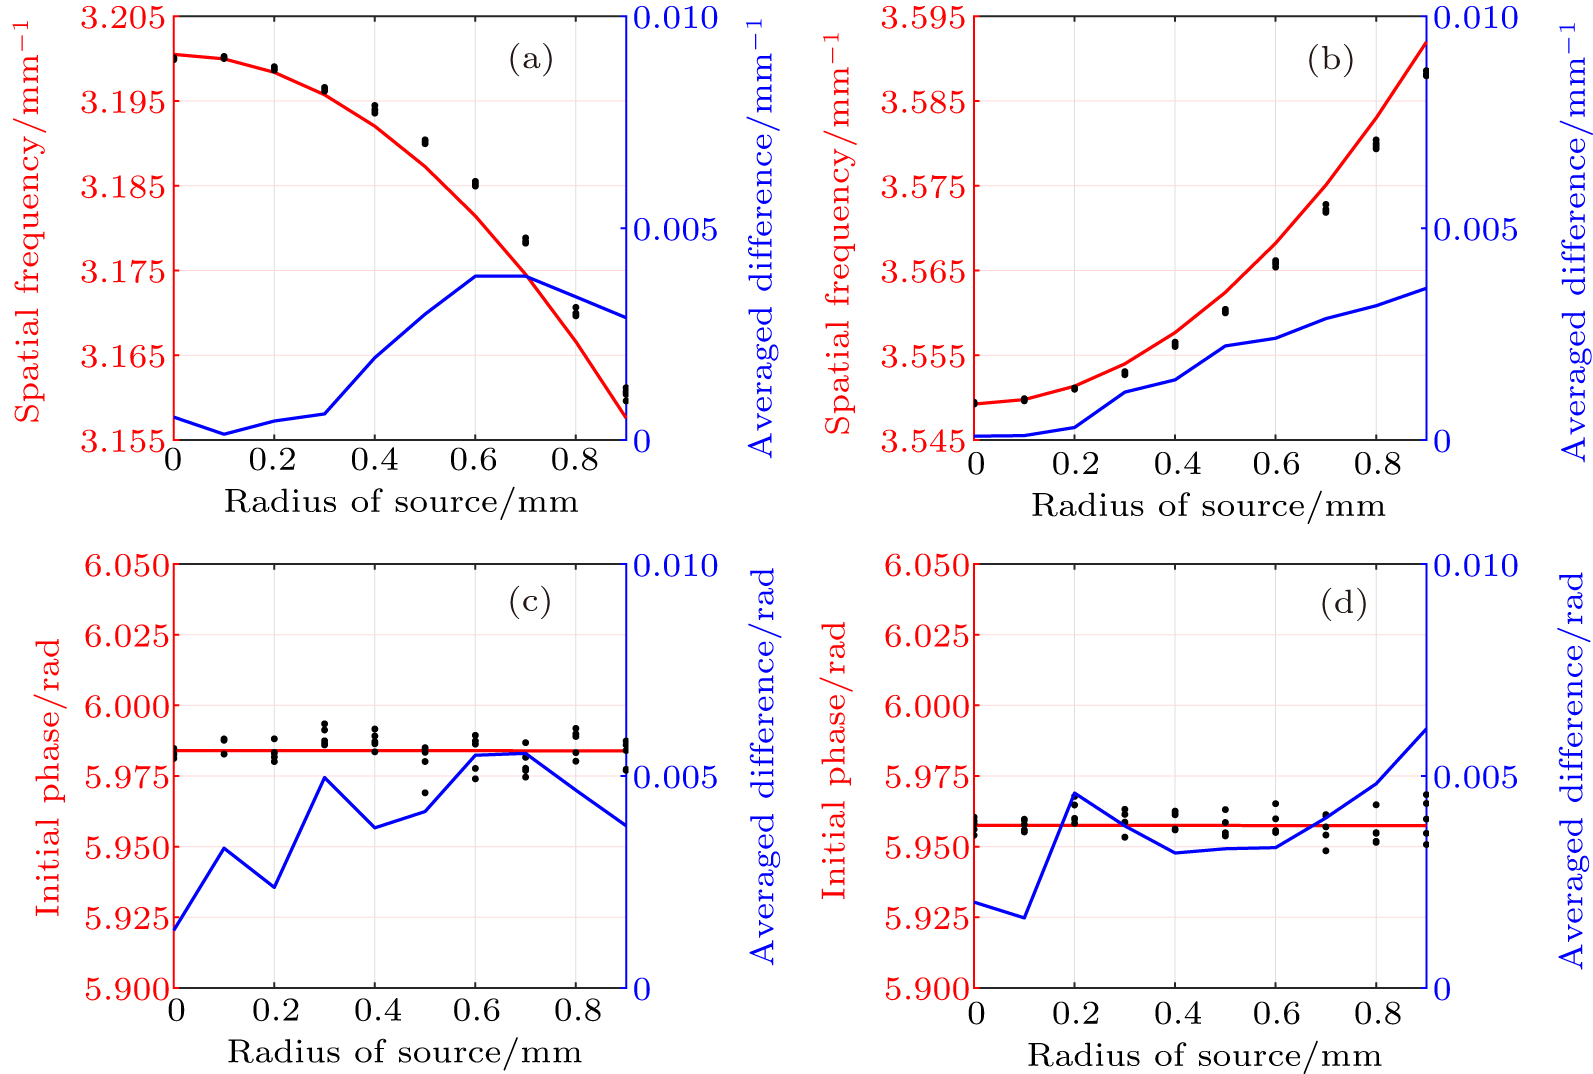
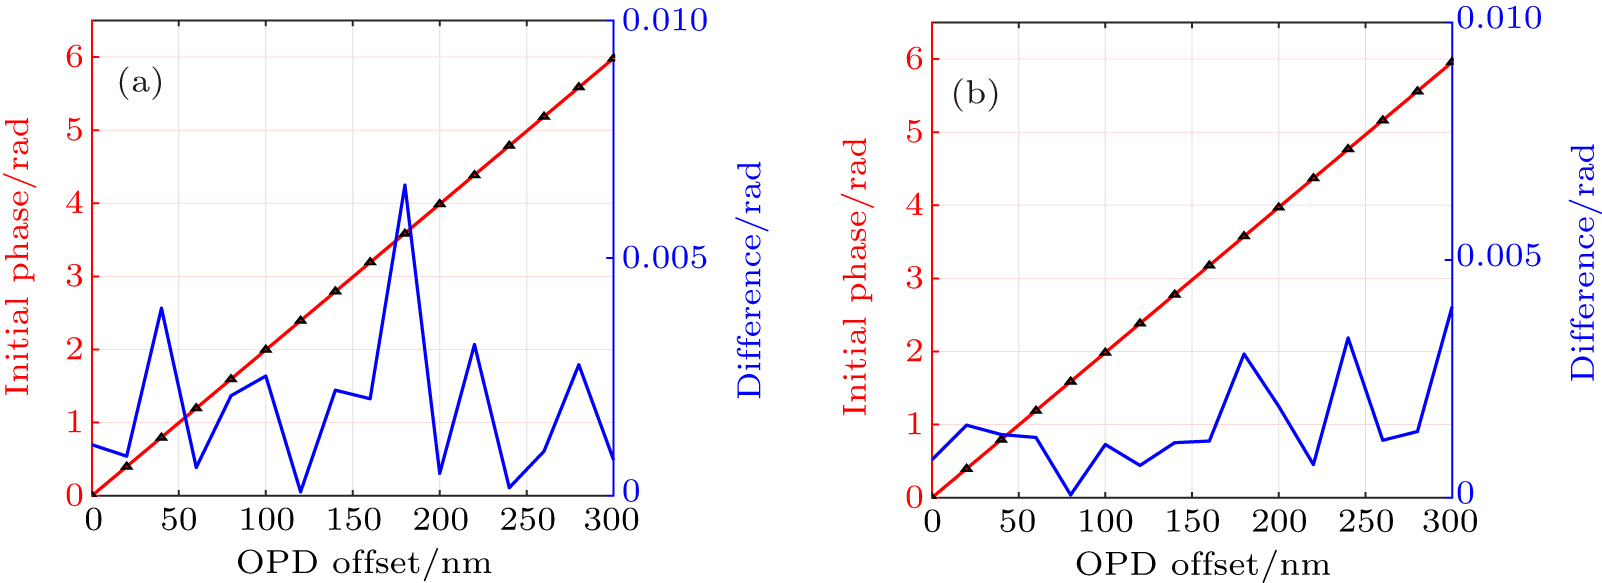
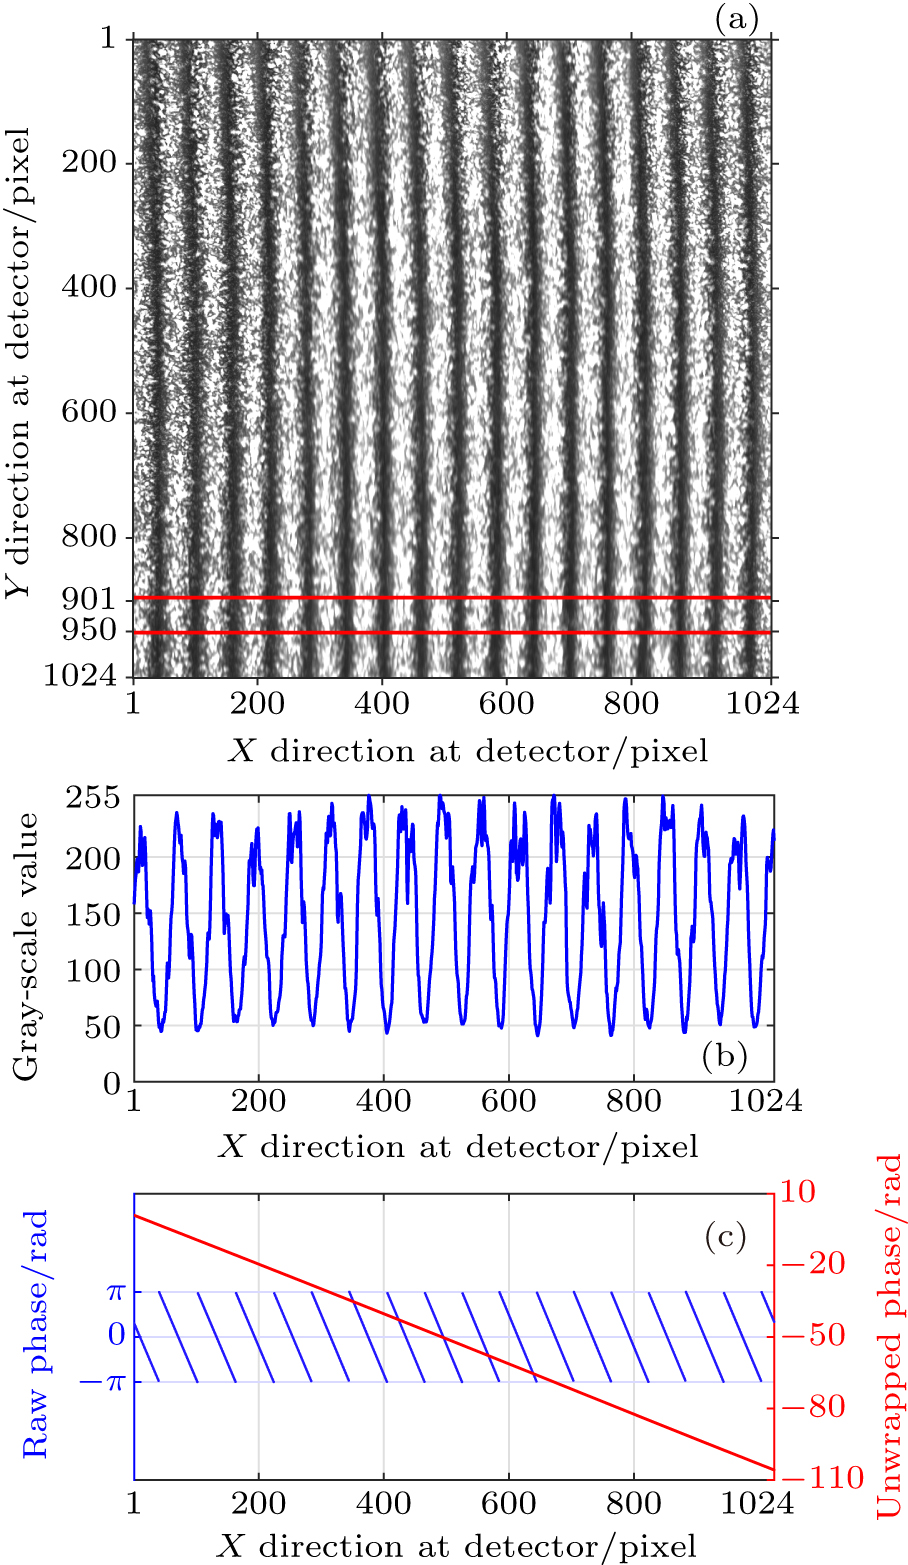
Abstract Instrument drifts introduce additional phase errors into atmospheric wind measurement of Doppler asymmetric spatial heterodyne spectroscopy (DASH). Aiming at the phase sensitivity of DASH to instrument drifts, in this paper we calculate the optical path difference (OPD) and present an accurate formula of DASH interferogram. By controlling variables in computational ray-tracing simulations and laboratory experiments, it is indicated that initial phase is directly determined by incident wavenumber, OPD offset and field of view (FOV). Accordingly, it is indicated that retrieved phase of DASH is sensitive to slight structural change caused by instrument drift, which provides the proof of necessary-to-track and -correct phase errors from instrument drifts.
|
Received: 07 January 2020
Revised: 30 April 2020
Accepted manuscript online: 18 June 2020
|
|
PACS:
|
42.25.Hz
|
(Interference)
|
| |
07.60.Ly
|
(Interferometers)
|
| |
42.68.-w
|
(Atmospheric and ocean optics)
|
|
|
Corresponding Authors:
†Corresponding author. E-mail: fytciom@126.com
|
| About author: †Corresponding author. E-mail: fytciom@126.com * Project supported by the National Natural Science Foundation of China (Grant No. 41005019), the Fund from the Chinese Academy of Scieneces for West Yong Scientists (Grant No. XAB 2016A07), and the Natural Science Basic Research Program of Shaanxi Province, China (Grant No. 2019JQ-931). |
Cite this article:
Ya-Fei Zhang(张亚飞), Yu-Tao Feng(冯玉涛)†, Di Fu(傅頔), Peng-Chong Wang(王鹏冲), Jian Sun(孙剑), and Qing-Lan Bai(白清兰) Dependence of interferogram phase on incident wavenumber and phase stability of Doppler asymmetric spatial heterodyne spectroscopy 2020 Chin. Phys. B 29 104204
|
| [1] |
|
| [2] |
|
| [3] |
|
| [4] |
Englert C R, Harlander J M, Babcock D D, Stevens M H, Siskind D E 2006 Atmospheric Optical Modeling, Measurement, and Simulation II September 1, 2006. San Diego, California, USA 63030T DOI: 10.1117/12.681704 |
| [5] |
|
| [6] |
Englert C R, Brown C M, Bach B, Bach E, Bach K, Harlander J M, Seely J F, Marr K D, Miller I 2017 Appl. Opt. 56 2090 DOI: 10.1364/AO.56.002090 |
| [7] |
Englert C R, Harlander J M, Emmert J T, Babcock D D, Roesler F L 2010 Opt. Express 18 27416 DOI: 10.1364/OE.18.027416 |
| [8] |
Englert C R, Harlander J M, Brown C M, Marr K D, Miller I J, Stump J E, Hancock J, Peterson J Q, Kumler J, Morrow W H, Mooney T A, Ellis S, Mende S B, Harris S E, Stevens M H, Makela J J, Harding B J, Immel T J 2017 Space Sci. Rev. 212 553 DOI: 10.1007/s11214-017-0358-4 |
| [9] |
|
| [10] |
Liu J, Wei D, Zhu Y, Kaufmann M, Olschewski F, Mantel K, Xu J, Riese M 2018 Appl. Opt. 57 8829 DOI: 10.1364/AO.57.008829 |
| [11] |
Perklins C 2013 Spatial heterodyne spectroscopy: modeling and interferogram processing MS Dissertation Rochester Rochester Institute of Technology
|
| [12] |
Harlander J M 1991 Spatial heterodyne spectroscopy: Interferometric performance at any wavelength without scanning Ph.D. dissertation Wisconsin The University of Wisconsin-Madison
|
| [13] |
Harlander J M, Englert C R, Marr K D, Harding B J, Chu K T 2019 Appl. Opt. 58 3613 DOI: 10.1364/AO.58.003613 |
| [14] |
Thuillier G, Gault W, Brun J F, Hersé M, Ward W, Hersom C 1998 Appl. Opt. 37 1356 DOI: 10.1364/AO.37.001356 |
| [15] |
|
| No Suggested Reading articles found! |
|
|
Viewed |
|
|
|
Full text
|
|
|
|
|
Abstract
|
|
|
|
|
Cited |
|
|
|
|
Altmetric
|
|
blogs
Facebook pages
Wikipedia page
Google+ users
|
Online attention
Altmetric calculates a score based on the online attention an article receives. Each coloured thread in the circle represents a different type of online attention. The number in the centre is the Altmetric score. Social media and mainstream news media are the main sources that calculate the score. Reference managers such as Mendeley are also tracked but do not contribute to the score. Older articles often score higher because they have had more time to get noticed. To account for this, Altmetric has included the context data for other articles of a similar age.
View more on Altmetrics
|
|
|