|
|
|
An efficient inverse approach for reconstructing time- and space-dependent heat flux of participating medium |
| Shuang-Cheng Sun(孙双成)1,2, †, Guang-Jun Wang(王广军)1,2, and Hong Chen(陈红)1,2$ |
1 School of Energy and Power Engineering, Chongqing University, Chongqing 400044, China
2 Key Laboratory of Low-grade Energy Utilization Technologies and Systems, Ministry of Education, Chongqing University, Chongqing 400044, China |
|
|
|
|
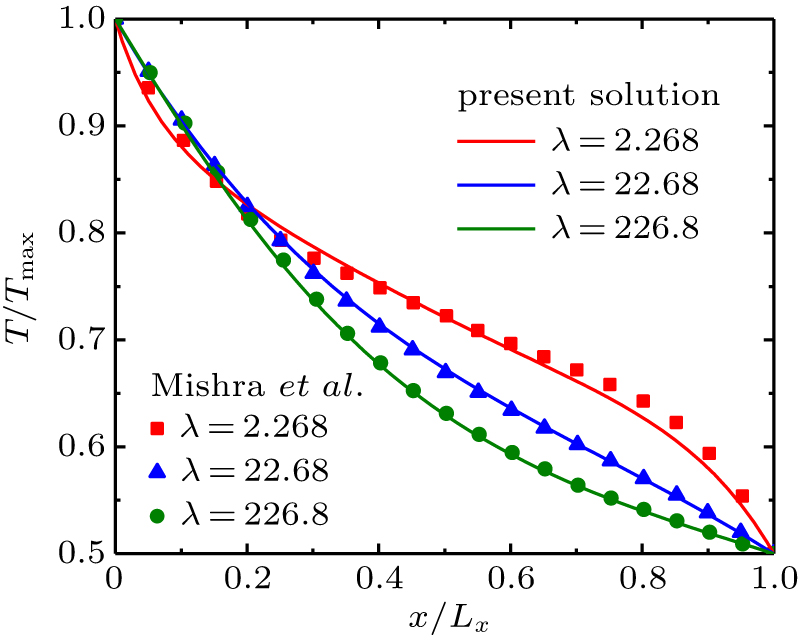
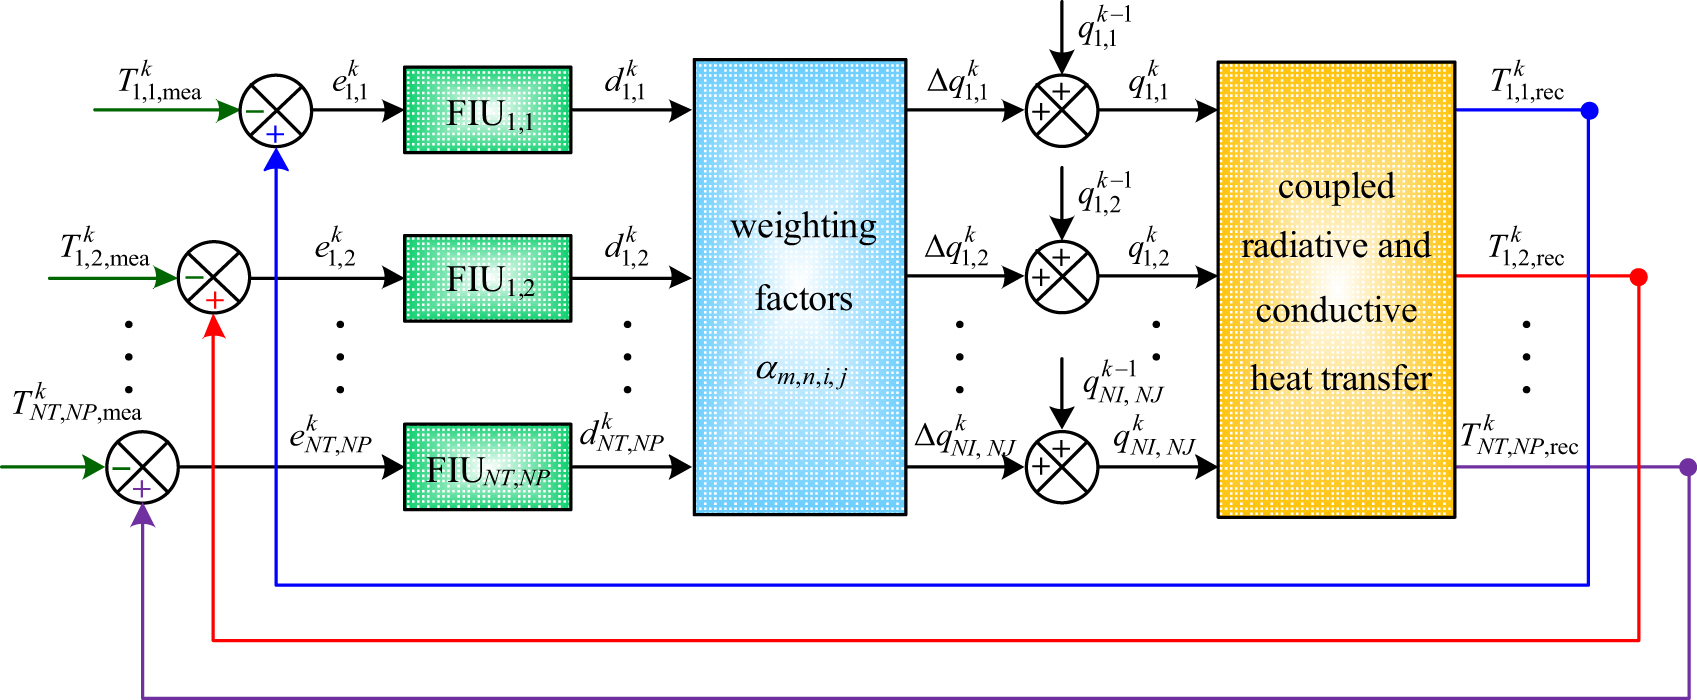
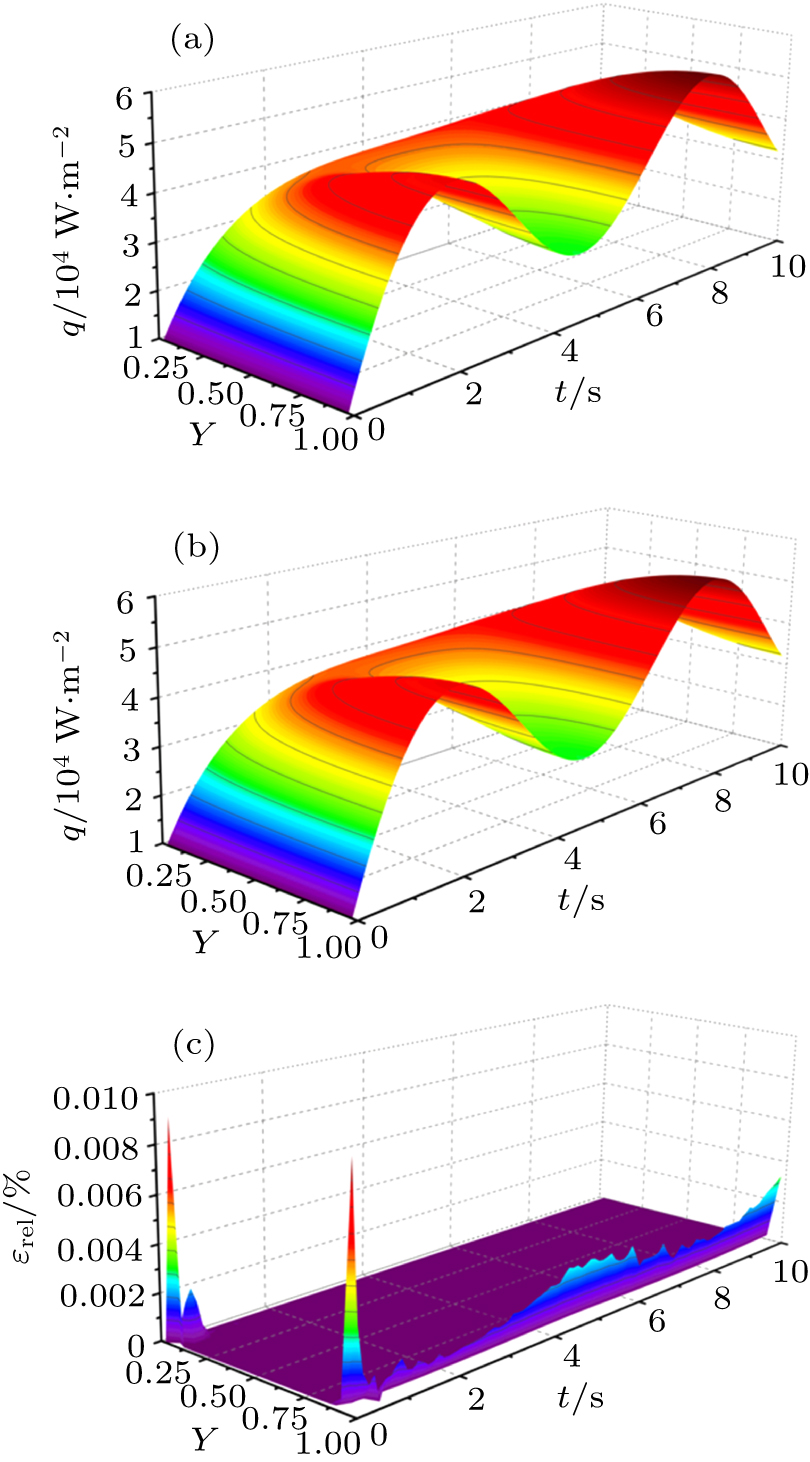
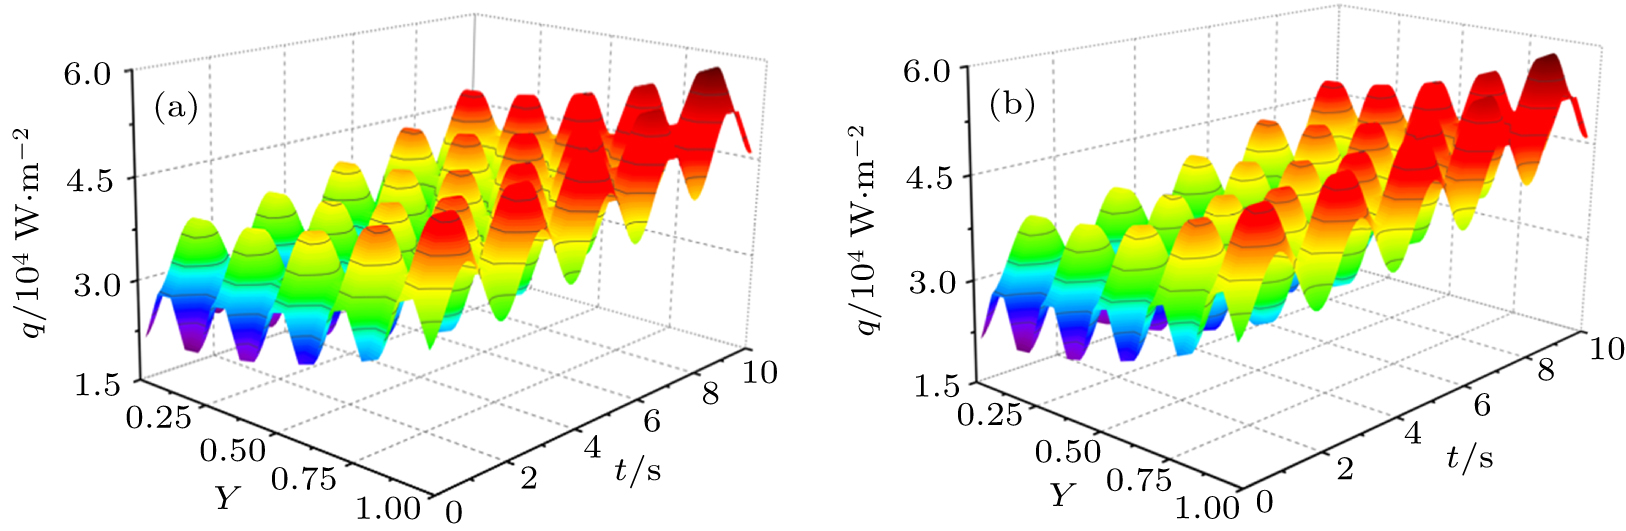
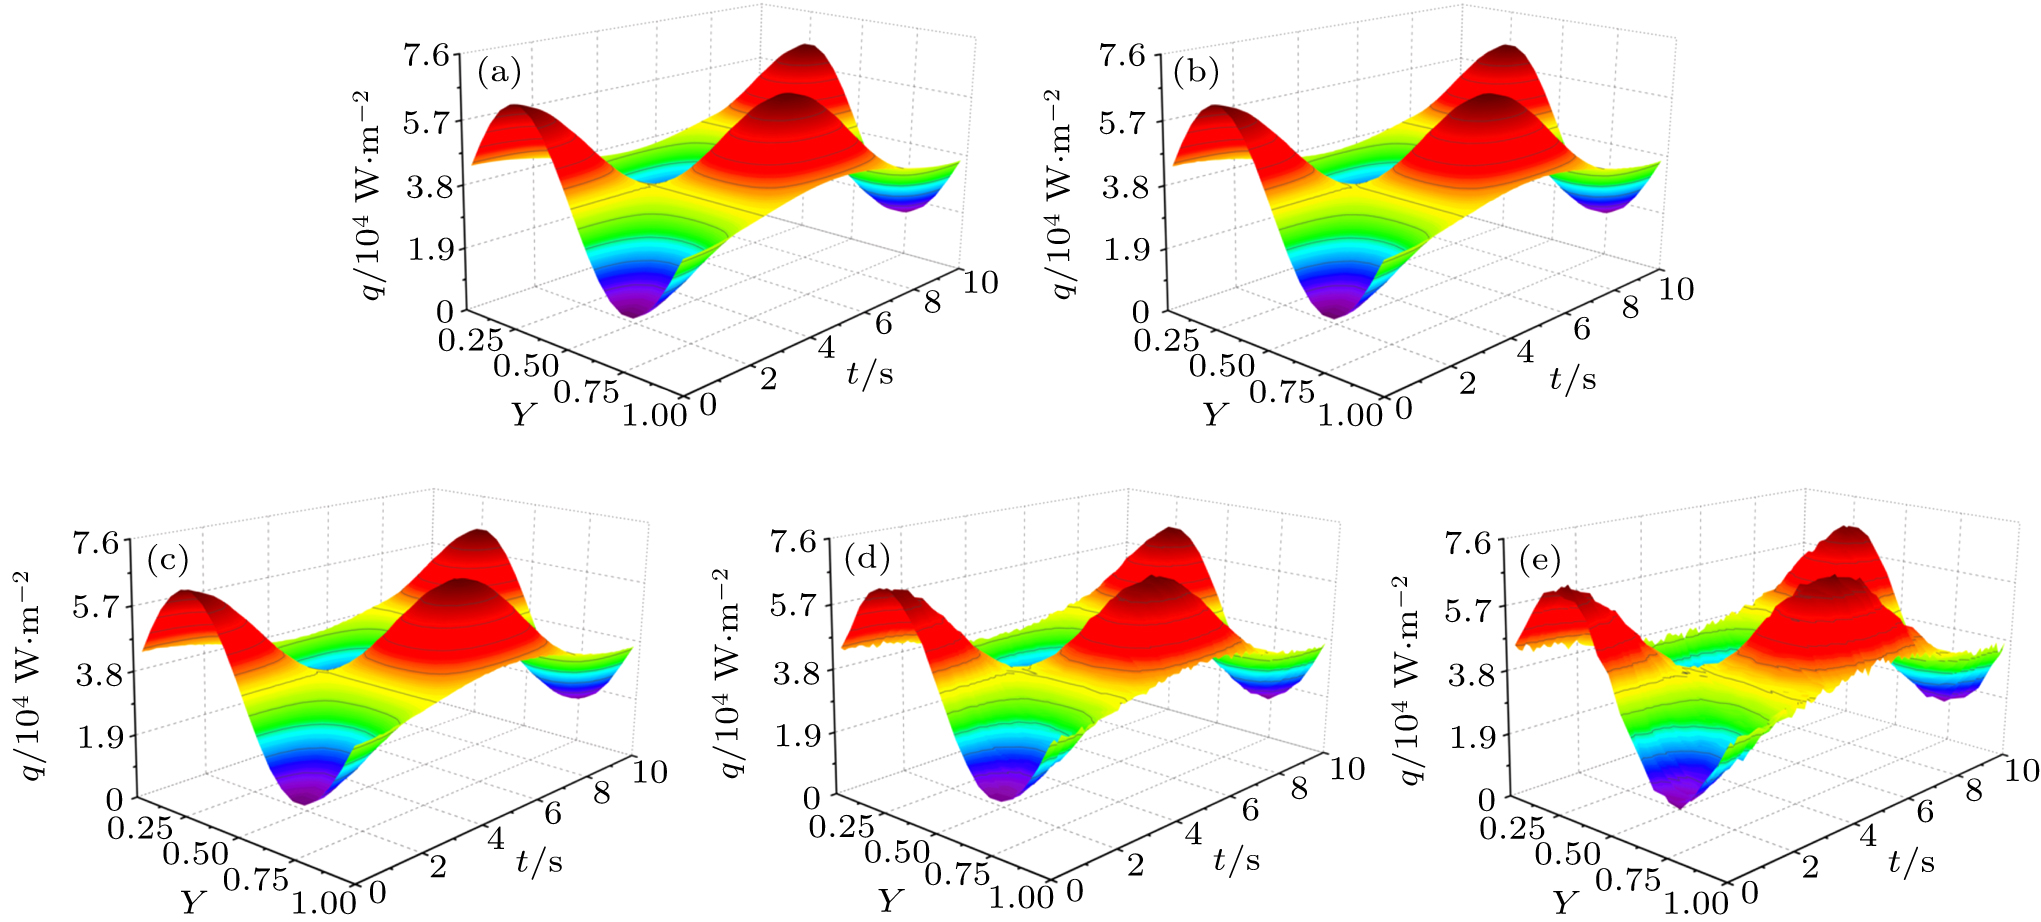
Abstract The decentralized fuzzy inference method (DFIM) is employed as an optimization technique to reconstruct time- and space-dependent heat flux of two-dimensional (2D) participating medium. The forward coupled radiative and conductive heat transfer problem is solved by a combination of finite volume method and discrete ordinate method. The reconstruction task is formulated as an inverse problem, and the DFIM is used to reconstruct the unknown heat flux. No prior information on the heat flux distribution is required for the inverse analysis. All retrieval results illustrate that the time- and space-dependent heat flux of participating medium can be exactly recovered by the DFIM. The present method is proved to be more efficient and accurate than other optimization techniques. The effects of heat flux form, initial guess, medium property, and measurement error on reconstruction results are investigated. Simulated results indicate that the DFIM is robust to reconstruct different kinds of heat fluxes even with noisy data.
|
Received: 04 May 2020
Revised: 26 May 2020
Accepted manuscript online: 15 July 2020
|
| Fund: the Natural Science Foundation of Chongqing (CSTC, Grant No. 2019JCYJ-MSXMX0441). |
|
Corresponding Authors:
†Corresponding author. E-mail: scsun@cqu.edu.cn
|
Cite this article:
Shuang-Cheng Sun(孙双成), Guang-Jun Wang(王广军), and Hong Chen(陈红)$ An efficient inverse approach for reconstructing time- and space-dependent heat flux of participating medium 2020 Chin. Phys. B 29 110202
|
| [1] |
|
| [2] |
|
| [3] |
|
| [4] |
|
| [5] |
|
| [6] |
|
| [7] |
|
| [8] |
Yadav V, Singh A K, Dixit U S 2015 Int. J. Mech. Sci. 96–97 182
|
| [9] |
|
| [10] |
|
| [11] |
Bose D, White T, Mahzari M, Edquist K 2014 J. Spacecr. Rockets 51 1174 DOI: 10.2514/1.A32783 |
| [12] |
Yan B, Huang S X, Feng J 2018 Acta Phys. Sin. 67 199201 in Chinese
|
| [13] |
|
| [14] |
Gifford A R, Hubble D O, Pullins C A, Diller T E, Huxtable S T 2010 J. Thermophys. Heat Transfer 24 69 DOI: 10.2514/1.42298 |
| [15] |
Ozisik M N, Orlande H R B 2000 Inverse heat transfer New York Taylor & Francis
|
| [16] |
|
| [17] |
|
| [18] |
|
| [19] |
|
| [20] |
Qi H, Sun S C, He Z Z, Ruan S T, Ruan L M, Tan H P 2016 Inverse geometry design of radiative enclosures using particle swarm optimization algorithms Rijeka InTechOpen
|
| [21] |
Qi H, Zhao F Z, Ren Y T, Qiao Y B, Wei L Y, Sadaf A I, Ruan L M 2018 J. Quant. Spectrosc. Radiat. Transfer 222–223 1
|
| [22] |
Li B H, Lu M 2015 J. Univ. Shanghai Sci. Technol. 37 225
|
| [23] |
|
| [24] |
|
| [25] |
|
| [26] |
|
| [27] |
|
| [28] |
|
| [29] |
|
| [30] |
|
| [31] |
|
| [32] |
Zhu Y H, Liu B, Jiang P X, Fu T R, Lei Y T 2017 J. Thermophys. Heat Transfer 31 205 DOI: 10.2514/1.T4877 |
| [33] |
|
| [34] |
|
| [35] |
|
| [36] |
|
| [37] |
|
| [38] |
|
| [39] |
Modest M F 2003 Radiative heat transfer 2 New York McGraw-Hill
|
| [40] |
|
| [41] |
|
| [42] |
|
| No Suggested Reading articles found! |
|
|
Viewed |
|
|
|
Full text
|
|
|
|
|
Abstract
|
|
|
|
|
Cited |
|
|
|
|
Altmetric
|
|
blogs
Facebook pages
Wikipedia page
Google+ users
|
Online attention
Altmetric calculates a score based on the online attention an article receives. Each coloured thread in the circle represents a different type of online attention. The number in the centre is the Altmetric score. Social media and mainstream news media are the main sources that calculate the score. Reference managers such as Mendeley are also tracked but do not contribute to the score. Older articles often score higher because they have had more time to get noticed. To account for this, Altmetric has included the context data for other articles of a similar age.
View more on Altmetrics
|
|
|