


Simulation of positron backscattering and implantation profiles using Geant4 code
[Huang Shi-Juana), b) , Pan Zi-Wena), b) , Liu Jian-Danga), b) , Han Rong-Diana), b) , Ye Bang-Jiao†a), b)  ]
]
]
|
|


†Corresponding author. E-mail: bjye@ustc.edu.cn
*Project supported by the National Natural Science Foundation of China (Grant Nos. 11175171 and 11105139).
For the proper interpretation of the experimental data produced in slow positron beam technique, the positron implantation properties are studied carefully using the latest Geant4 code. The simulated backscattering coefficients, the implantation profiles, and the median implantation depths for mono-energetic positrons with energy range from 1 keV to 50 keV normally incident on different crystals are reported. Compared with the previous experimental results, our simulation backscattering coefficients are in reasonable agreement, and we think that the accuracy may be related to the structures of the host materials in the Geant4 code. Based on the reasonable simulated backscattering coefficients, the adjustable parameters of the implantation profiles which are dependent on materials and implantation energies are obtained. The most important point is that we calculate the positron backscattering coefficients and median implantation depths in amorphous polymers for the first time and our simulations are in fairly good agreement with the previous experimental results.
In recent decades, the positron annihilation technique[1] has been a powerful tool that has been applied for the characterization of defects of materials due to its nondestruction and high sensitivity at the atomic level. The slow positron beam technique can provide depth-resolved information by implanting mono-energetic positrons of energies in the range from a few hundreds of eV to dozens of keV into the samples. The mean implantation depth increases with the increase of energy. Therefore, it is widely used to investigate inhomogeneously distributed defect concentrations in crystalline materials and to study the properties of thin films, surfaces, and interfaces of layered materials.[1– 4]
We need a detailed knowledge of the depth distribution of positrons in order to analyze the low-energy positron beam experimental data. Two separate parts must be considered, one is the modeling of the thermalization or implantation of the positrons, which can be slowed down to near-thermal energies after a few picoseconds in a material, and the other one is the modeling of the diffusion and subsequent annihilation of the thermalized positrons.[2– 5] The depth distribution of the thermalized positrons before diffusion is called the implantation or stopping profile. The depth distribution due to diffusion can be obtained by solving the steady-state diffusion equation using the positron implantation profile as a source term. Software has already been developed for diffusion analyses, the most widely used is the VEPFIT program.[6– 8] The VEPFIT program is based on the Makhovian distribution, which is derived from firstly fitting the Monte Carlo results.[9]
The Makhovian profile
where z denotes the distance from the surface of the material in the direction of the incoming beam. m, A, and n are adjustable parameters to fit the data, ρ is the density of the host material, and Γ is the gamma function. In general, m = 2.0, n = 1.6, A = 4.0 (μ g/cm2)/keV1.6 are adopted, though they are believed to be a function of both the atomic number Z of the material and the incident positron energy E. To reveal and verify this power law, many experiments and Monte Carlo simulations have been done. Mills and Wilson[10] measured the transmission of positrons through thin films for the first time. In the following few years, the Monte Carlo schemes of Valkealahti and Nieminen (VN), [9, 11] Jensen and Walker (JW), [12, 13] McKeown et al. (BNL), [14] Ritley et al.[15] were developed. The discrepancy among them mainly comes from the difference of the cross section, the mean free path, the energy loss function, the polar scattering angle, and they are suitable over different energy ranges. The calculations based on the PENELOPE, [16] POS-SPRITE, [17] EGSnrc4.0, [18] and Geant4, [19] programs were also done. Baker, Coleman, Makinen, et al.[20– 24] measured the backscattering coefficients and implantation profiles of the positrons in elemental metals, and Algers et al.[25] and Palacio et al.[26] measured the implantation depths of the positrons in polymers. Almost all of them indicate that the fitting parameters of the backscattering coefficients and the implantation profiles are not fixed constants and are dependent on the materials.
It is necessary to point out that the direct measurement of the implantation profiles is very difficult, so far all of these profiles are indirectly obtained from the fitting data which are derived from the positron lifetime spectroscopy or the Doppler broadening spectroscopy.[21, 22, 25, 26] In fact, positrons backscattered from the target into the vacuum may return to the sample, while the positrons implanted into the substrate may diffuse into the overlays. These uncontrolled factors lead to the low statistical accuracy of the measured profiles. In the low energy region, their influence could be larger. Therefore, developing simple theoretical calculations or computer simulations is essential. Geant4[27] is a very strong toolkit that is dedicated to accurate and comprehensive simulations of the passage of particles through matter over a wide energy range. The atomic data used in this software are extracted from a set of publicly distributed evaluated data libraries. In the latest version, some favorable improvements have been implemented.[28] While the backscattering coefficients can be measured easily and correctly, it is feasible to analyze the implantation profiles based on the fact that the simulated backscattering coefficients are in good agreement with the experimental data.
The normal incident mono-energetic positrons first slow down to the thermal energy through scattering elastically and inelastically in materials, they then diffuse, and they finally annihilate with random electrons. In this paper, we only focus on the first process; that is, the implantation process.
In the first process, positrons interact with the host material through the following ways: the elastic scattering with the nuclei, the inelastic scattering with the electrons, and radiation at high energy. Corresponding to them, we carefully choose five models to simulate the thermalization process in the latest Geant4 (Release 10.1). G4Goud-smit-Saunder-son-Msc-Model[29, 30] is app-li-ca-ble only for electrons and positrons and is fully based on the same theory as Penelop and EGSnrc, we use it to handle the elastic scattering process. G4Pe-ne-lo-pe-Ioni-sa-tion-Model is used to handle ionization and energy loss, G4Pe-ne-lo-pe-Bremss-trah-lung-Model, G4SynchrotronRadiationModel, and G4Po-si-tron-Nuc-lear-Pro-cess are also included for high energy. The G4Pe-ne-lo-peXXX models are inherited from the PENELOPE code, [16] which is specially used to simulate the interaction between low energy electrons or positrons and materials, and is valid for energies down to a few hundred eV. The cut value is set to 1 nm and the minimum energy is 20 eV. The path length traveled by the positron between 20 eV and near-thermal energies(a few meV) is insignificant compared to the implantation depths. Otherwise, the second particles’ interaction is not considered, because we only need the information of the primary particle.
Our simulations are performed for many elemental metals, semiconductors, and polymers. Figure 1 shows the schematic diagram, taking Al as an example. The thickness of each kind of material is set to the order of centimeter, which is far greater than its corresponding positron implantation depth. The implantation positron energies are varied from 1 keV to 50 keV. There is no gap between the incident positron and the material at the beginning. We select the incident energy, and then the energy loss and position change are determined through the five procedures mentioned above. We record the position of the positron when it is slowed down to near zero energy. For the backscattered positrons, their energies are usually high, so we do not record them. The trajectories of 105 particles implanting normally to the entrance surface are studied. It must be pointed out that the detailed crystal structure of the host material has not been implemented in Geant4, so the crystal effects such as channeling are not modeled, although they may strongly affect the results for some kinds of crystals, we will discuss this in more detail in the following.
 | Fig. 1. The schematic diagram, taking Al as an example. The blue points denote the end positions of the positrons. |
The backscattering coefficient is the most accurate quantity for a direct comparison of Monte Carlo simulations of a keV electron and positron slowing down in solids and experimental data. Firstly, we investigate the backscattering coefficients of the elemental crystals including bellium and actinium with atomic numbers ranging from 4 to 89 over the energy range 1 keV– 50 keV.
3.1.1. Al, Cu, Ag, and Au
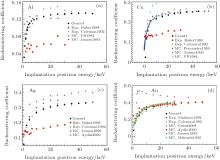
The backscattering coefficients of Al, Cu, Ag, and Au against implantation positron energy have been widely studied previously. In Fig. 2, we make a comparison of our Monte Carlo results and other simulated and experimental data. The backscattering coefficients increase with the increase of implantation positron energy in the low energy region and they then saturate. Our simulated results for these four crystals are all in very good agreement with the experimental data reported by Coleman et al.[23] The experimental data points of Al, Cu, and Ag reported by Baker et al.[20] are slightly smaller than the others. The Monte Carlo results for Cu reported by Valkealahti and Nieminen[11] are clearly bigger than the others when the implantation energy is above 5 keV. The Monte Carlo results of Ag reported by Aydin[31] are systematically large compared with our simulations and those of others. There is a great difference between the Monte Carlo results of Au reported by Dryzek and Horodek[19] and those of others.
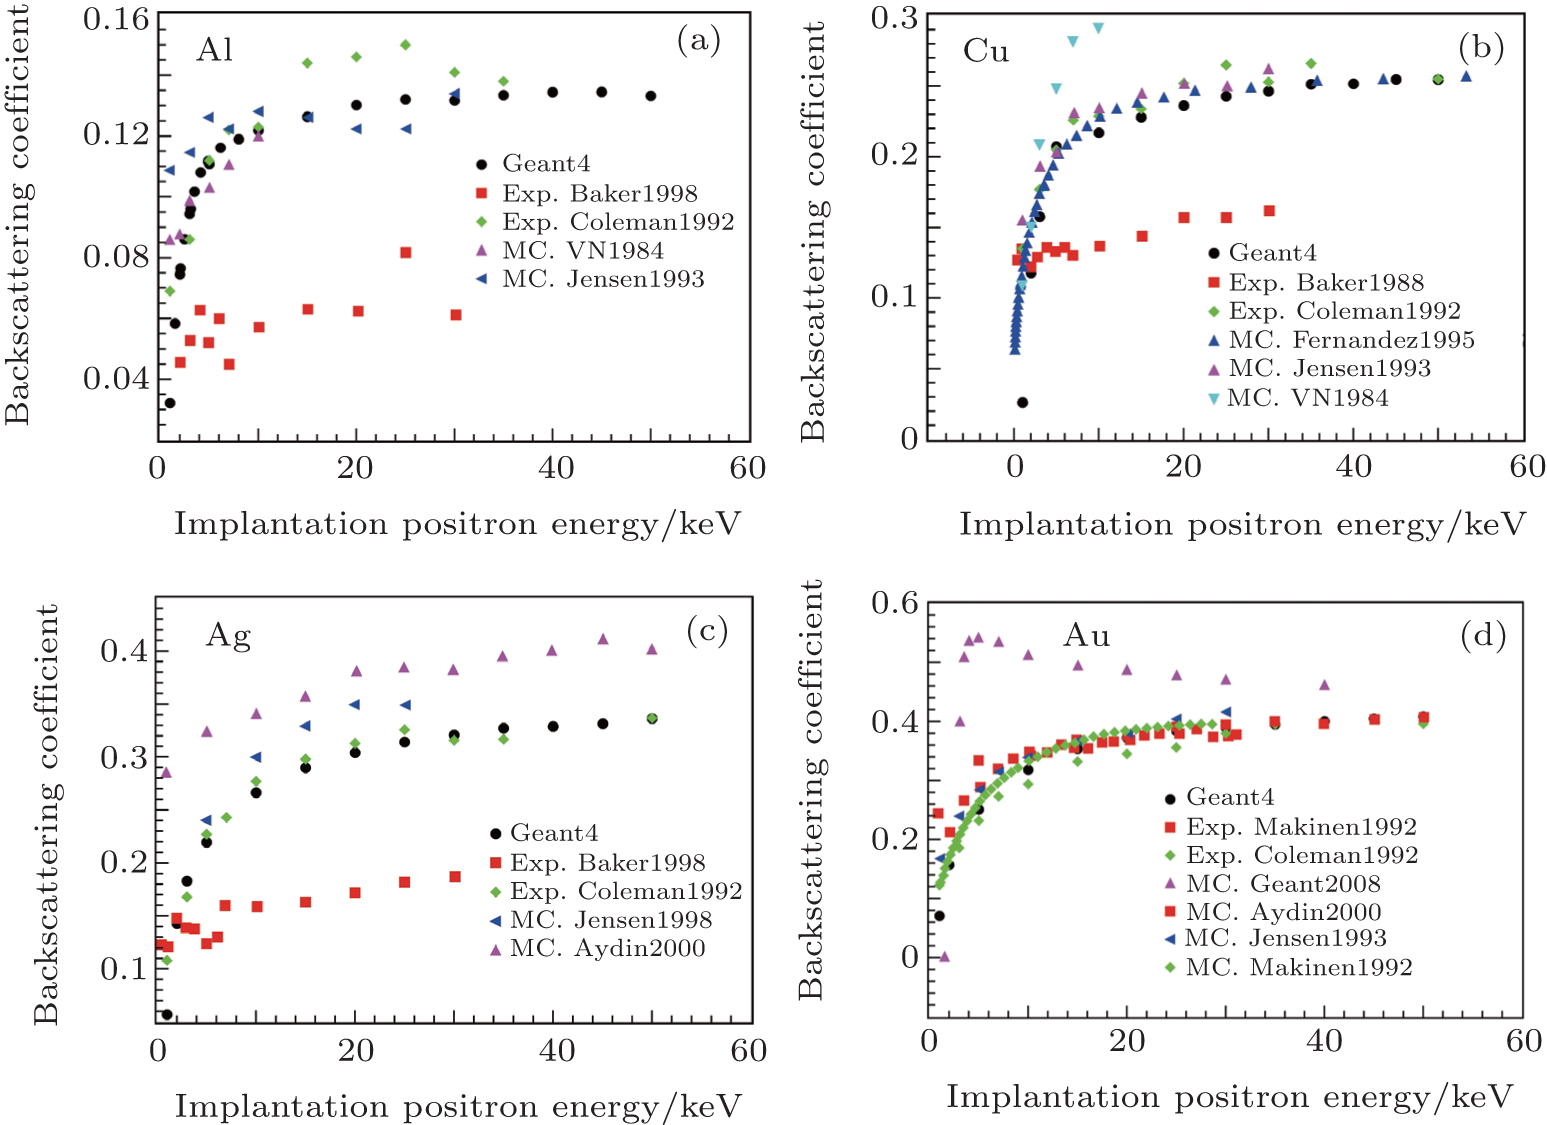 | Fig. 2. The backscattering coefficients versus incident positron energy for Al (a); for Cu (b); for Ag (c); for Au (d). Our simulation results (Geant4), Exp. Baker1988 (Ref. [20]), Exp. Coleman1992 (Ref. [23]), MC. VN1984 (Ref. [11]), MC. Jensen1993 (Ref. [13]), MC. Fernandez1995 (Ref. [32]), MC. Aydin2000 (Ref. [31]), MC. Jensen1990 (Ref. [12]), MC. Geant2008 (Ref. [19]), MC. Makinen1992 and Exp. Makinen1992 (Ref. [24]). |
3.1.2. Be and Zn
In Fig. 3, the backscattering coefficients of Be and Zn versus incident positron energy are presented. Our calculation of Zn seems to be consistent with the experimental data reported by Coleman et al.[23] For the case of Be, the Monte Carlo results reported by Coleman et al.[23] and Jensen et al.[13] are almost identical. According to our best knowledge, there are very few experimental data points of the backscattering coefficients of Be up to now. Although there is only one data point of the backscattering coefficient of Be measured by Massoumi et al.[33] at 35 keV, it seems to be much closer to our calculations than the other two. For further comparison, more experiments need to be done.
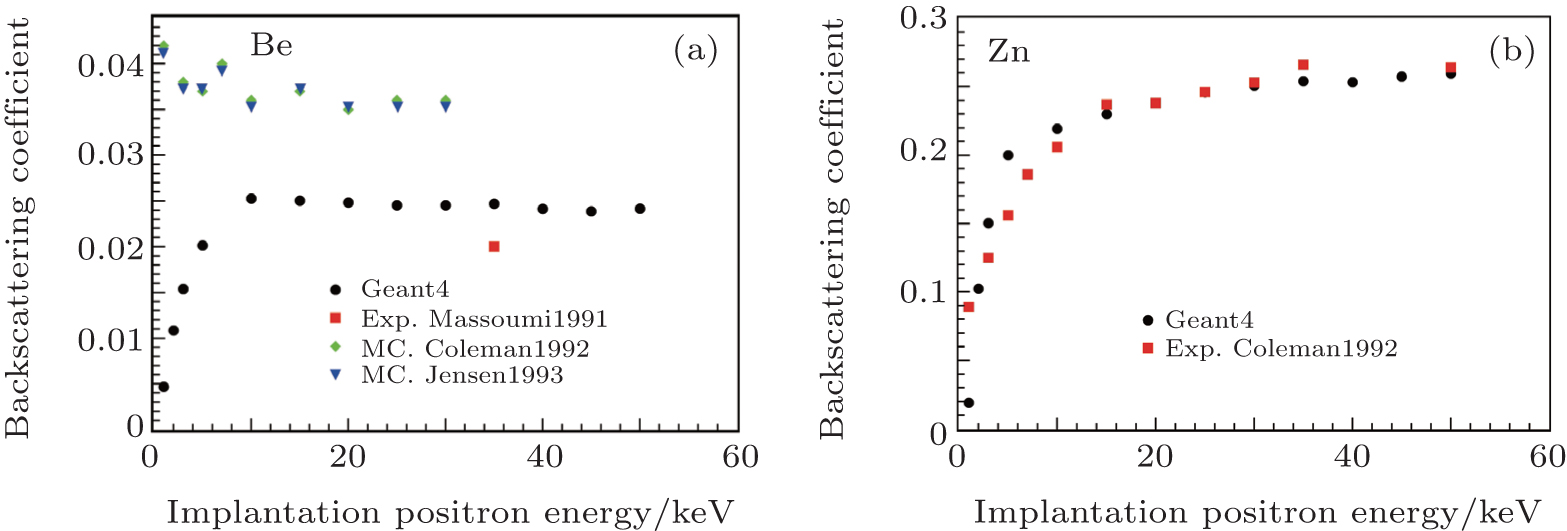 | Fig. 3. The backscattering coefficients versus incident positron energy for Be (a); for Zn (b). Our simulation results (Geant4), Exp. Massoumi1991 (Ref. [33]), MC. Coleman and Exp. Coleman1992 (Ref. [23]), MC. Jensen1993 (Ref. [13]). |
3.1.3. C, Si, and Ge
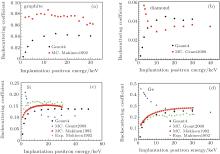
The backscattering coefficients of semiconductors such as graphite, diamond, Si and Ge in diamond structure are presented in Fig. 4. In Geant4, the difference between graphite and diamond is the density, while we obtain almost the same backscattering coefficients for these two crystals, and the experimental data of graphite reported by Makinen et al.[24] are obviously higher than ours. The results of diamond, Si and Ge reported by Dryzek et al., [19] who also used the Geant4 code but selected different models, show that the backscattering coefficient decreases with the increase of implantation energy and saturates at the energies higher than 20 keV, while our results give the opposite trend. This is consistent with the experimental results; however, our results do not fit very well with the experiments and those of others.
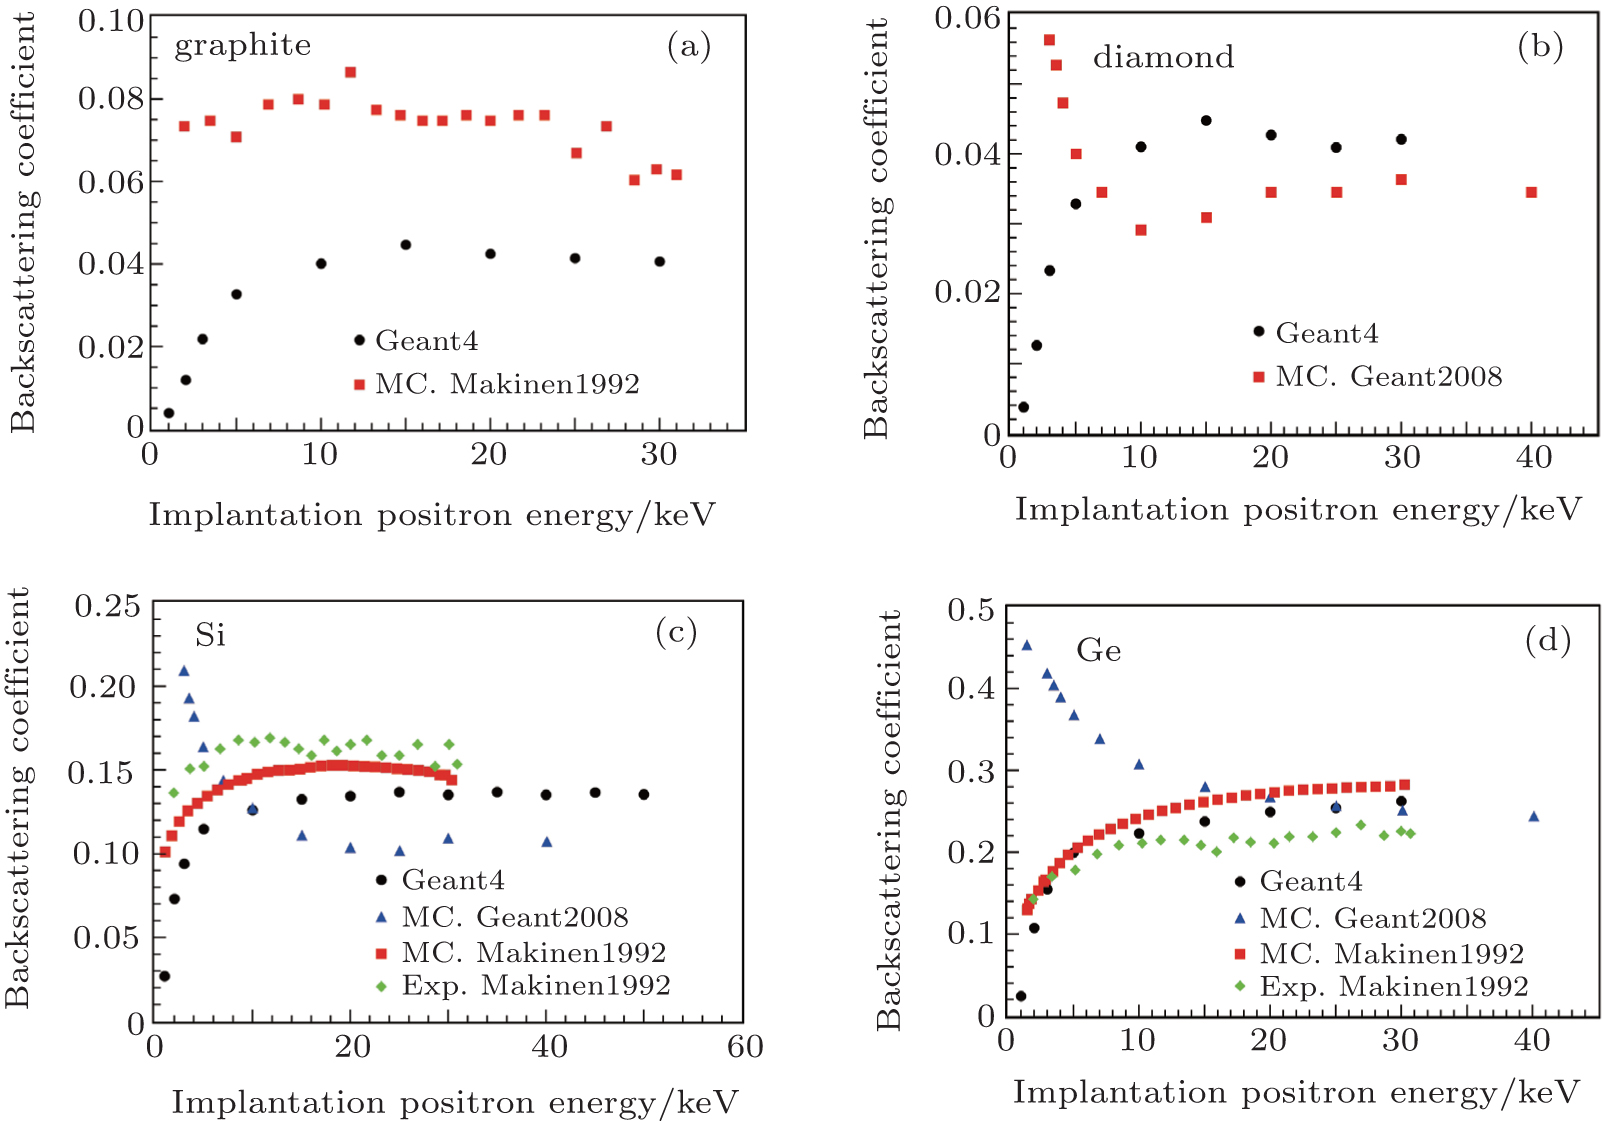 | Fig. 4. The backscattering coefficients versus incident positron energy for graphite (a); for diamond (b); for Si (c); for Ge (d). Our simulation results (Geant4), MC. Makinen1992 and Exp. Makinen1992 (Ref. [24]), MC. Geant2008 (Ref. [19]). |
3.1.4. W
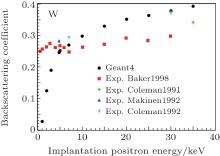
Because of its low positron affinity, W is widely used as a moderator in the slow positron beam technique. In Fig. 5, we present the relationship between its backscattering coefficients and the incident positron energy. Our results show that the backscattering coefficient increases as the energy increases, while this is very different from the experimental data reported by Baker et al.[20] which almost saturates at all energies. Although there are only a few data points reported by Makinen et al.[24] and Coleman et al., [23] the trend of their results is similar to ours.
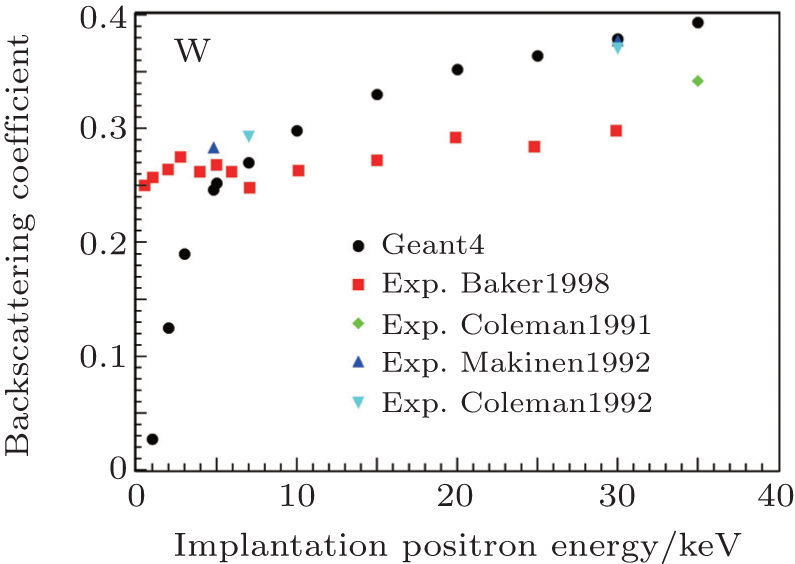 | Fig. 5. The backscattering coefficients versus incident positron energy for W. Our simulation results (Geant4), Exp. Baker1988 (Ref. [20]), Exp. Massoumi1991 (Ref. [33]), Exp. Makinen1992 (Ref. [24]), Exp. Coleman1992 (Ref. [23]). |
3.1.5. Amorphous polymers
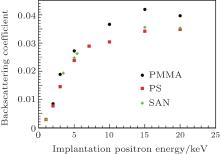
Algers et al.[25] and Palacio et al.[26] indirectly measured the implantation profiles of the positrons in amorphous polymers, such as atactic polystyrene (PS), atactic poly (methyl– methacrylate) (PMMA), and poly (styrene– co– acrylonitrile) (SAN), but there are still no calculations or experimental data of their backscattering coefficients. We calculate these data for the first time and present the relationship between their backscattering coefficients and the incident positron energy in Fig. 6. The backscattering coefficients of these amorphous polymers also increase as the energy increases. However, their values are very low, even less than 5%.
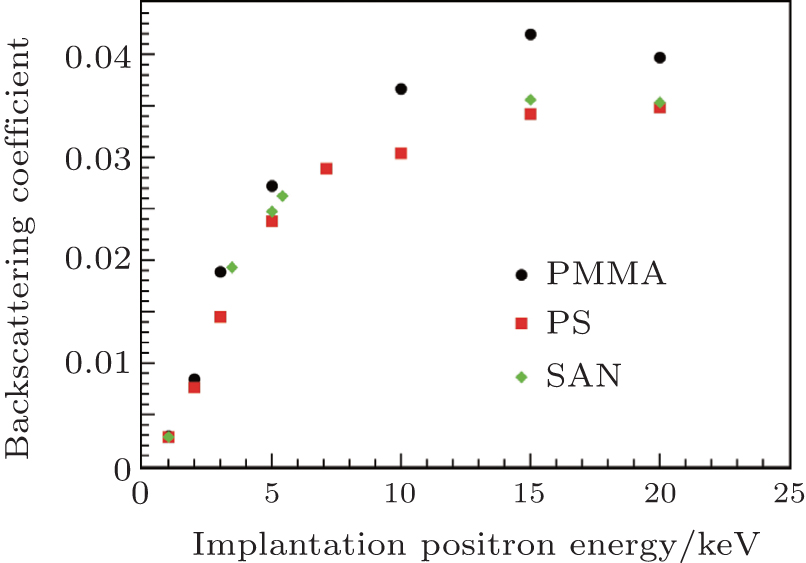 | Fig. 6. The backscattering coefficients versus incident positron energy for amorphous polymers. |
3.1.6. The backscattering coefficient versus atomic number Z
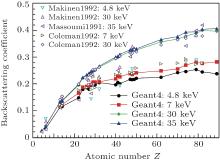
Previous studies have indicated that the backscattering coefficient is not only related to the implantation energy but is also related to the atomic number Z of the host material. In Fig. 7, we also present our simulations of the backscattering coefficients as a function of atomic number Z for several values of the positron implantation energy. It can be noticed that the backscattering coefficient increases with the increase of implantation energy and the atomic number, respectively. Moreover, our simulations reproduce the values of the backscattering coefficients and their tendencies fairly well, especially at high energies.
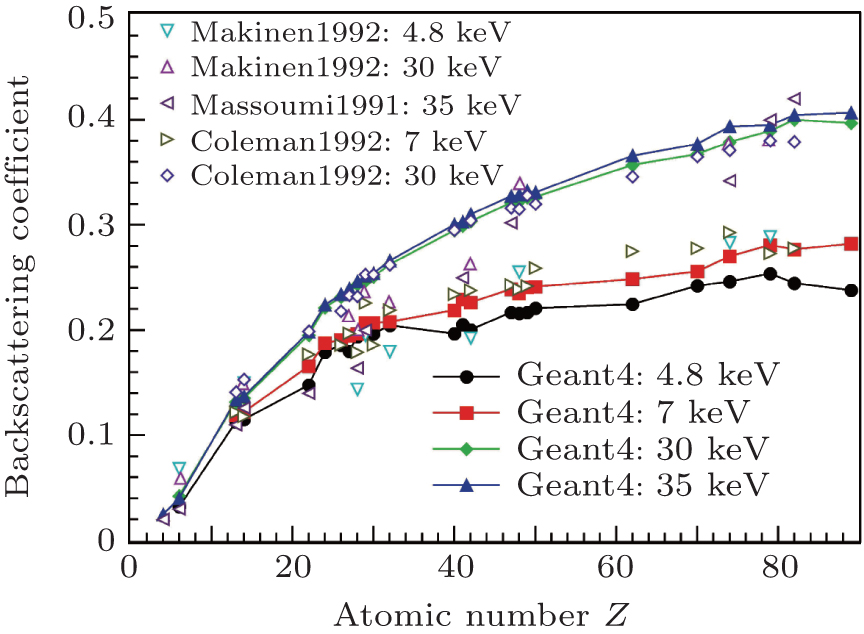 | Fig. 7. The backscattering coefficients as the function of atomic number Z. Our simulation results (Geant4), Makinen1992 (Ref. [24]), Massoumi1991 (Ref. [33]), Coleman1992 (Ref. [23]). |
3.1.7. Discussion
From the results listed above, we can notice that there is a big discrepancy among the experimental data measured by different authors, even for the same materials, especially for the low-Z materials and in the low energy region. For low-Z materials, such as Be and graphite, the uncertainties are large because of their small backscattering coefficients. In the low energy region, complications arise from positronium formation at the surface and the sensitivity of low-energy positrons to the surface condition. In addition, the uncertainty of the counts, the possible detection of the annihilation radiation from the backscattered positrons, and the angle of incidence that is not strictly normal to the surface of the target all give rise to the systematic error, and they are very hard to be avoided.
As we know, the elastic scattering process is the main factor to determine the backscattering coefficients in the Monte Carlo program. In our simulations, the backscattering coefficients are in very good agreement with the experimental data and this indicates that our model is reasonable. In Geant4 code, the detailed crystal structure of the host material has not been incorporated; that is to say, the atoms are randomly uniformly distributed and the structure is only up to the density and its atomic number. For crystals with a cubic close packed structure, such as Al, Cu, Ag, and Au and so on, the simulation structures are very close to their actual structures, so the influence of the structure on the backscattering coefficients can be neglected. For Zn with hexagonal close packed structure, similar to Al, Cu, Ag, and Au, our results are very close to the experimental data points. While for the crystals with the diamond structure, our simulations are a little different from the experimental data, so the influence of the structure should be considered carefully. For W with body centered cubic structure, although there are only few experimental data points, we conclude that the influence of the structure may not be neglected and the low positron affinity may be another factor that we should take into account.
Based on the above discussion, we study the positron implantation profiles in Al, Cu, Zn, Ag, and Au when the implantation positron energies are 10 keV, 20 keV, and 35 keV, respectively. Our simulation profiles of Al are shown in Fig. 8, the shape of the profile becomes wide with the increase of implantation positron energy, the same rule is found for the profiles of Cu, Zn, Ag, and Au, and this is consistent with the previous studies. Otherwise, we make a comparison of our simulation profile and the profile reported by Baker et al.[22] of Al at 10 keV, and find that they are in reasonable agreement, except that the peak of our simulation curve is a little higher than theirs. However, it should be mentioned that the red solid line in Fig. 8 denotes a Padé fit of their experimental data, and the experimental data are higher than the fitting data in fact, [22] which means that our simulation results are very close to the experimental data.
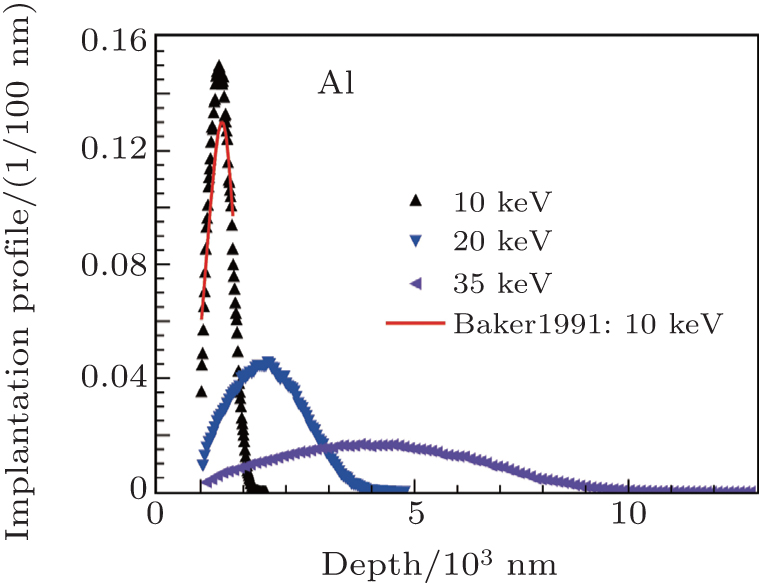 | Fig. 8. The positron implantation profiles in Al at 10 keV, 20 keV, and 35 keV. The data of Baker1991 comes from Ref. [22]. |
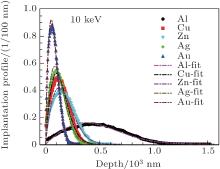
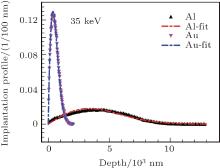
We list the parameters from best fits of the Monte Carlo data to Eq. (1) in Table 1. The value of m decreases with the increase of atomic number Z, and has a small change versus different implantation energies. For Al, it is very close to the commonly used one, 2.0. In Fig. 9 and Fig. 10, we present the simulation profiles of these five crystals and their corresponding best Makhovian fitting curves when the implantation energies are 10 keV and 35 keV, respectively. It is clear to see that the peak of the fitting curve is more forward and higher than that of our simulation data, especially for the profile of Al at 10 keV, while for the profile of Au at 35 keV, our simulation result is in fairly good agreement with the fitting curve.
| Table 1. The value of m from best fits of our Monte Carlo profiles in Al, Cu, Zn, Ag, and Au to Eq. (1) at 10 keV, 20 keV, and 35 keV. |
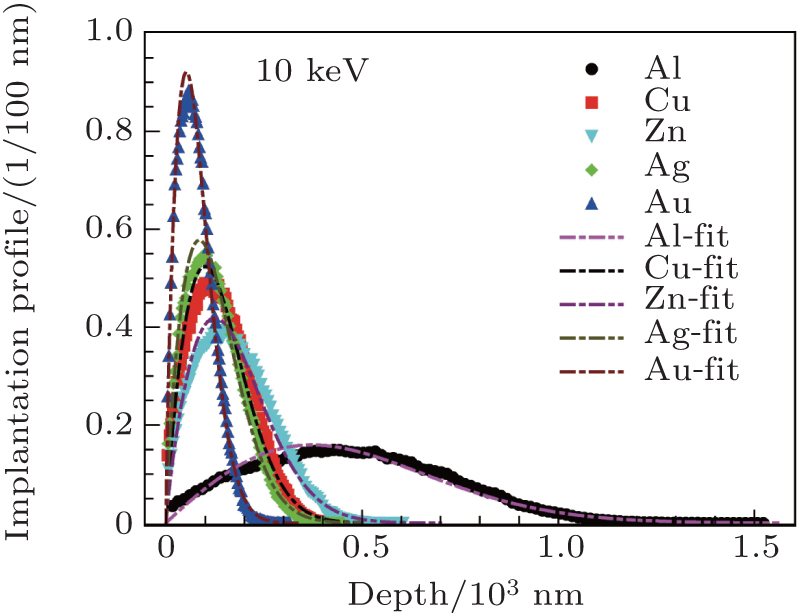 | Fig. 9. The simulated positron implantation profiles and their corresponding Makhovian fitting curves in Al, Cu, Zn, Ag, and Au at 10 keV. |
 | Fig. 10. The simulated positron implantation profiles and their corresponding Makhovian fitting curves in Al and Au at 35 keV. |
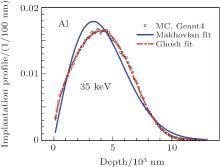
To improve the case mentioned above, Ghosh et al.[14, 34] proposed a modified version of the Makhovian equation, as follows:
where Nlm, l, m, and clm are adjustable parameters. We make a comparison of the best fits to Eq. (1) and Eq. (2) for the profile of Al at 35 keV in Fig. 11. Obviously, our simulation data can also fit well to Eq. (2) with Nlm = 1.096, l = 0.546, m = 3.400, and clm = 1.589. In further study, we find that these parameters are also dependent on the materials and implantation positron energies. Moreover, considerable effort is required if we want to apply it in the VEPFIT program.
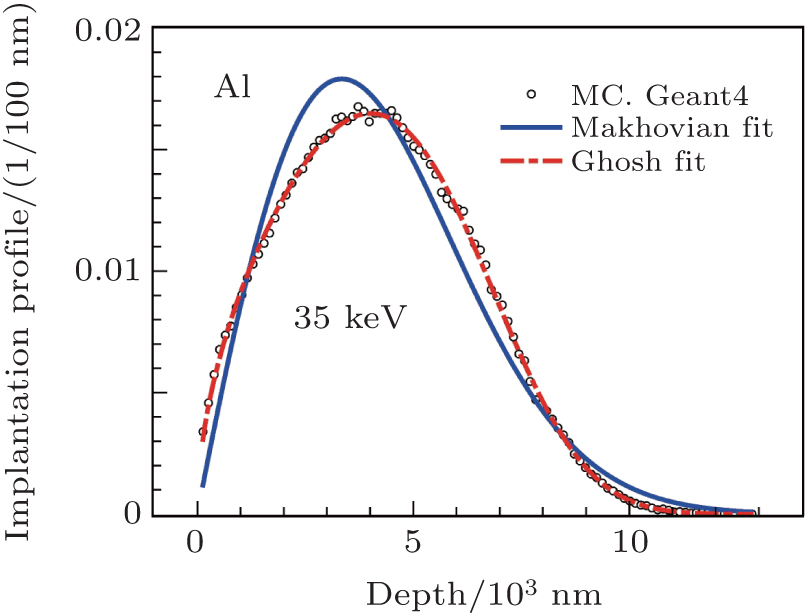 | Fig. 11. Our simulated positron implantation profiles in Al at 35 keV and its corresponding Makhovian fitting and Ghosh fitting curves. |
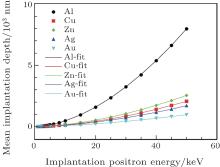
We also investigate the mean implantation depths of the positrons in several metals, in which the positron backscattering coefficients are reproduced well by the latest Geant4 code. We find that all of our simulations can fit well to the equation: z̄ = (A/ρ )En, as shown in Fig. 12. The adjustable parameters A and n from the best fits of our Monte Carlo data are listed in Table 2. The fitting values of A are systematically smaller and those of n are larger than the common used ones.
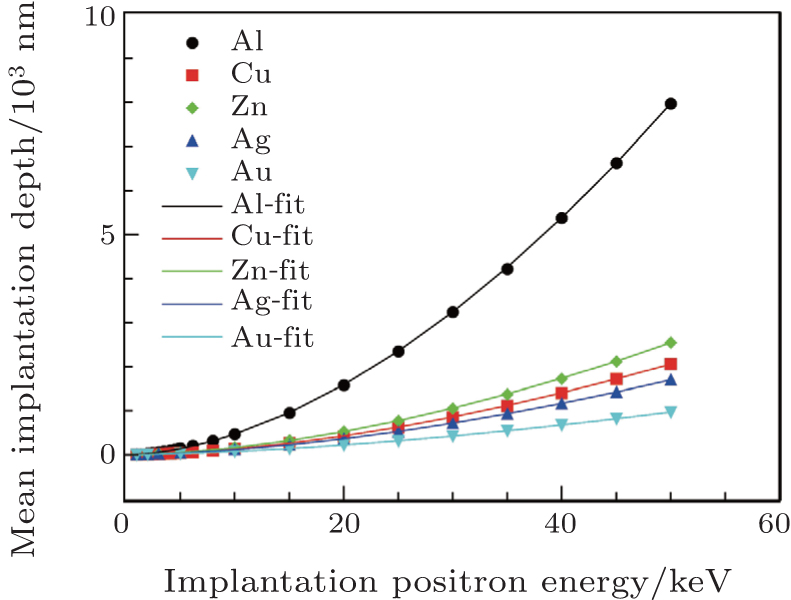 | Fig. 12. The mean depths versus the implantation positron energy for Al, Cu, Zn, Ag, and Au. |
| Table 2. The values of the fitting parameters A and n in the power-law fit of the mean implantation depth z̄ = (A/ρ )En for Al, Cu, Zn, Ag, and Au. |
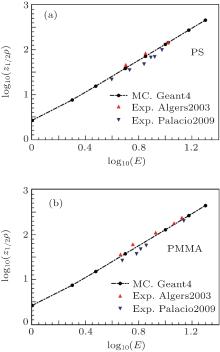
Alger et al.[25] and Palacio et al.[26] have measured the positron median implantation depths of the positrons in amorphous polymers PS and PMMA indirectly. To our best knowledge, there has not yet been theoretical calculation of them. In this paper, we calculate their positron backscattering coefficients and median implantation depths for the first time, at the same time, we compare our calculation results of the median implantation depths with the experimental data reported by Algers et al. and Palacio et al., as shown in Fig. 13. Our simulations for either PS or PMMA seem to be much closer to that reported by Algers et al. Further, we obtain the values of the fitting parameters A1/2 and n and list them in Table 2.
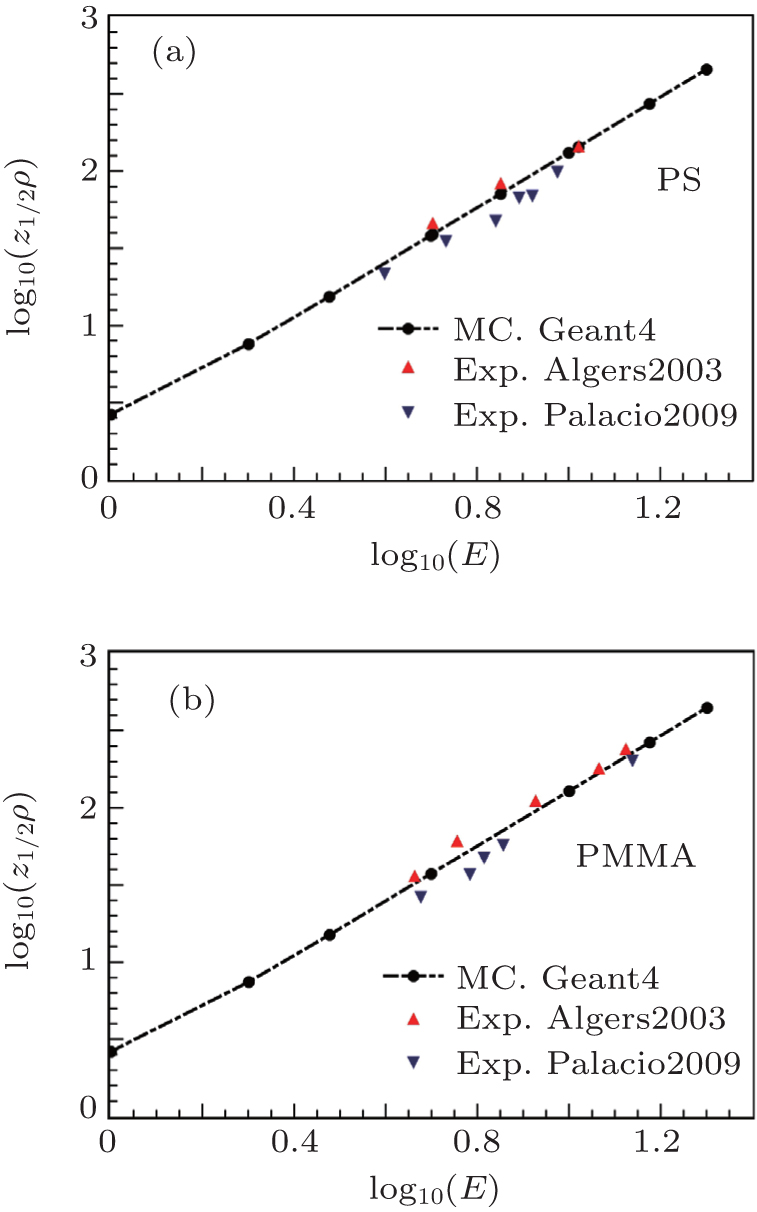 | Fig. 13. Comparison of our simulations and the experimental data for PS (a); for PMMA (b). Our simulation results (Geant4), Exp. Algers2003 (Ref. [25]), Exp. Palacio2009 (Ref. [26]). |
According to the discussions above, the positron backscattering coefficients of PS and PMMA are very low, so the influence of the backscattering positrons on experiments should be very weak. The fact that our simulations of amorphous polymers are very close to the experimental data indicates that it is feasible to simulate the implantation profiles using the latest Geant4 code, at least in amorphous polymers.
In this paper, we simulated the positron backscattering coefficients, implantation profiles, and mean implantation depths for mono-energetic positrons with an energy range from 1 keV to 50 keV normally incident on metals, semiconductors, and amorphous polymers using the latest Geant4 code. Compared with the previous experimental results, especially in high positron implantation energy region, our simulation backscattering coefficients of Al, Cu, Zn, Ag, and Au with the close packed structure are in fairly good agreement with them, while for the backscattering coefficients of Be, graphite, and diamond with low-Z, Si and Ge with the diamond structure, there exits a discrepancy between our simulations and the experimental data. Considering that the detailed crystal structure of the host material has not been incorporated, we think the accuracy may be relate to the structures of the host materials in Geant4.
Based on the reasonable simulated backscattering coefficients, we investigated the implantation profiles and mean depths of Al, Cu, Zn, Ag, Au, PS, and PMMA. The implantation profiles are well consistent with the Makhovian distribution and the form proposed by Ghosh et al., in some ways, our simulations can fit better than the results in the latter, while the fact that the four adjustable parameters are dependent on materials and implantation energies causes some trouble. The values of m from the best fits of our simulation data to Eq. (1) decrease with the increase of atomic number Z, and have a small change versus different implantation energies. For Al, it is very close to 2.0, which is used as the common value. The relationship between the mean implantation depth and the implantation energy well obeys the exponential distribution. The fitting values of A are systematically smaller and those of n are larger than the commonly used ones.
We calculated the positron backscattering coefficients and median implantation depths of the positrons in amorphous polymers PS and PMMA for the first time, the backscattering coefficients are very low compared with the other crystals. Our simulated median implantation depths are in fairly good agreement with the previous experimental results. Combined with our discussion above, we think it is simple and feasible to simulate the implantation profiles using the latest Geant4 code, and this has significant consequences for the convenient calculation of positron implantation, especially in elemental and multilayer systems.
We would like to thank Xiao Ran, Liu Yan-Fen and Xu Wen-Zhen for helpful discussions
| 1 |
|
| 2 |
|
| 3 |
|
| 4 |
|
| 5 |
|
| 6 |
|
| 7 |
|
| 8 |
|
| 9 |
|
| 10 |
|
| 11 |
|
| 12 |
|
| 13 |
|
| 14 |
|
| 15 |
|
| 16 |
|
| 17 |
|
| 18 |
|
| 19 |
|
| 20 |
|
| 21 |
|
| 22 |
|
| 23 |
|
| 24 |
|
| 25 |
|
| 26 |
|
| 27 |
|
| 28 |
|
| 29 |
|
| 30 |
|
| 31 |
|
| 32 |
|
| 33 |
|
| 34 |
|