


Fluid simulation of inductively coupled Ar/O2 plasmas: Comparisons with experiment
[Wang Yan-Hui, Wei Liu, Zhang Yu-Ru, Wang You-Nian† ]
]
]
|
|


†Corresponding author. E-mail: ynwang@ dlut.edu.cn
*Project supported by the National Science and Technology Major Project of the Ministry of Science and Technology of China (Grant No. 2011ZX02403-001) and the National Natural Science Foundation of China (Grant No. 11205025).
In this work, a two-dimensional fluid model has been employed to study the characteristics of Ar/O2 radio frequency (RF) inductively coupled plasma discharges. The emphasis of this work has been put on the influence of the external parameters (i.e., the RF power, the pressure, and the Ar/O2 gas ratio) on the plasma properties. The numerical results show that the RF power has a significant influence on the amplitude of the plasma density rather than on the spatial distribution. However, the pressure and the Ar/O2 gas ratio affect not only the amplitude of the plasma density, but also the spatial uniformity. Finally, the comparison between the simulation results and the experimental data has been made at different gas pressures and oxygen contents, and a good agreement has been achieved.
For the global manufacturing industry, the plasma treatment technology plays a very important role, especially in very large-scale integrated circuit manufacturing processes.[1] As the semiconductor manufacturing technology develops, inductively coupled plasma (ICP) sources are widely used due to the high plasma density at low gas pressures, as well as the relative simplicity.[2– 5] In the etching and deposition processes, electronegative gases, such as CF4, SF6, Cl2, O2, and BCl3, are mainly used. Electronegative gases, which contribute to the etch rate, selectivity to the photoresist and anisotropy, are usually diluted by electropositive gases, such as Ar and H2. Therefore, special attention has been paid to the investigation of plasma properties in gas mixtures. For instance, Ar/O2 discharges have been applied in plasma processing for several decades.[6– 10] Since the plasma distribution is mainly determined by external factors, such as power source parameters, chamber geometry, and working gas properties, it is very important to have a good insight into the plasma characteristics under various conditions, as this accordingly affects the etching process.[11– 13]
Computerized simulation is a convenient and effective method to study the plasma discharge process. During the past few years, many works have focused on the study of the plasma characteristics in gas mixtures. Gudmundsson et al.[6] used a global model to study the Ar/O2 ICP properties, and they observed that the density and fractional dissociation of oxygen molecules increased with argon content in the discharge. Babaeva et al.[14] used the particle-in-cell/Monte Carlo (PIC– MCC) method to study the ion energy distribution (IED) in O2 capacitively coupled plasma (CCP), showing that the ionization played an important role in the formation of the IED structure. Besides, Lee et al.[4] employed a PIC– MCC model to research the Ar/O2 CCP characteristics, and they found that the plasma density increased with the Ar/O2 ratio, which agreed well with the experimental data. Zhao et al.[15] used a hybrid model to investigate the Ar/CF4 gas ratio effects on the Si etch rate and profile uniformity in ICPs, revealing that the etching property is better at higher Ar/CF4 gas ratios. Liu et al.[16] used a fluid model to investigate influences of the gas flow rate, the radio frequency source voltage, and the pressure on the formation of dust particles in RF CCP acetylene (C2H2) discharge, and they found that the gas flow rate is an important parameter for the particle growth mechanism. Moreover, some experimental research has also been done. Gudmundsson et al.[17] investigated experimentally the evolution of the plasma’ s parameter in Ar/O2 plasma in an inductively coupled discharge by Langmuir probe and they found that the electron density increased with the Ar content. Kim et al.[18] studied the total and individual fluxes and kinetic energy distribution of ions in ICP in Ar, CHF3/Ar, and CHF3/Ar/O2 mixtures.
As mentioned above, many theoretical and numerical studies have been done in electronegative ICP gases. However, the study of the Ar/O2 mixture in ICPs by using the fluid model is rare. The fluid model can effectively describe the particle behavior under the low Kundsen number condition (namely, the ratio of particle mean free path and discharge characteristic length is small), and the spatial distribution of the density, velocity, and temperature of the particles can be obtained by solving the Boltzmann equations. In this paper, a two-dimensional fluid model, the so-called MAPS-ICP (multiphysics analysis for plasma sources-ICP) solver developed by Prof. Wang and his group, [19– 21] has been used to study the Ar/O2 planar coil inductively coupled plasma characteristics. Our attention has been on the effects of the source power, the pressure, as well as the Ar/O2 gas ratio on the plasma properties, especially on the electron density, ion density, and electron temperature. In order to validate the fluid model, the simulation results have been compared with the experimental data (experimental setup has been described in our previous papers), [22– 24] and a good agreement is achieved.
In this work, a two-dimensional fluid model has been employed, in which the behavior of various species can be described by Boltzmann equations. By integrating the Boltzmann equation over velocity space, the continuity equation, momentum balance equation, and energy balance equation are obtained. Moreover, the inductive electromagnetic fields are achieved by solving the Maxwell equations. More details of the model can be found in Ref. [20].
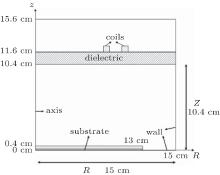
The simulations are performed in an axial symmetric cylindrical ICP chamber, as shown in Fig. 1. The sidewalls and the bottom of the chamber are grounded. The radius and the length of the chamber are, respectively, noted as R (15 cm) and Z (10.4 cm). The plasma is sustained by 13.56 MHz radio frequency (RF) power delivered via a two turn coil (N = 2), which is placed above an alumina dielectric window. A substrate, with a radius of 13 cm and a length of 0.4 cm is placed at the bottom of the chamber. In this work, the working pressure is 10– 80 mTorr, the input power is 200– 500 W, and the oxygen content is 10%– 60%.
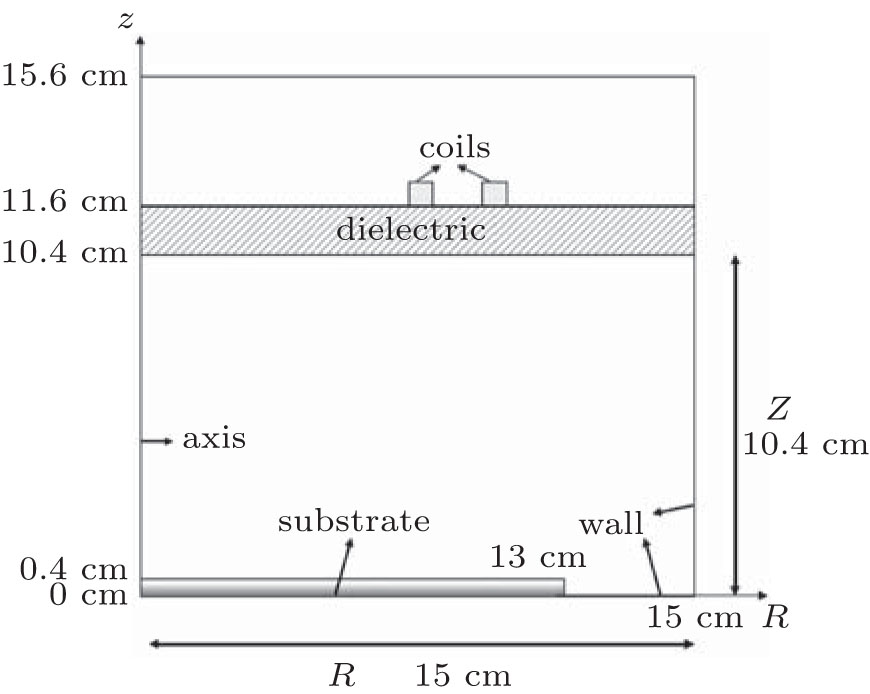 | Fig. 1. Schematic diagram of the cylindrical ICP reactor used in the simulation. |
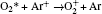
In Ar/O2 plasmas, negative ions, such as O− , 


| Table 1. Chemical reactions for Ar/O2 discharges included in the fluid model. |
In this section, the influence of the discharge parameter on the plasma properties, as well as the comparison between simulation results and experiment data are presented for an Ar/O2 discharge in an inductively coupled reactor. The gas temperature is fixed at 293 K.
The 2D spatial distributions of the electron density, the O− density, the Ar+ density, and the electron temperature are presented in Fig. 2. The gas pressure is 20 mTorr, the oxygen content is 20%, and the power is 300 W. The spatial distribution of the electron density is shown in Fig. 2(a). It can be seen that the maximum of the electron density appears at the chamber center. This is because the electrons are mainly produced by electron impact ionization and dissociative ionization collisions, and the cross section of these reactions is highly dependent on the electron temperature Te. Since the electron temperature Te exhibits a maximum under the dielectric window due to the inductive heating (see Fig. 2(b)), the electrons are mainly produced in this region. It is well known that the electrons are the lightest species; hence it is easy for them to diffuse through the whole chamber volume with the diffusion coefficient D = kT/Mν . Here, k is Boltzmann’ s constant, T and m are the species temperature and mass, and ν is the momentum transfer collision frequency.[15] Due to their high diffusion coefficient, a large number of electrons can arrive at the chamber wall and are lost there. Therefore, the magnitude of the electron density around the chamber wall is much lower than that at the bulk region.
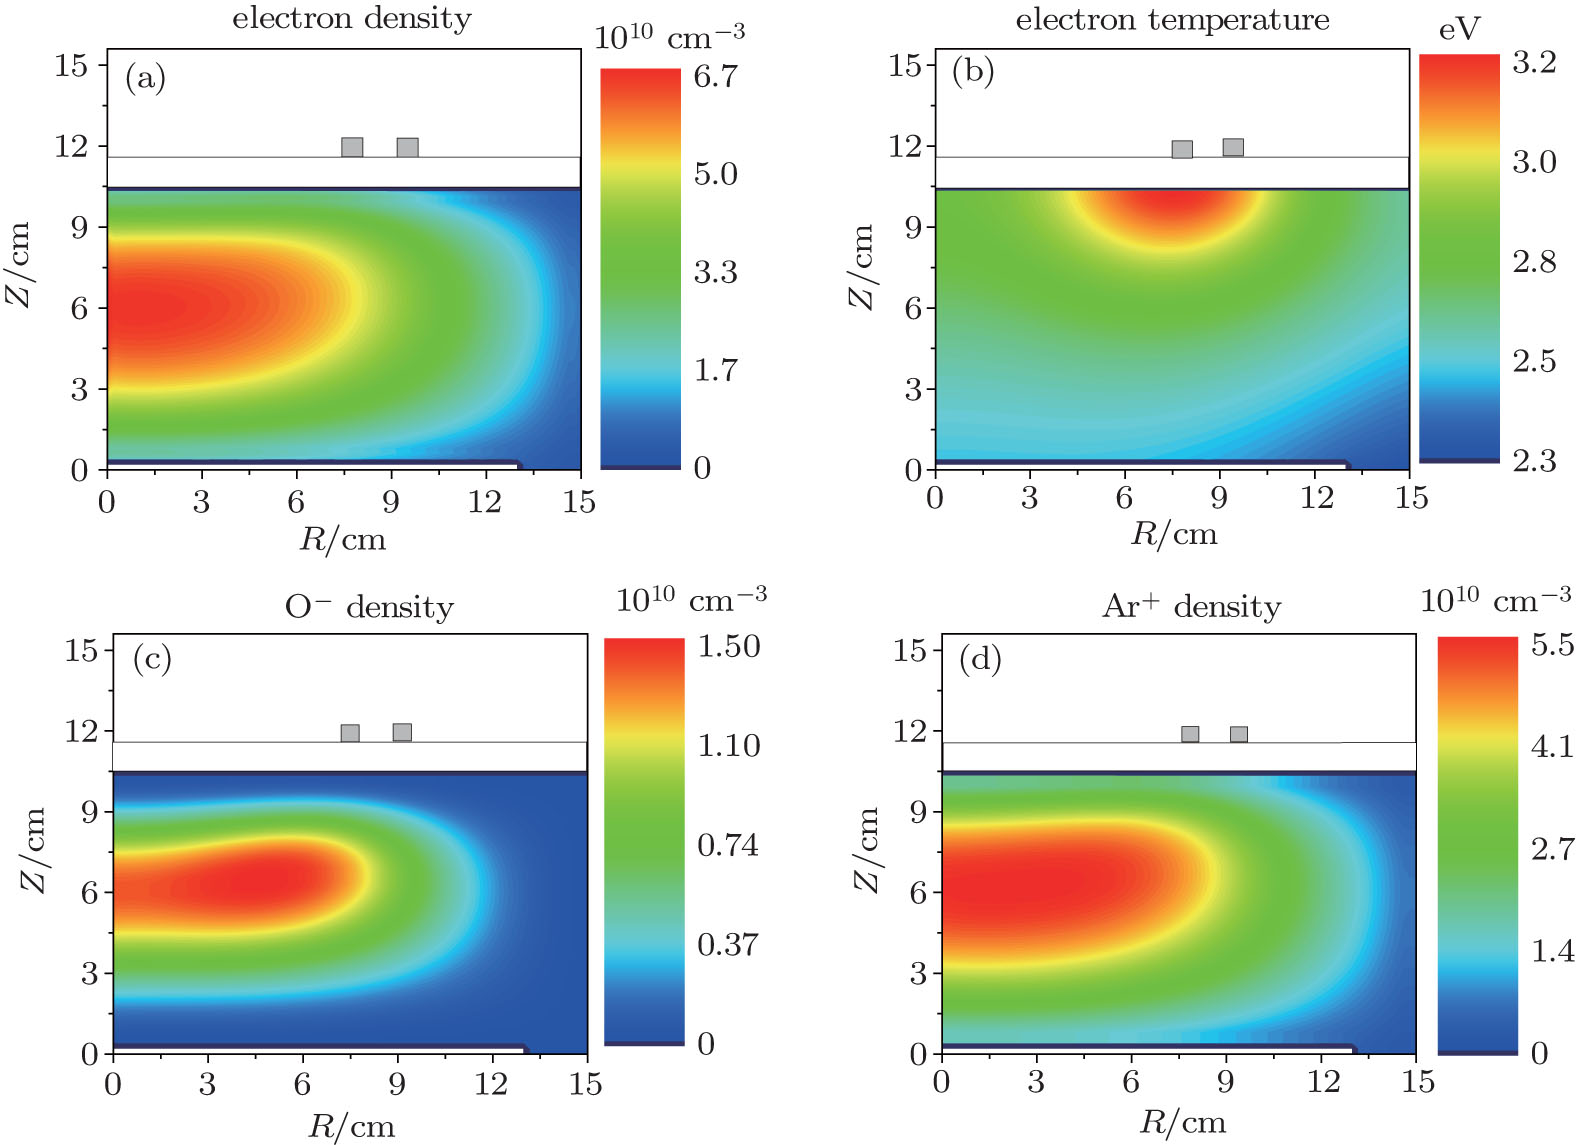 | Fig. 2. Spatial distributions of the (a) electron density, (b) electron temperature, (c) O− ion density, and (d) Ar+ ion density, at 20 mTorr, 300 W and 20% oxygen content. |
From Fig. 2(b), it is clear that the electron temperature is almost uniform in the whole chamber, except for a maximum under the dielectric window, which is similar to the results of Ref. [19]. This is because the electric field induced by the RF coil is strong under the dielectric window, and therefore the electrons can gain more energy from the inductive electric field, and this gives rise to the higher electron temperature there. Meanwhile, the electron temperature in the diffusion area is relatively low, due to the lack of electron heating.
As illustrated in Fig. 2(c), the main negative ions O− are mainly confined in the bulk region, as they are trapped by the positive plasma potential. The maximum of the O− ion density is located at about R = 6 cm, Z = 6 cm. It is because the O− ions are mainly produced by the electron attachment of O atoms. Since there are a large amount of O atoms in the ICP reactor due to the high rate coefficients of electron impact ionization and dissociation of O2, the spatial distribution of O− density is mainly determined by the electron density distribution. The maxima of the electron density and O− ion density are 6.66 × 1010 cm− 3 and 1.48 × 1010 cm− 3, respectively. The electronegativity, defined as nO− /ne, is about 0.22 under this condition.
The spatial distribution of the main positive ions Ar+ is similar to that of electrons, as shown in Fig. 2(d). It can be explained that the Ar+ ions are produced directly from the ionization of the background gas Ar. Since the Ar gas is abundant, the Ar+ ions profile is determined by the electron distribution.
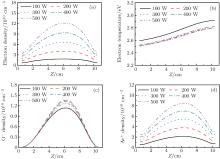
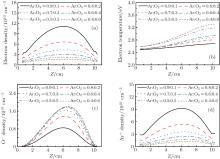
The axial distributions of the electron density, the O− density, the Ar+ density, and the electron temperature at different powers are presented in Fig. 3. The gas pressure is 20 mTorr, and the oxygen content is 20%. From Fig. 3(a), it is obvious that the electron density shows a parabolic profile along the axial direction and the electron density rises with the power when the pressure is constant. This is because higher powers may cause more energy coupled into the electrons, hence more collisions between electrons and other species take place, and this results in the higher electron density. Figure 3(b) shows the axial distributions of the electron temperature at different powers. The electron temperature is 2.74 eV at R = 0 cm and Z = 5.2 cm at 100 W, and it decreases to 2.63 eV at 500 W. This is because although the electron may gain more energy from the stronger electric field at higher powers, more energy is lost due to the more frequent collisions. Besides, the electron density increases with the power, and the electron can only be accelerated during a shorter distance and gain less energy due to the thinner sheath. Moreover, the electron temperature increases slightly toward the dielectric window due to the strong electric field there.
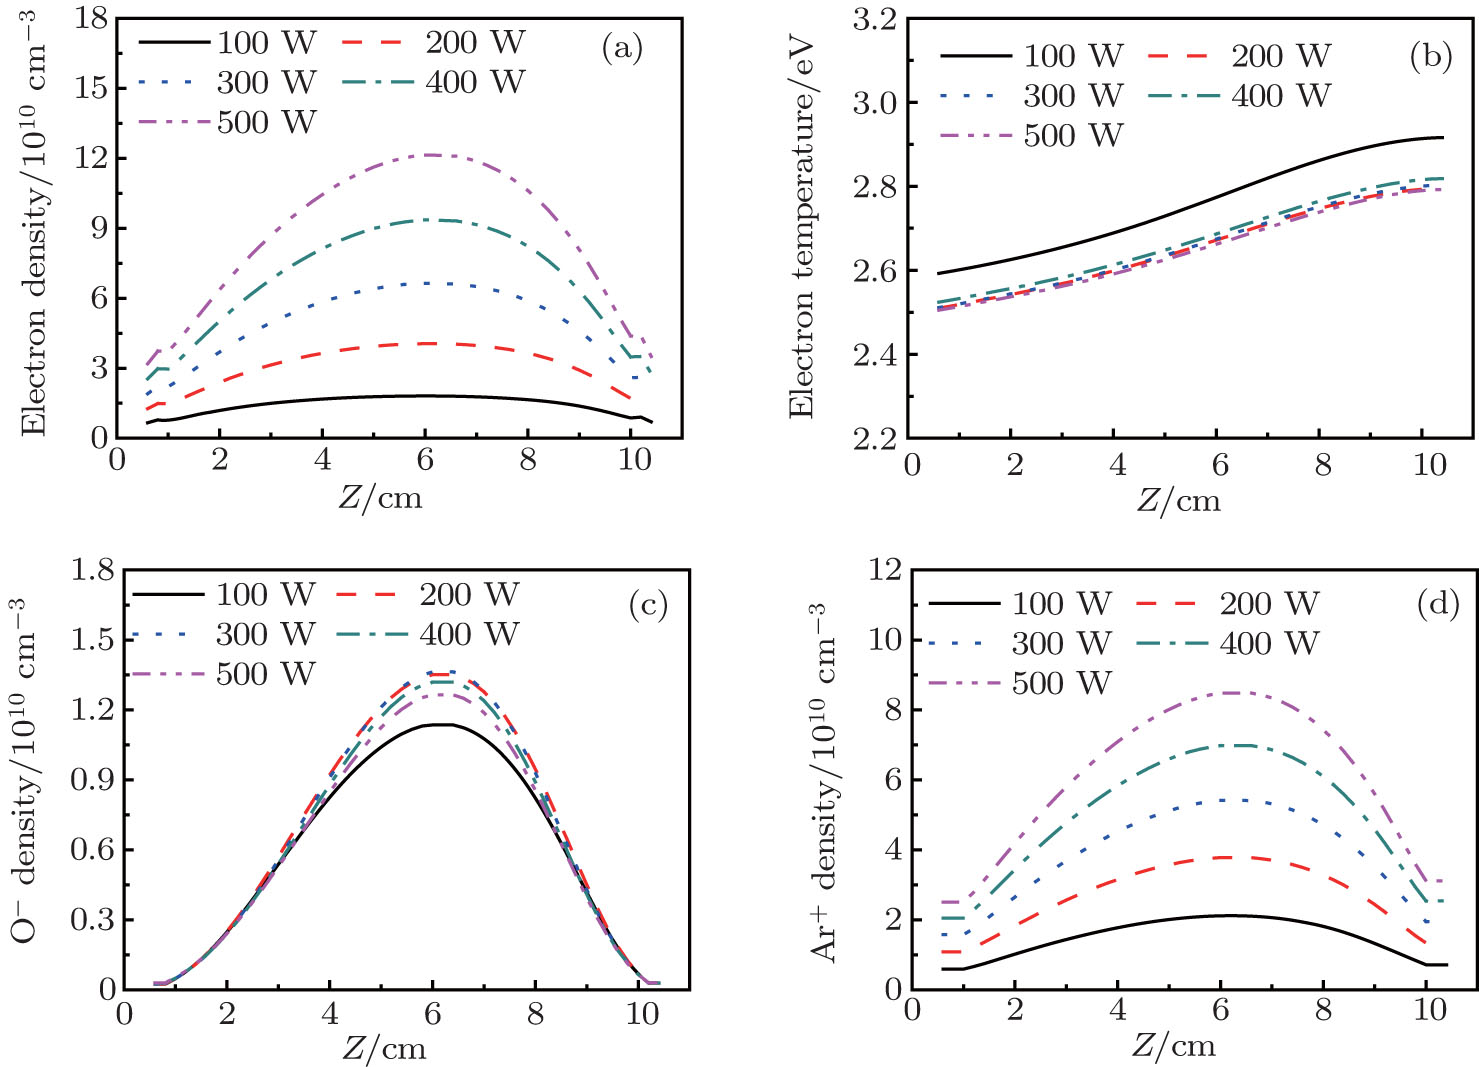 | Fig. 3. Axial distributions of the (a) electron density, (b) electron temperature, (c) O− ion density, and (d) Ar+ ion density for different powers, at 20 mTorr, Ar/O2 = 0.8/0.2. |
The density profiles of the main negative ions (O− ) and positive ions (Ar+ ) are illustrated in Figs. 3(c) and 3(d), respectively. The peak of the O− ion density is located at about 6 cm above the substrate. The O− ion density increases with the power in the low power range; but as the power increases further, the density decreases. In fact, the O− ions are mainly formed by dissociative attachments of O2 and 
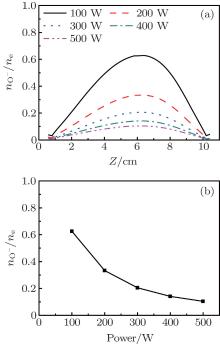
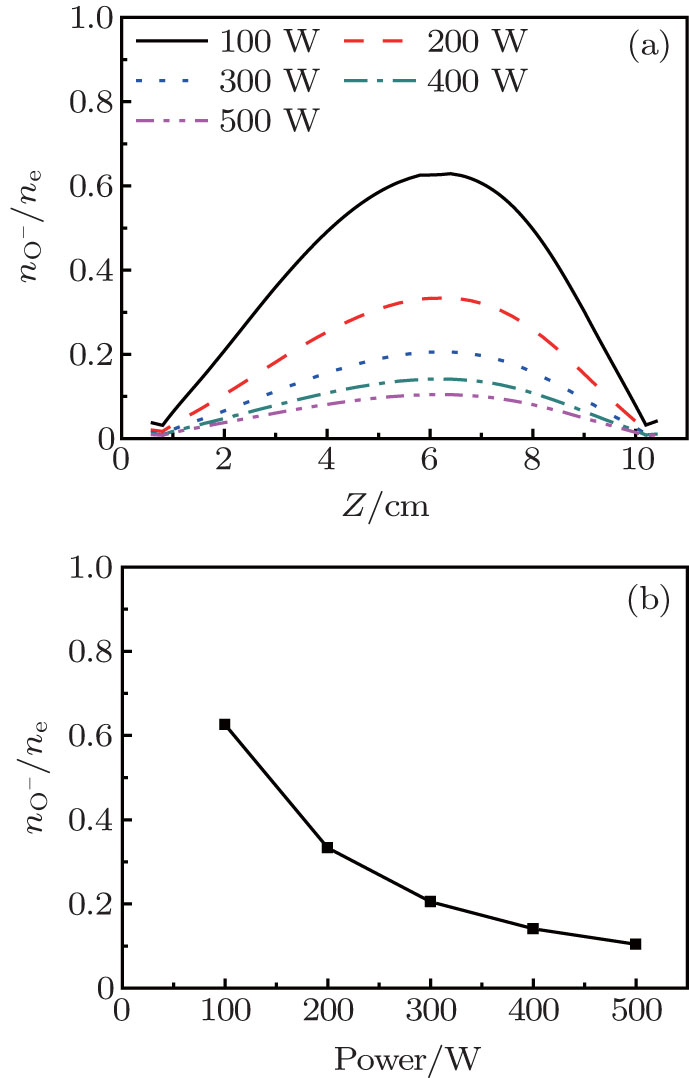
The evolution of the electronegativity nO− /ne versus power at 20 mTorr and 20% O2 is presented in Fig. 4. From Fig. 4(a), it is clear that the electronegativity decreases with power, and the axial distribution is characterized by a parabolic profile under all selected powers. Moreover, the electronegativity decreases from 0.63 to 0.1 when the power increases from 100 W to 500 W, as shown in Fig. 4(b). It might be the reason that O2 density decreases due to the increase in the electron density which involves an increase in the dissociation.
 | Fig. 4. (a) Axial distribution of the electronegativity, (b) the ratio of the peak value of the electron density and the O− ion density, at 20 mTorr, Ar/O2 = 0.8/0.2. |
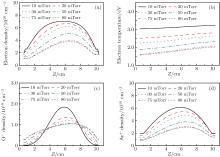
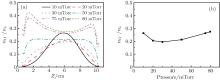
The axial distribution of the electron density, electron temperature, O− ion density, and Ar+ ion density at different pressures are shown in Figs. 5(a)– 5(d). It can be seen that the electron density, electron temperature, O− ion density, and Ar+ ion density decreases with the increasing pressure. This is because the electron loss caused by the attachment becomes prominent at higher pressures which results in the lower electron density. Besides, the decrease of the electron temperature is caused by the more frequent collisions and greater diffusion energy loss at higher pressures. The O− ion density decreases obviously from 1.85 × 1010 cm− 3 at 10 mTorr to 1.21 × 1010 cm− 3 at 30 mTorr. This is because the loss of O− ion rather than the production process plays a dominant role. However, as the pressure increases to 75 mTorr, the O− ion production by the dissociative attachment of metastable oxygen molecules 
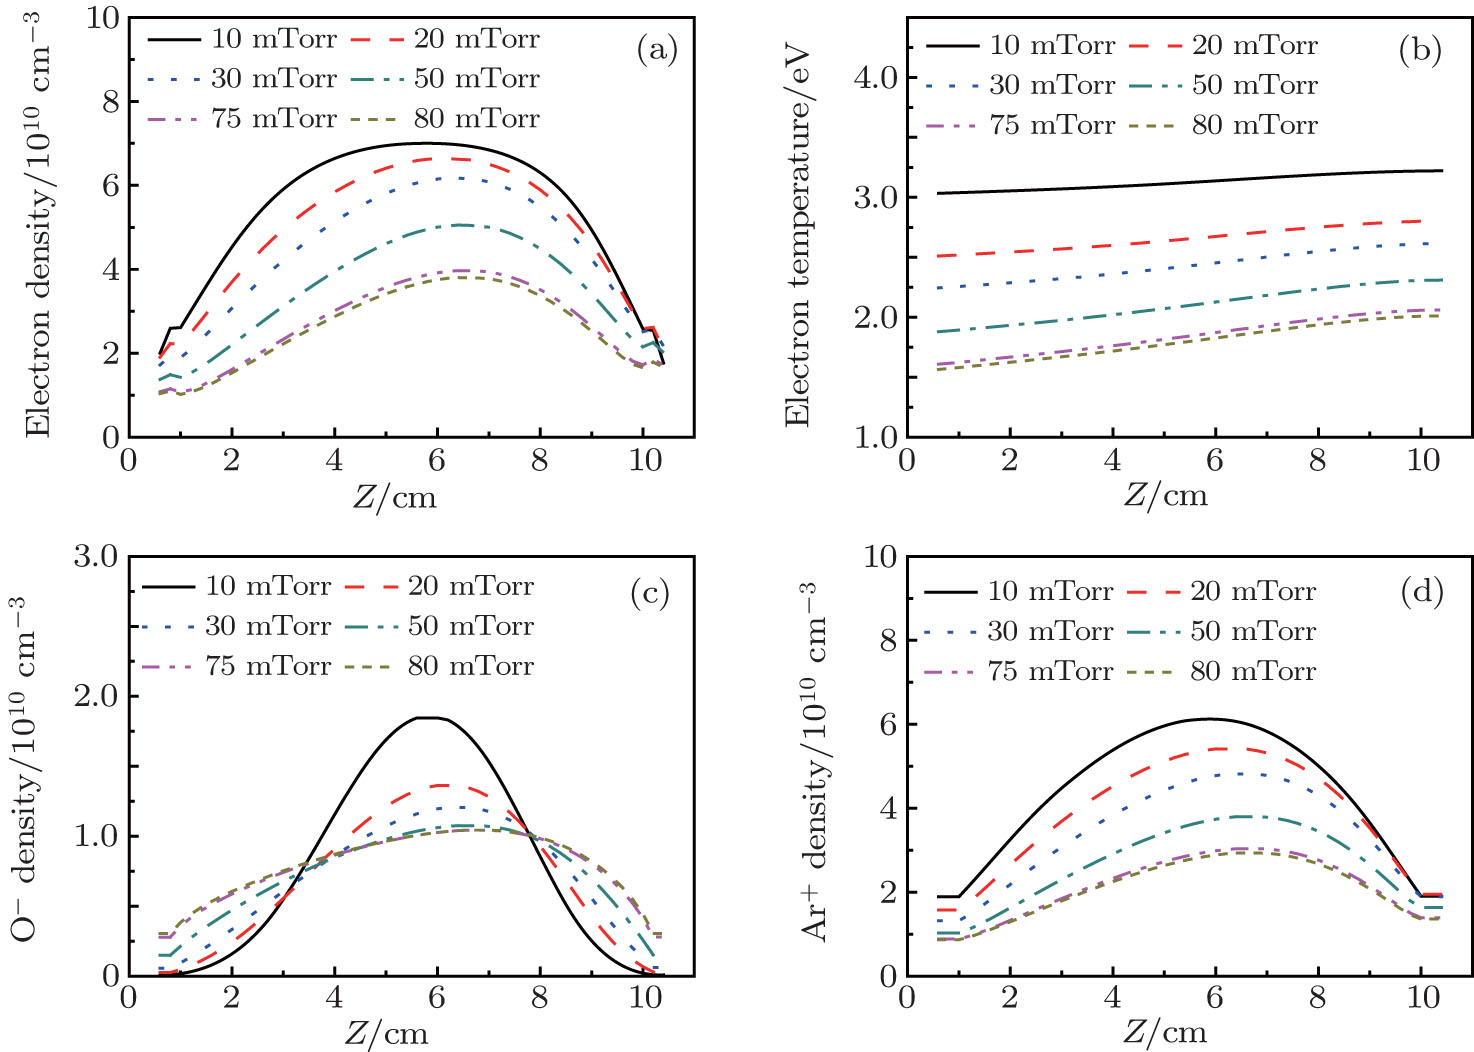 | Fig. 5. Axial distribution of the (a) electron density, (b) electron temperature, (c) O− ion density, and (d) Ar+ ion density for different pressures, at 300 W, Ar/O2 = 0.8/0.2. |
Moreover, it should be noted that the peaks of the electron density, electron temperature, O− ion density, and Ar+ ion density move toward the dielectric window with pressure, as is clear from Fig. 5, which indicates that the spatial distribution becomes asymmetrical at higher pressures. This is because the electron heating becomes more local under higher pressures, which causes the pronounced ionization under the dielectric window, and this gives rise to the asymmetrical distribution. In addition, the diffusion is limited at higher pressures.
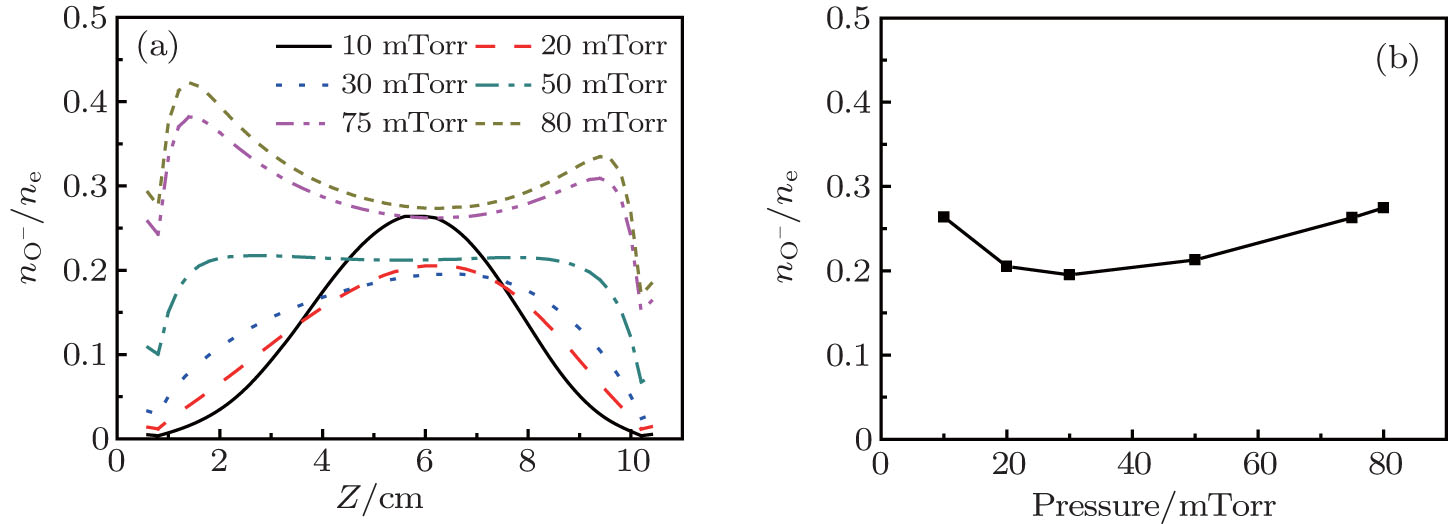
From Fig. 6, it is observed that the electronegativity decreases with pressure first, and then it increases when the pressure is higher than 20 mTorr. Besides, as the pressure increases, the parabolic profile of the electronegativity becomes flattened at the center. Finally, a dip appears at the center at 75 mTorr and 80 mTorr, two peaks are formed near the dielectric window and the substrate, and a saddle profile is observed under this condition.
 | Fig. 6. (a) Axial distribution of the electronegativity, (b) the ratio of the peak value of the electron density and the O− ion density, at 300 W, Ar/O2 = 0.8/0.2. |
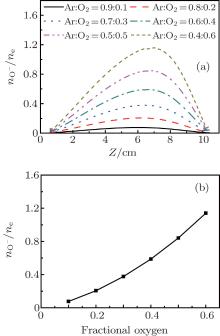
Figure 7 shows the axial distribution of the plasma parameters at 300 W, 20 mTorr, and the oxygen content changes in the range of 10%– 60%. From Fig. 7(a), we can see that the electron density decreases with the oxygen content. This is because on one hand, more electrons are lost through the attachment and dissociative attachment reactions with neutral radicals. On the other hand, the collision energy loss caused by per electron– ion pair in Ar/O2 mixtures is higher than in pure argon discharges. Moreover, the additional energy loss will be absorbed by electrons, which results in the increase of the electron temperature at higher oxygen content, as shown in Fig. 7(b). The evolution of the O− ion density with oxygen content is shown in Fig. 7(c). Since O− ions are mainly produced by the electron dissociative attachment of ground-state oxygen molecules O2 and metastable oxygen molecules 
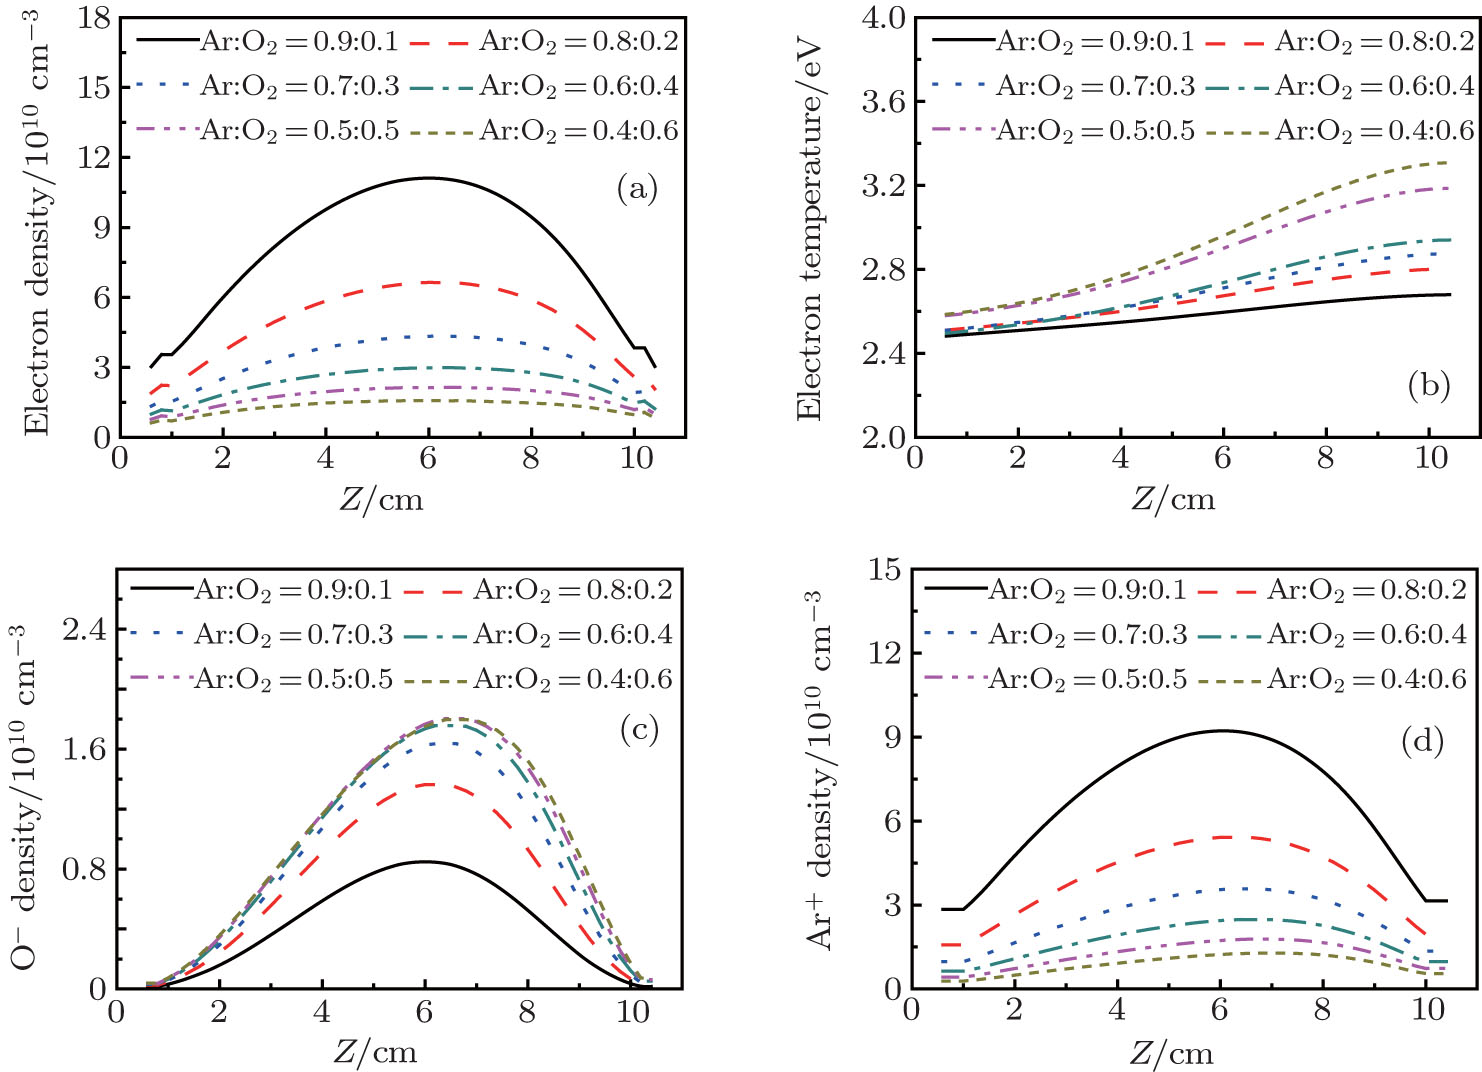 | Fig. 7. Axial distribution of the (a) electron density; (b) electron temperature; (c) O− ion density; (d) Ar+ ions density for different oxygen contents, at 300 W, 20 mTorr. |
It has also been discovered that the maximum of the plasma properties moves toward the dielectric window at higher oxygen content, and the trend is similar to that with pressure. This is because the balance between the electron loss by attachment and the electron diffusion mechanism has been broken, which is important for maintaining a uniform and center-peaked plasma profile.
Figure 8 shows the electronegativity versus the oxygen fraction at 300 W and 20 mTorr. It is obvious that the electronegativity increases with the O2 content. Indeed, the electronegativity increases from 0.08 at 10% O2 content to 1.14 at 60% O2 content, as shown in Fig. 8(b). The increase in electronegativity with O2 content is due to the fact that more O− ions are produced through the electron dissociative attachment of ground-state and metastable oxygen molecules.
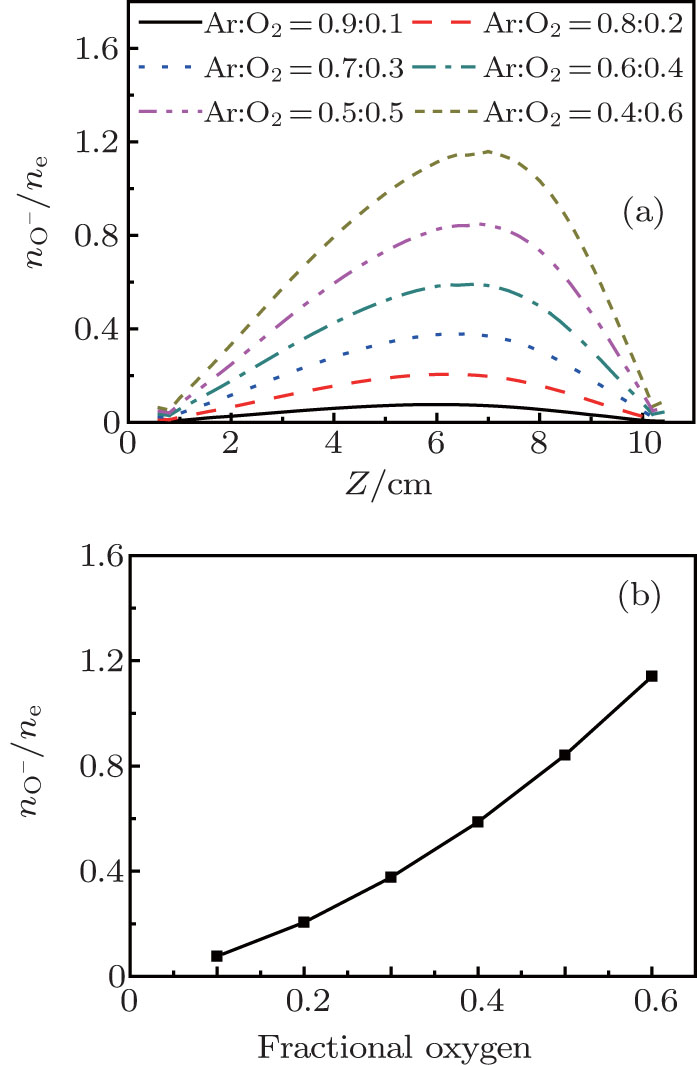 | Fig. 8. (a) Axial distribution of the electronegativity, (b) the ratio of the peak value of the electron density and the O− ion density, at 300 W, 20 mTorr. |
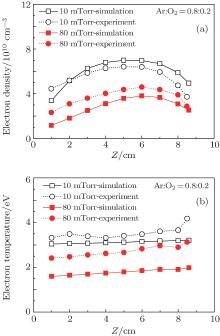
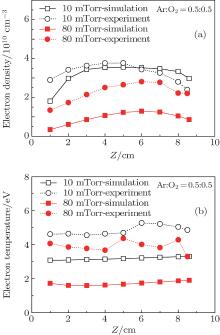
To verify the calculated results, both plasma density and electron temperature were measured by Langmuir probe along the axial direction at different pressures and oxygen contents, and the comparisons are shown in Figs. 9 and 10. When the oxygen content is 20 %, the electron density exhibits a parabolic profile along the axial direction at 10 mTorr, and the maximum of the electron density moves toward the dielectric window with lower absolute values as the pressure increases to 80 mTorr. The calculated electron density profile agrees well with the experimental data, except for a higher value at 10 mTorr, and a lower value at 80 mTorr, as shown in Fig. 9(a). This can be explained because the electron temperature becomes lower at higher pressure (as will be discussed below), and this leads to the higher electron impact attachment rate. Therefore, the calculated electron density at 80 mTorr is lower than the experimental data, and this effect becomes more obvious when the O2 ratio increases to 50%, as shown in Fig. 10(a). From Fig. 9(b), it is clear that the electron temperature at 10 mTorr is higher than at 80 mTorr, both in simulations and experiments, due to the more frequent collisions at higher pressures. Moreover, it changes slightly along the axial direction, and a higher absolute value is observed near the dielectric window. In addition, the measured electron temperature is higher than the simulation result both at 10 mTorr and 80 mTorr. As the oxygen content increases to 50%, shown in Figs. 10(a) and 10(b), the evolutions of the electron density and electron temperature with pressure are similar to that observed in gas mixtures with 20% oxygen. Note that the measured electron temperature shows fluctuations near the dielectric window, due to the interference of the strong electromagnetic field there.
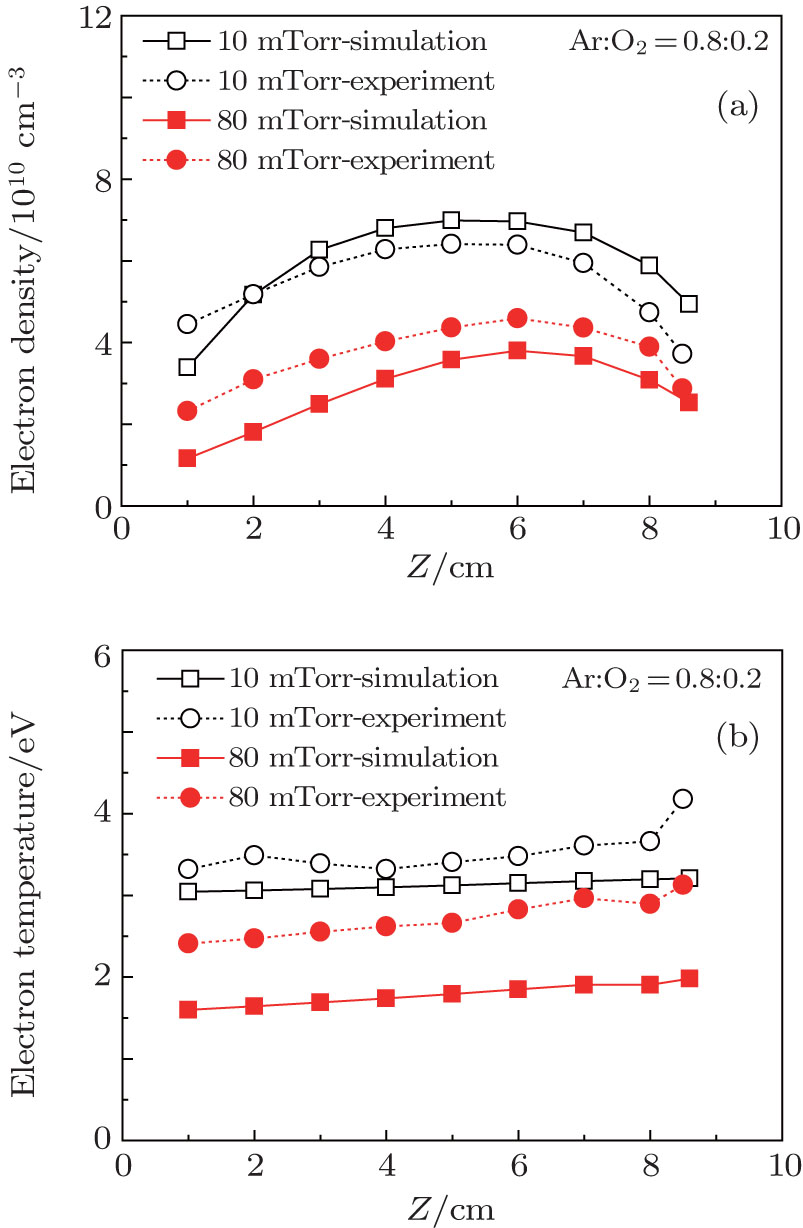 | Fig. 9. Axial comparisons between the experimental data (dotted line) and simulation results (solid line): (a) electron density; (b) electron temperature, for an Ar/O2 (0.8/0.2) discharge sustained at 300 W, 10 and 80 mTorr. |
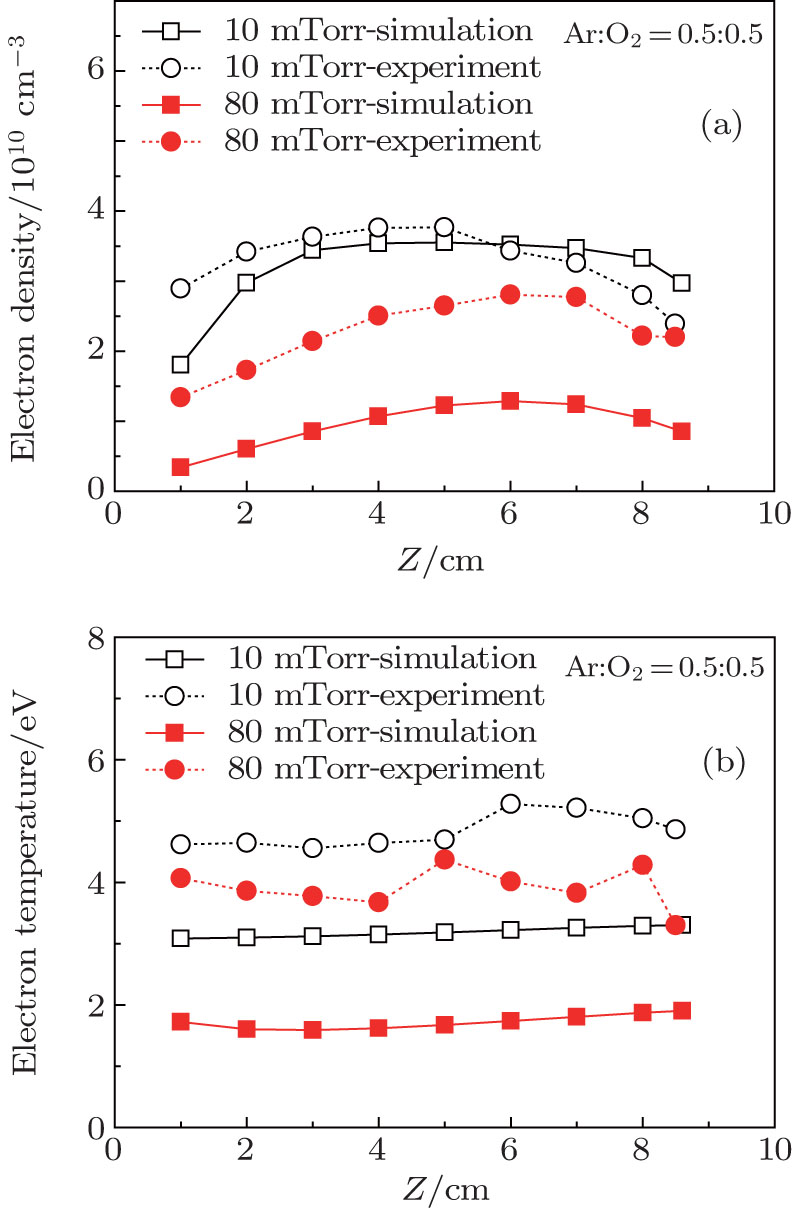 | Fig. 10. Axial comparisons between the experiment data (dotted line) and simulation results (solid line): (a) electron density; (b) electron temperature, for an Ar/O2 (0.5/0.5) discharge sustained at 300 W, 10 and 80 mTorr. |
In this paper, a two-dimensional self-consistent fluid model combined with the full set of Maxwell equations has been employed to investigate the Ar/O2 inductively coupled plasma characteristics. The distribution of the electron density, electron temperature, O− ion density and Ar+ ion density are studied under various RF powers, gas pressures, and O2 ratios. The results show that the RF power contributes significantly to the amplitude of the electron density, electron temperature, O− ion density, and Ar+ ion density, but it has little influence on the plasma spatial distribution. However, the pressure and the Ar/O2 gas ratio affect not only the amplitude but also the spatial uniformity. It is obvious that the peaks of the plasma densities move toward the dielectric window with increasing pressure and oxygen content. This can be attributed to the fact that the spatial distribution of the ionization rate becomes non-uniform at higher pressures and oxygen contents, and the balance between the electron loss by the attachment and the electron diffusion mechanism has been broken under this condition. Finally, the comparisons between experimental data measured by Langmuir probe and simulation results by fluid model show good qualitative agreement at different gas pressures and oxygen contents, and this indicates the reliability of the fluid model.
| 1 |
|
| 2 |
|
| 3 |
|
| 4 |
|
| 5 |
|
| 6 |
|
| 7 |
|
| 8 |
|
| 9 |
|
| 10 |
|
| 11 |
|
| 12 |
|
| 13 |
|
| 14 |
|
| 15 |
|
| 16 |
|
| 17 |
|
| 18 |
|
| 19 |
|
| 20 |
|
| 21 |
|
| 22 |
|
| 23 |
|
| 24 |
|
| 25 |
|
| 26 |
|
| 27 |
|