


Probing conformational change of T7 RNA polymerase and DNA complex by solid-state nanopores
Cite this Article
Tong Xin, Hu Rui, Li Xiaoqing, Zhao Qing. Probing conformational change of T7 RNA polymerase and DNA complex by solid-state nanopores. Chinese Physics B, 2018, 27(11): 118705 
Permissions
Probing conformational change of T7 RNA polymerase and DNA complex by solid-state nanopores
† Corresponding author. E-mail:
Project supported by the National Natural Science Foundation of China (Grant Nos. 51622201, 91733301, and 61571015).
Abstract
Proteins are crucial to most biological processes, such as enzymes, and in various catalytic processes a dynamic motion is required. The dynamics of protein are embodied as a conformational change, which is closely related to the flexibility of protein. Recently, nanopore sensors have become accepted as a low cost and high throughput method to study the features of proteins. In this article, we used a SiN nanopore device to study the flexibility of T7 RNA polymerase (RNAP) and its complex with DNA promoter. By calculating full-width at half-maximum (FWHM) of Gaussian fits to the blockade histograms, we found that T7 RNAP becomes more flexible after binding DNA promoter. Moreover, the distribution of fractional current blockade suggests that flexibility alters due to a breath-like change of the volume.
1. Introduction
A solid-state nanopore sensor is an effective method to obtain information about single biomolecules.[1–4] The idea of nanopore sensing comes from the Coulter-counter method to evaluate particles in solution.[2–4] In a container full of electrolyte, the container is divided into two chambers by an insulating chip with a small pore. When a molecule is translocating through the pore under an electric field, the conductance of the system will decrease, and the decrease is related to the geometry and charge of the molecule. A nanopore sensor works by analyzing the change of the current caused by molecule translocation across the nanopore. In previous research, a solid-state nanopore sensor has been shown to be a reliable and accurate method for detecting nucleic acids,[5–12] protein,[13–16] and synthetic structures.[17–22]
Proteins are crucial to most biological processes, such as enzymes, and they are dynamic during the catalytic process. The dynamics of protein are reflected in its conformational change, which is caused by local and collective thermal motion of atoms and chains. Many studies have shown that the conformational change of a protein highly influences its function.[23–28] Many techniques have been used to probe protein flexibility, such as Fourier transform infrared spectroscopy (FTIR), circular dichroism (CD),[28] x-ray crystallography,[29] and nuclear magnetic resonance (NMR).[30] Nevertheless, in those techniques, chemical modification or crystallization of protein is needed, which may influence the structure of the protein and lead to inaccurate structural information being obtained. Compared to other methods, a solid-state nanopore can gauge the label-free protein in solvent, similar to intracellular environment, and it can also analyze protein in real time. Recently, Waduge et al. demonstrated that the breadth of current blockades increases with more flexible proteins by measuring a set of proteins.[31,32] A protein with larger flexibility can have more possible configurations when it passes through the nanopore, thus it will provide wider distributions of current blockages, resulting in wider full-width at half-maximum (FWHM) values from Gaussian fits to the current blockade histograms. In this method, FWHM values obtained from Gaussian fits to the current blockade histograms could be used an indicator of protein flexibility. A larger FWHM value suggests higher flexibility of the protein.
T7 RNA polymerase (RNAP) is one of the ideal models for studying the interaction between DNA promoter and polymerase because it can easily form a tight binary complex with DNA promoter.[33–36] T7 RNA polymerase is a DNA-dependent RNA polymerase which consists of a single polypeptide chain and has a molecular weight of 99 kDa. As Fig.
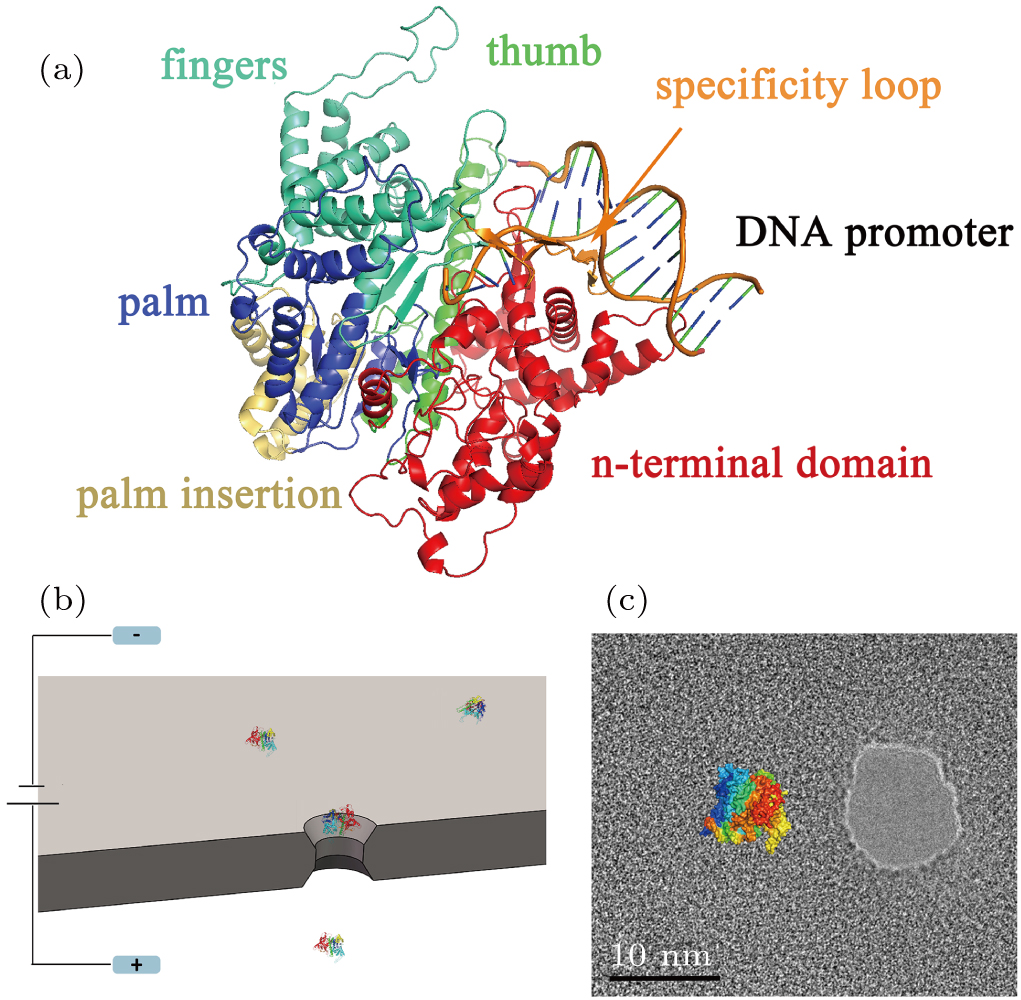 | Fig. 1. (color online) (a) PDB-based cartoon shows the structure of the T7 RNAP and complex with DNA promoter, which are colored by domain and module, with the N-terminal domain (red), the thumb (green), the palm (blue), the palm insertion module (yellow), the fingers (cyan), the specificity loop (orange). (b) Schematic of the nanopore sensor used in this work. A SiN membrane separates the electrolyte-filled space into two chambers which are connected by a nanoscale pore. An applied voltage between the electrodes generates an electrical field to drive the protein crossing the pore. (c) TEM image of a 10 nm nanopore used in this work, and a size comparison with T7 RNAP. |
In the binding process, promoter sequence-specific recognition is accomplished by the specificity loop. Meanwhile, at position −17 to −13, AT-rich promoter sequence is recognized by a loop in the N-terminal domain, which proceeds the transcription. DNA strands are then melted by the fingers sub-domain and remain as single-stranded until the position +1, and the complex is prepared during the transcription at the active site of the palm sub-domain.[33,37,45] The crystal structure of the polymerase shows the diameter of about 8 nm for T7 RNA polymerase. In a solution of pH = 8.0, T7 RNAP will be negatively charged. Studying the flexibility of T7 RNA and its complex may reveal a more detailed understanding of the interaction between RNA polymerase and its promoter.
The static structure of T7 RNAP and its complex with DNA promoter has been already studied by using x-ray crystallography,[35,36] but the conformational change of T7 RNAP complex in solvent remains unclear. In this article, we take advantage of solid-state nanopore to probe T7 RNAP and its complex in solution. The translocation events of T7 RNAP and its complex are analyzed, and FWHM values from Gaussian fits of blockages are calculated, respectively. We find that compared to T7 RNAP, the FWHM value is larger in its complex, suggesting a larger flexibility of T7 RNAP complex, which means that the flexibility of T7 RNAP increases after binding DNA promoter. This increase may relate to the function changes of T7 RNAP after initiation. Our results further support that the flexibility change is due to a breath-like 70 nm3 volume change.
2. Materials and methods
2.1. Nanopore fabrication
Nanopore chips were fabricated using double-sided polished silicon wafer chips with a thickness of 

2.2. Sample preparation
An extra

-GGGAG-

at positions through +1 to +5 was added to form the complex. Using PCR, we synthesized the ds-DNA fragment and checked it by gel electrophoresis (2% Argarose Gel, 120 V, 20 min, 100 bp DNA maker). The result is shown in Fig. S1 of the supporting information. To make the RNAP–DNA complex, we used a reaction environment containing pH = 8, 2 mM MgCl, 20 mM Tris,

T7 RNAP, and

DNA promoter. Then the mixture was incubated for 10 min at 37 °C to form the RNAP–DNA complex.
To obtain the RNAP–DNA complex, we chose a 22 bp ds-DNA fragment as promoter for T7 RNAP (New England Biolabs, Inc., America) to form the complex. In the promoter, the nontemplate sequence was
 |
2.3. Nanopore experiment
In the nanopore experiment, the nanopore chip was immobilized among two pieces of custom-designed Teflon chambers, which were filled with buffer (0.15 M NaCl and 
3. Results and discussion
where the average conductance blockage ΔG can be obtained from the translocation event density map of conductance blockage versus dwell time, σ is the conductivity of the solution, γ is the shape factor of the detected molecule, Λ is the volume of the detected molecule, heff is the effective thickness of the nanopore, and d is the average diameter of the nanopore. Equation (1 ) demonstrates the correlation between the average conductance blockage ΔG from nanopore experiments of detected molecules and the parameters of the nanopore. Therefore, the volume of T7 RNAP can be calculated by the above expression if all of the other parameters are known. From the T7 RNAP translocation event density map of conductance blockage versus dwell time (Fig. 2(e) ), ΔG is 2.8 nS. From the experiment conditions (salt concentration), σ is

. For sphere-like molecule such as T7 RNAP, γ = 1. The diameter of nanopore d can be obtained from TEM image, which is 10 nm for our nanopore. The effective thickness of the nanopore is obtained by a control experiment with a well-known BSA protein molecule translocation using the same nanopore (Fig. S3 of the supporting information). The calculated heff is approximately 7.2 nm (detailed calculation process can be found following Fig. S3 of the supporting information). After finding the other parameters, according to Eq. (1 ), the diameter of T7 RNAP is calculated to be 8.1 nm, in good agreement with the value obtained from x-ray crystallography,[35] which further proves the validity of nanopore experiments and calculation method.
To study the conformational change of T7 RNAP binding DNA promoter, three series of nanopore experiments were carried out where T7 RNAP sample only, DNA promoter only, and T7 RNAP complex with DNA promoter were used as three sets of target molecules, respectively. A schematic of the experimental setup is shown in Fig. 
The current baseline through the nanopore is rather smooth (Fig.
 |
 | Fig. 2. (color online) Current traces captured by Axon 200B for electrolyte (a), DNA promoter (b), T7 RNAP (c), and complex (d) obtained by a 10 nm nanopore in a condition of 0.15 M NaCl, pH = 8, and applied voltage of 100 mV. (e) Scatter plot of ΔG vs log dwell-times (td) for T7 RNAP with a 10 nm nanopore and applied voltage 100 mV. |
The bias voltage is the primary parameter that one can alter in nanopore experiment and offers the electric field force which drives the protein through the nanopore. Obviously, a larger bias can lead to a higher translocation speed of the protein across the pore, which will be reflected by shorter time durations of translocation events. Meanwhile, a larger external electric field can also cause a higher capture rate of translocating molecules.[48] Figures 

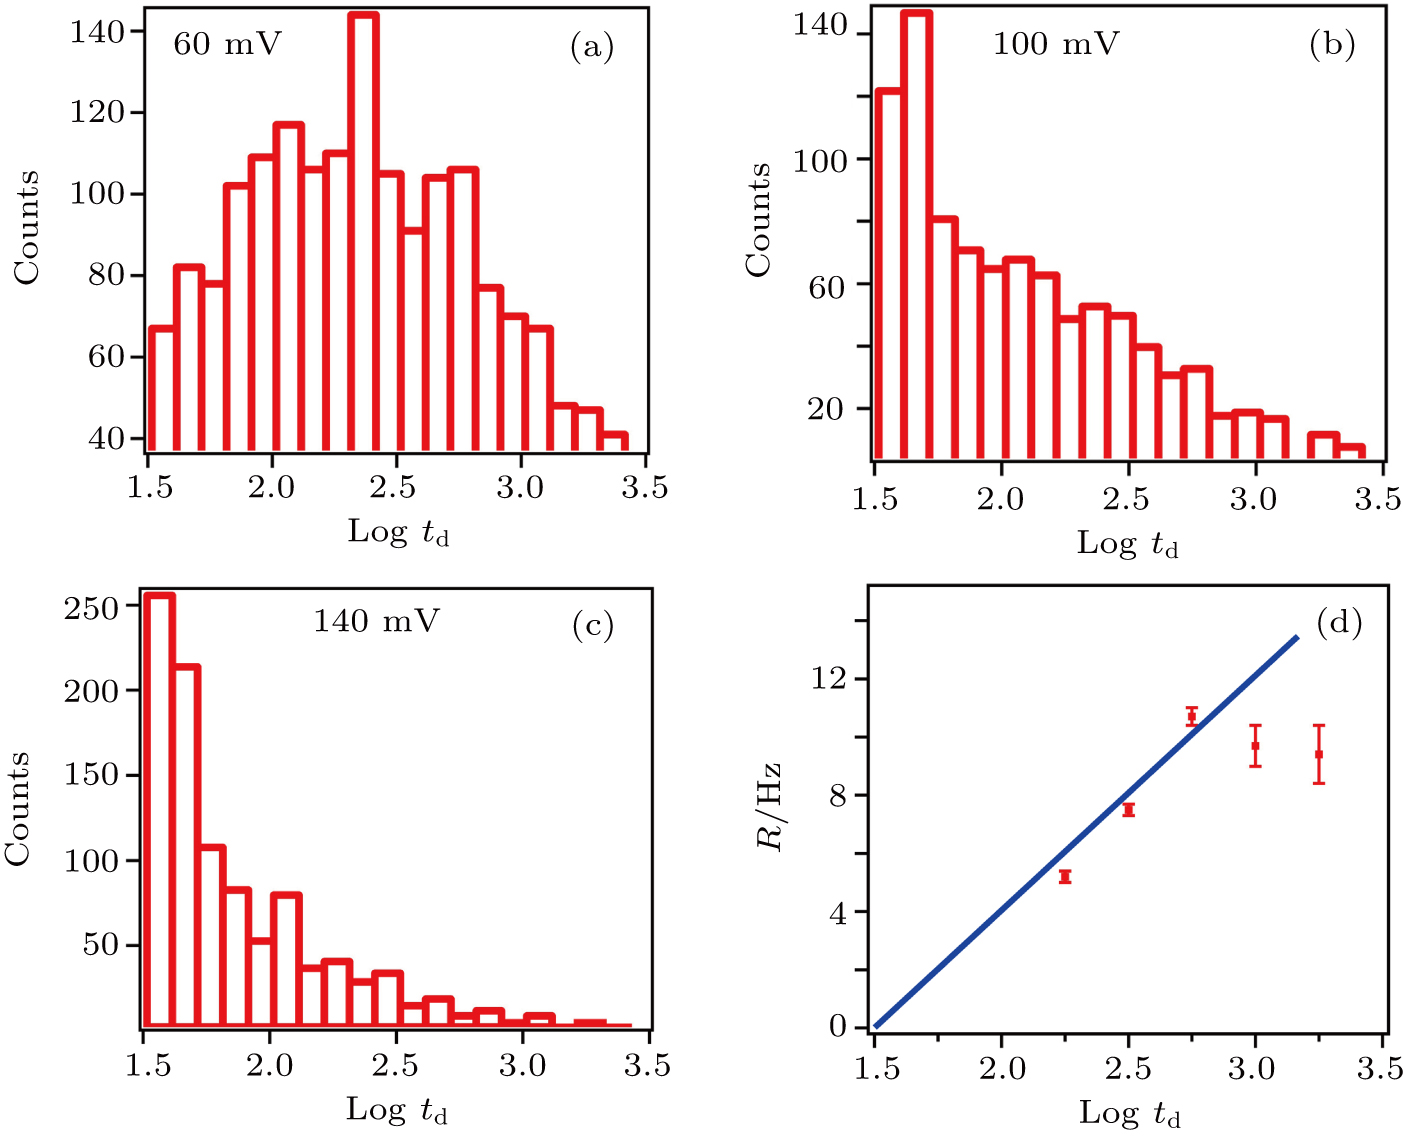 | Fig. 3. (color online) Histogram of log dwell-time (td) for T7 RNAP in certain applied voltages of (a) 60 mV, (b) 100 mV, and (c) 140 mV. (d) The capture rate as a function of applied voltage for T7 RNAP. The blue straight line is obtained by binomial fitting of first 3 points and coordinate zero. |
After analyzing the translocation events of T7 RNAP molecules, we did nanopore experiments with T7 RNAP complex. Figure 
 | Fig. 4. (color online) Color contour plots of 

|
To probe the flexibility of these two samples, we calculate the FWHM values from Gaussian fits to the fraction blockage of translocation events of T7 RNAP and complex (Figs. 
From the increase of FWHM (Figs.
4. Conclusion and perspectives
In summary, we used SiN nanopore sensor to probe T7 RNAP and its complex with DNA promoter. Duration histograms of T7 RNAP under different bias voltages indicate smooth translocation of detected molecules. Furthermore, the FWHM values of Gaussian fits to the blockade histograms of T7 RNAP and complex translocation events indicate that the complex is more flexible in our experiment. Our analysis suggests that T7 RNAPʼs flexibility changes after binding DNA promoter and this dynamic change activates a state that decreases the volume of T7 RNAP. Moreover, we calculated the decreased volume of T7 RNAP and have supposed that this decrease is caused by major component of T7 RNAP, such as thumb and fingers sub-domains. Our findings may be helpful to reveal the interaction of T7 RNAP and its promoter, and it gives an insight into the protein activity variations caused by conformational change.
Reference
| [1] | |
| [2] | |
| [3] | |
| [4] | |
| [5] | |
| [6] | |
| [7] | |
| [8] | |
| [9] | |
| [10] | |
| [11] | |
| [12] | |
| [13] | |
| [14] | |
| [15] | |
| [16] | |
| [17] | |
| [18] | |
| [19] | |
| [20] | |
| [21] | |
| [22] | |
| [23] | |
| [24] | |
| [25] | |
| [26] | |
| [27] | |
| [28] | |
| [29] | |
| [30] | |
| [31] | |
| [32] | |
| [33] | |
| [34] | |
| [35] | |
| [36] | |
| [37] | |
| [38] | |
| [39] | |
| [40] | |
| [41] | |
| [42] | |
| [43] | |
| [44] | |
| [45] | |
| [46] | |
| [47] | |
| [48] |