Probing conformational change of T7 RNA polymerase and DNA complex by solid-state nanopores
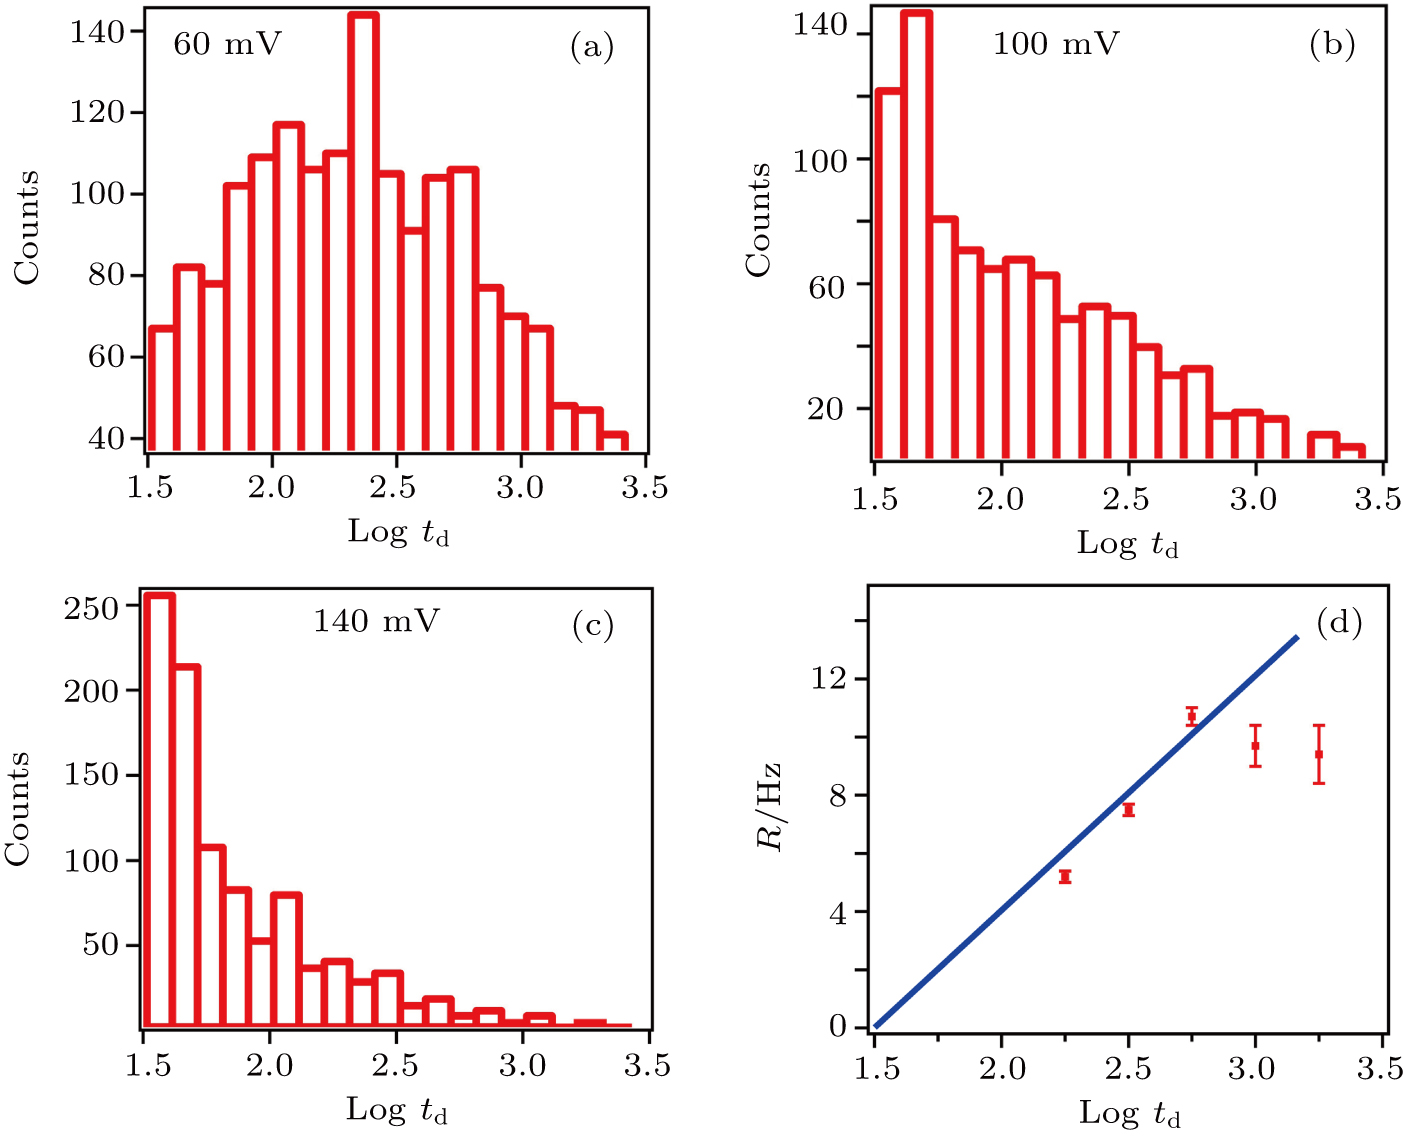
(color online) Histogram of log dwell-time (td) for T7 RNAP in certain applied voltages of (a) 60 mV, (b) 100 mV, and (c) 140 mV. (d) The capture rate as a function of applied voltage for T7 RNAP. The blue straight line is obtained by binomial fitting of first 3 points and coordinate zero.
