Ultra-low power anti-crosstalk collision avoidance light detection and ranging using chaotic pulse position modulation approach
Hao Jie, Gong Ma-li, Du Peng-fei, Lu Bao-jie, Zhang Fan, Zhang Hai-tao†, , Fu Xing‡,
Center for Photonics and Electronics, Department of Precision Instrument, Tsinghua University, Beijing 100084, China


† Corresponding author. E-mail: zhanghaitao@mail.tsinghua.edu.cn

‡ Corresponding author. E-mail: fuxing@mail.tsinghua.edu.cn

Project supported by Tsinghua University Initiative Scientific Research Program, China (Grant No. 2014z21035).

Abstract
Abstract

A novel concept of collision avoidance single-photon light detection and ranging (LIDAR) for vehicles has been demonstrated, in which chaotic pulse position modulation is applied on the transmitted laser pulses for robust anti-crosstalk purposes. Besides, single-photon detectors (SPD) and time correlated single photon counting techniques are adapted, to sense the ultra-low power used for the consideration of compact structure and eye safety. Parameters including pulse rate, discrimination threshold, and number of accumulated pulses have been thoroughly analyzed based on the detection requirements, resulting in specified receiver operating characteristics curves. Both simulation and indoor experiments were performed to verify the excellent anti-crosstalk capability of the presented collision avoidance LIDAR despite ultra-low transmitting power.

1. Introduction

With the increasing demands of the intelligent transportation system (ITS) and unmanned vehicles especially in dangerous or toxic environment, active collision avoidance has become a critical and urgent issue. Previous academic and commercial explorations on collision avoidance mainly focus on the solutions using microwave or ultrasonic sources,[1,2] compared to which the system based on light detection and ranging (LIDAR) has shown the advantage of higher spatial and temporal resolution, well suited to the modern transportation with increased complexity. Ai et al. reported a continuous-wave (CW) LIDAR operating at 635 nm with the power of several milliwatts, distance measurement ability of 200 m, and resolution of 3 m.[3] In 2011, an 808-nm coherent detection CW LIDAR with the transmitted laser power of 70 mW was proposed to obtain an enhanced resolution of 18 cm within the range of 130 m.[4] The required transmitted power as high as tens or even hundreds of milliwatts limits the miniaturization of the laser head and thus the LIDAR system. More importantly, laser source of this power level is usually operated at 532 nm, 808 nm, or 1064 nm, at which the damage threshold for human eyes is relatively low, leading to fairly high risk for eye safety in the public operational environment. To address the problem, our goal is to develop a compact eye-safe collision avoidance LIDAR with the maximum transmitting power of 100 μW at 1550 nm for a detection range of up to 500 m. The intensity of the returned signal, however, would be so weak that single-photon detection using time-correlated single photon counting (TCSPC) technology is required, which has been applied for general single-photon ranging and three-dimensional (3-D) imaging.[59] In 2007, MIT group reported a 3-D imaging single-photon LIDAR with the detection range of 150 m and the resolution of 3.65 m.[6] In 2009, a scanning time-of-flight imaging system capable of 325 m range detection and centimeter resolution was realized with an average output power of several microwatts.[9] TCSPC method has shown its excellent performance to distinguish the weak signal from a noisy background.

However, for collision avoidance scenarios, another issue, crosstalk, must be taken into consideration. As shown in Fig. 1, vehicle A transmits a laser beam and receives an echo signal reflected by vehicle B, the target, thus obtaining their separation distance according to the time-of-flight measurement. However, vehicle A also receives the signal directly transmitted by vehicle B, defined as the crosstalk in our study, which may cause reduced sensitivity or even a false alarm at the sensor of vehicle A. Since crosstalk does not follow the behavior of random noise, it cannot be eliminated through TCSPC method for the case of periodic signal. Crosstalk resistance has long been a heated topic for millimeter wave radars[10,11] and CW LIDAR,[12,13] which however applies frequency modulated continuous wave (FMCW) modulation with both time-domain and amplitude modulated. Considering the influence of atmosphere turbulence for weak or distant signal, this kind of modulation may not be suitable. Therefore, various methods inducing modulation to the emitting laser are being researched.[1416] In 2015, our group reported a chaotic pulse position modulation (CPPM) method, originally deployed for information safety considerations in optics communication,[17] to prevent range ambiguity for conventional linear detectors.[18] In our study presented here, this favorable CPPM scheme is used for ultra-low power laser transmitter and single-photon detection system, demonstrating its capability of crosstalk resistance, which will be detailed in Section 2.

Fig. 1. The collision avoidance scenario involving two vehicles.

In this paper, an ultra-low power, anti-crosstalk collision avoidance LIDAR based on single-photon detection was presented. This approach not only enjoys the advantage of compact structure and eye safety, but also, by applying the CPPM pattern, successfully solves the crosstalk issue inherent in the context of vehicle collision avoidance. Parameters including pulse rate, discrimination threshold, and accumulation periods in TCSPC are optimized according to the detection requirements. In particular, an improved receiver operating characteristics (ROC) curve against the crosstalk is developed. Theoretical simulation and indoor experiments are then performed to validate the feasibility of the scheme and corresponding parameter settings. Both demonstrate that the proposed LIDAR design has excellent anti-crosstalk capability despite ultra-low laser power.

2. Theory and modeling
2.1. Anti-crosstalk analysis of CPPM method

Figure 2 describes the time sequences of transmitted pulses from vehicles A and B (solid line), returned pulses by vehicle B (dashed line), and crosstalk directly emitted from vehicle B (dotted line), from which the performances of crosstalk resistance can be compared between the case of periodic transmitting signal and the case of CPPM transmitting signal.

Fig. 2. Time sequences of transmitted pulses from vehicles A and B (solid line), returned pulses by vehicle B (dashed line), and crosstalk directly emitted from vehicle B (dotted line).

As shown in Fig. 2, the returned pulse arrives at vehicle A at the time of TL = 2L/c, relative to the timing start triggered by the laser emission of vehicle A, where c is the speed of light and L is the distance between two vehicles. Assuming that the detector of vehicle A rearms immediately after it receives an echo, the crosstalk would arrive at vehicle A by the time Tct, that is

where Tc = L/c, m is the largest integer satisfying Tct(n) > 0, and Tlag is the original time difference between the transmitted pulse patterns from two vehicles.

For the case of periodic transmitting pulses for both vehicles, we have

where U is the total number of accumulated pulses. Thus, equation (1) can be simplified as

One can infer from Eq. (3) that when TA and TB satisfy TB = bTA (b = 1, 2, 3,…), Tct(n) would have a fixed value as

In addition, when TA and TB satisfy TA = dTB (d = 1, 2, 3…), Tct(n) would have several fixed values as

Equations (4) and (5) denote that under certain conditions stated above, the crosstalk count would be recorded at these fixed and equally spaced time bins of each period and would rapidly add up through accumulation of pulses, necessarily resulting in one or a number of false alarms. Specifically, with the reasonable assumption of TA = TB for ITS, Tct(n) has only one value. Therefore, the crosstalk would result into an extremely high peak of false alarm.

However, for the case of transmitting pulses with CPPM pattern, where {TA1, TA2, …, TAU} and {TB1, TB2, …, TBU} are respectively randomly distributed, Tct(n) is thus a random value instead of a fixed one for each storage period of TCSPC. Therefore, the crosstalk counts recorded in different periods would not add up but lead to a slight increase of the average background noise level. This is the reason why the CPPM pattern can resist the crosstalk.

2.2. System scheme

A scheme of single-photon collision avoidance LIDAR with TCSPC method is demonstrated in Fig. 3, which is also the experimental setup that will be discussed in Section 3. Two independent pulsed laser sources, representative of transmitters of two vehicles, were modulated by a field programmable gate arrays (FPGA) controller to emit pulses of periodic or CPPM pattern with tunable average repetition rate. A single photon avalanche diode (SPAD) detector was used as the receiver of vehicle A, expressing the detected events in the form of variations in voltage levels, whose rising edges were then identified and transformed into binary storage by a TCSPC. The TCSPC data was accumulated over periods, thus indicating the range information.

Fig. 3. Design scheme and experimental setup of the single-photon collision avoidance LIDAR system.
2.3. Parameter design and modeling

In our modeling, vehicles A and B are assumed to have the same transmitted laser average power of 100 μW, with the separation distance of 500 m. Table 1 illustrates the detailed system parameters used in both the simulation and experiment of our collision avoidance system.

Table 1.

Parameters of collision avoidance system.

.

The number of returned laser photons per pulse can be calculated using the LIDAR range equation. For a flat, diffusely reflecting, extended target (Lambertian target) whose area of surface is larger than the beam area, the returned signal photon per pulse Secho can be obtained[1922] using the average power of transmitted laser beam PL, the target range L, the reflectance of the target surface ρ, and the receiver aperture area AR as

where FOV2 = As/(πL2) = 0.01.

The number of crosstalk photons induced by the transmitter of vehicle B and received by vehicle A, as described in Fig. 1, can be calculated as

The sunlight inside the receiver’s FOV is also collected, resulting in the background noise in the detector. The number of incident photons of the solar radiation during single period of TCSPC (10 μs in the modeling) is calculated as

where Φ is the solar spectral irradiance for 1550 nm and Δλ is the filter bandwidth.

With Φ = 0.3 W·m−2·nm−1 and Δλ = 0.5 nm, we obtain Nn = 90.02 photons/period. Since solar photon rate is assumed to be constant during each TCSPC period, there is an equal probability for the solar photons falling in each time bin, making the number of background noise in a single bin as n = NntresRr = 9 × 10⁻³, corresponding to a photon arrival rate of 9.0 MHz.

For single photon detectors, the detection probability p follows the Poisson statistics[2327]

where Nphoton is the number of photons falling within a single bin and η is the detection efficiency of single photon detector, assumed as 45% for the device used in our experiment. Thus we have

where p0 represents the firing probability of any non-target bin, induced by the background counts, while p1s and p1c represent the probabilities of firing for the expected echo bin and the crosstalk bin, respectively.

The SPD output can be described statistically as a Bernoulli process, since only one of the two outcomes (detected or not) can occur for each single TCSPC time bin. For a given threshold Th and an accumulation number of pulses U, the probability of detection Pdect_sig and the probability of false alarm in a single bin Pfa_single are given as

Based on the probability of false alarm in a single bin, the total probability of false alarm can be expressed as

where Nbin = (tresRr)−1 is the number of range bins during a single storage period of TCSPC.

To ensure the system stability, the total false alarm probability is required to be Pfa < 5% while the detection probability is required to be Pdect_sig > 95%, yielding the requirement on the probability of single bin false alarm as Pfa_single < 5.13 × 10⁻⁶. Besides, the photon level of background random noise can be calculated to be 4 × 10⁶ s−1, i.e., the product of single bin false alarm probability of 0.004, as given in Eq. (7), and the total number of time bins per second of 109.

In order to extract the range information from the echo, the performance of p0 and p1s is firstly evaluated. A family of ROC curves[25] is computed to appropriately determine the number of pulses U required to build up the histogram as well as the detection threshold to identify the target, as shown in Fig. 4. ROC curves with U = 170, 180, 190, and 200 are depicted, along each of which there are a series of discrete data points, whose integer detection thresholds are incremented successively by one, beginning from the right end with the threshold of zero and Pfa_single being unity towards the left. It is only those data points both located at the left side of the vertical dashed line and above the horizontal dashed line in Fig. 4 can satisfy the requirements of detection probability and false alarm probability, with their detection thresholds indicated by the digits inside the boxes.

Fig. 4. ROC curves that consider only the signal and background noise, drawn with the number of accumulated pulses U = 170, 180, 190, and 200. Here, Secho = 0.16, n = 0.009.

For the above-mentioned ROC curves, merely the signal and the random noise are considered. With the crosstalk taken into account in the following, which would increase the noise level, a different selection of threshold and number of accumulation period is needed for signal identification.

The probability of false alarm in a single bin with crosstalk considered, p0_new, is adjusted as

where fct and fs are respectively the average repetition rate of the crosstalk and the signal. Due to the great amount of crosstalk photon number, it would definitely trigger a detector response for each crosstalk pulse that p1c = 1. But the TCSPC period is decided by the repetition rate of the signal rather than that of the crosstalk, leading to the number of crosstalk-induced events per period expressed as fct/fs. Thanks to CPPM pattern, the detection events would happen in random bins independent of the TCSPC timing. Thus the probability for each bin of detecting the event would be (fct/fs)/Nbin. The ROC curves taking crosstalk into account are shown in Fig. 5, with the signal average repetition rate of 100 kHz, and the crosstalk repetition rate of 100 kHz and 2 MHz respectively. Only the discrete data points along the ROC curves that satisfy the detection requirements were drawn in Fig. 5, with respective threshold represented by the digit inside the box.

Fig. 5. Improved ROC curves taking crosstalk into account, with the signal repetition rate of 100 kHz and the crosstalk repetition rate of (a) 100 kHz; (b) 2 MHz.

The ROC curves considering the crosstalk in Fig. 5 offer an important guideline for the selection of accumulation number of pulses as well as the detection threshold, according to a certain requirement on the probabilities of detection and false alarm in a single bin. The design process is not only valid specifically for single-photon collision avoidance LIDAR, but can also be applied to any other single-photon detection scenarios involving crosstalk. It is obvious from Fig. 5 that more options of detection threshold are available with larger number of accumulation pulses. Comparison between the improved ROC curves in Figs. 5(a) and 5(b) reveals that the scheme with a detection threshold of 8 succeeds to distinguish the target from 100 kHz crosstalk but fails for the case of 2 MHz crosstalk and 200 pulse accumulation, according to the probability requirements of detection and false alarm in a single bin. In order to resist the crosstalk with the repetition rate of up to 2 MHz, 20 times the signal repetition rate, a scheme of 200 pulse accumulation with a detection threshold of 9 is chosen for the simulations and experiments below.

Applying the optimized scheme of 200 pulse accumulations with the detection threshold of 9, simulations using Matlab were conducted with the results shown in Fig. 6. The three columns from left to right in Fig. 6 describe the case of periodic signal against periodic crosstalk, CPPM signal against periodic crosstalk, and CPPM signal against CPPM crosstalk respectively. The upper and lower rows respectively discuss the cases with crosstalk having the average repetition rate of 100 kHz and 2 MHz. Figures 6(a) and 6(d) in the first column illustrate that the periodic signal does not have the capability to resist periodic crosstalk, causing several peaks, whose number is d = TA/TB as in Eq. (5), with fairly high counts (approaching the total number of accumulation periods), inevitably resulting in one or several false alarms. The other two columns demonstrate excellent performance of crosstalk resistance, due to the signal of CPPM pattern. In addition, the anti-crosstalk capability of CPPM signal is valid for the cases with crosstalk repetition rates of both 100 kHz as shown in Figs. 6(b) and 6(c), and 2 MHz as shown in Figs. 6(e) and 6(f), while the rise of repetition rate only increases the average noise level from 2 to 4. In comparison, for the case of periodic signal the number of crosstalk peaks increases along with the crosstalk repetition rate, as shown in Figs. 6(a) and 6(d). Further increase of crosstalk repetition rate beyond 2 MHz may need a different extraction scheme by adjusting the ROC curves according to a larger crosstalk level.

Fig. 6. Simulation results for anti-crosstalk performances: (a) 100 kHz periodic signal against 100 kHz periodic crosstalk, (b) 100 kHz CPPM signal against 100 kHz periodic crosstalk, (c) 100 kHz CPPM signal against 100 kHz CPPM crosstalk, (d) 100 kHz periodic signal against 2 MHz periodic crosstalk, (e) 100 kHz CPPM signal against 2 MHz periodic crosstalk, (f) 100 kHz CPPM signal against 2 MHz CPPM crosstalk.

An initial conclusion can be made according to the theoretical simulation that the signal of CPPM pattern has outstanding anti-crosstalk capability, regardless of the crosstalk pattern and the crosstalk average repetition rate, which may need verification in the experiments stated in the following.

3. Experimental results and discussion

An indoor experiment was conducted to verify the anti-crosstalk capability of CPPM pattern, with the experimental setup shown in Fig. 3. A TCSPC (PicoQuant 260 Nano) was used with a resolution of 1 ns and a maximum count rate of 109 s−1. According to the system parameter design in Section 2, a pulse train of CPPM pattern from FPGA with the average repetition rate of approximately 100 kHz was used to simultaneously trigger laser A and the TCSPC timing start. An experiment with periodic transmitting signal was also carried out for comparison. The output pulses from the laser B were attenuated to 6.66 photons per pulse using an attenuator, ensuring a detected event for every shot at a probability of 95%. Further enhancement of the crosstalk photon level, which would not exert significant influence on its detection efficiency, was not implemented to prevent the after pulsing effect in the SPAD. The trigger signal of laser B is independent to that of laser A and TCSPC.

A CW laser source was applied to introduce the background noises, the output of which was attenuated before being coupled into a 300-m-long fiber together with the attenuated output from laser A. Then, the output pulses from the fiber were combined with attenuated output from laser B, and then arrived at the detector. The fiber-coupled SPAD detector was operated at the bias voltage of 46 V, with the gate frequency of 100 MHz and the dark count measured as 100 s−1 that is negligible compared to the signal rate of 100 kHz, marking the detection events with successive high voltage levels with the pulse width of 5 ns. The photon level induced by the CW laser was set to be around 4 × 10⁶ s−1, measured at the detector with laser A and B turned off, to realize the same level as that used in the modeling.

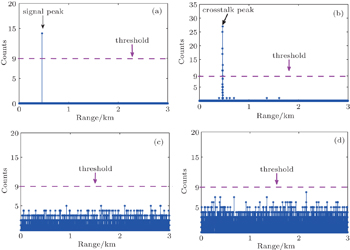
The experimental environment test results are described in Fig. 7. By adjusting the attenuator, the signal intensity after passing the delay fiber is attenuated to cause a detection probability of 7%, corresponding to a signal count of 14 for 200 pulses accumulation, which is in accord with the signal test result shown in Fig. 7(a). In Fig. 7(b) the 100 kHz periodic crosstalk counts were recorded with 100 kHz periodic trigger at TCSPC, obtaining the total count of 200 for 200 pulse accumulation, which however was not located in a single bin but with partial counts dispersed in several adjacent bins. This is due to uncertainty between the repetition rate of trigger and crosstalk, caused by the limited precision of the crystal oscillator embedded in FPGA. Figures 7(c) and 7(d) describe the background noise combined with 100 kHz and 2 MHz crosstalk respectively, with 100 kHz CPPM trigger applied to the TCSPC timing start. The figures demonstrate a higher noise level for the latter case, indicating that an adjustment of ROC curve is mandatory in response to variations in repetition rate or other parameters that may influence the photon level.

Fig. 7. Experimental environment test results: (a) 100 kHz CPPM signal only with TCSPC triggered by CPPM pattern, (b) 100 kHz periodic crosstalk only with TCSPC triggered by 100 kHz periodic pattern, (c) 100 kHz periodic crosstalk enhanced background with TCSPC trigged by 100 kHz CPPM pattern, (d) 2 MHz periodic crosstalk enhanced background with TCSPC triggered by 100 kHz CPPM pattern.

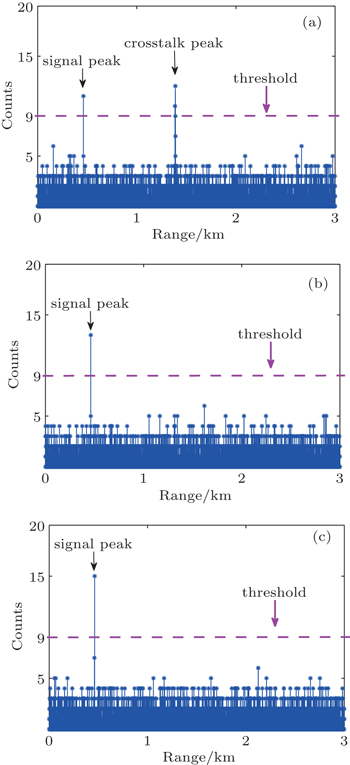
Figures 8 and 10 illustrate the results of proof-of-concept experiments with TCSPC accumulation over 200 pulses. In Fig. 8, both the signal and crosstalk are kept at an average repetition rate of 100 kHz to be in accord with the system design. Figure 8(a) is the experimental result for the case of periodic signal and periodic crosstalk. It can be seen that in addition to a detected signal peak beyond the applied detection threshold with the count of 11, there is a crosstalk peak with even higher counts. Figures 8(b) and 8(c) show the cases of CPPM signal, with periodic crosstalk and CPPM crosstalk respectively. It should be noted that for both cases the undesirable crosstalk peak was successfully removed at the detection threshold of 9, ensuring only the signal peak indicating accurate range information was detected. Further considerations of 100 kHz periodic signal with CPPM crosstalk are also shown in Fig. 9, where a correct signal peak stands out without crosstalk from vehicle B, from which we can deduce that the CPPM regime cannot only avoid a false alarm for the vehicle applying this regime, but also is good to vehicles using conventional repetition rate signal regime.

Fig. 8. The 200 pulse accumulation result, with a threshold of 9 illustrated. The signal and crosstalk were both sent in a rate of approximately 100 kHz: (a) 100 kHz periodic signal against 100 kHz periodic crosstalk, (b) 100 kHz CPPM signal against 100 kHz periodic crosstalk, (c) 100 kHz CPPM signal against 100 kHz CPPM crosstalk.
Fig. 9. The 100 kHz anti-crosstalk result for repetition rate signal with repetition rate crosstalk.
Fig. 10. Experimental results with 100 kHz CPPM signal against 2 MHz CMMP crosstalk.

Furthermore, experimental result with 100 kHz CPPM signal against 2 MHz periodic crosstalk is described in Fig. 10, with the maximum background count of 7, which is closer to the threshold of 9 compared to the case with 100 kHz crosstalk described in Fig. 8(c). Suppose that the detection threshold was set at 8 instead of 9 in Fig. 10, there would be a much higher risk for a certain background peak to be mistaken as a signal, in agreement with the prediction in Fig. 5(b) that the scheme with detection threshold of 8 is not available for the case of 2 MHz crosstalk. The experimental observations demonstrated in Figs. 8 and 10 are nicely consistent with the simulation results, which verify the parameter design and prove the advantage of CPPM signal in crosstalk resistance.

4. Conclusion

In this paper, a novel concept of collision avoidance single-photon LIDAR for vehicles has been presented, in which the CPPM pattern was applied to the transmitting pulse train to solve the crosstalk problem for ITS system. To extract signal from strong background and crosstalk photon level, ROC curves taking into account the crosstalk issue were proposed to optimize the required number of accumulation pulses and the detection threshold, whose validity has been verified. Both theoretical simulations and indoor experiments were performed, which demonstrated that the proposed LIDAR concept using CPPM approach has excellent anti-crosstalk capability despite ultra-low laser power, and suggests that a vehicle equipped with single-photon CPPM collision avoidance LIDAR is immune to the crosstalk from other vehicles, regardless of transmitting pattern (periodic or CPPM) and crosstalk repetition rate. Free-space experiments of collision avoidance single-photon LIDAR using CPPM approach will be carried out in the near future.

Reference
1Borenstein JKoren Y 1995 IEEE Trans. Robotics Automat. 11 132
2Sahawneh LMackie JSpencer JBeard RWarnick K 2014 J. Aerosp. Inform. Syst. 1
3Ai XNock RRarity JDahnoun N 2011 Appl. Opt. 50 4478
4Zhao TWang BWang AWang Y2011J. Meas. Sci. Insrum.2398
5Verghese SMcIntosh KLiau ZSataline CShelton JDonnelly JFunk JYounger RMahoney LSmith GMahan JChapman DOakley DBraatain M 2009 Proc. SPIE 7320 73200M
6Vaidyanathan MBlask SHiggins TClifton WDavidsohn DCarson R 2007 Proc. SPIE 6550 65500N
7Marino RRichardson JGarnier RIreland DBickmeier LSiracusa CQuinn P 2009 Proc. SPIE 7323 7323H
8AullB Loomis AYoung DStern AFelton BDaniels P 2004 Proc. SPIE 5353 105
9McCarthy ACollins RKrichel NFerandez VWallace ABuller G 2009 Appl. Opt. 48 6241
10Brooke G 2007 IEEE Trans. Electromagnetic Compatibility 49 170
11Goppelt MBlocher HMenzel W2001Proceedings of the 6th German Microwave Conference14
12Matthey RMitev V 2005 Opt. Lasers Eng. 43 557
13Shi GZhang FQu XMeng X2014Acta Phys. Sin.6314208(in Chinese)
14Song SXu LZhang HGao NShen Y 2015 Chin. Phys. 24 057201
15Zhao RXia HDou XSun DHan YShang MGuo JShu Z 2015 Chin. Phys. 24 24218
16Du JRen DZhao WQu YChen ZGeng L2014Chin. Phys. B2224211
17Zhang HGong MWang DYu DCui RYan PChen GLiu QZhang K 2005 Opt. Eng. 44 085001
18Du PGeng DWang WGong M 2015 Opt. Eng. 54 114102
19Amann MBosch TLescure MMyllyla RRioux M 2001 Opt. Eng. 40 10
20Pfennigbauer MUllrich A2007Elektrotechnik & Informationstechnik124180
21Kim SLee IKwon Y 2013 Sensors 13 8461
22Oh MKong H2009Lasers & Electro Optics & The Pacific Rim Conference on Lasers and Electro–Optics121–210.1109/CLEOPR.2009.5292712
23Gatt PJohnson SNichols T 2009 Appl. Opt. 48 3261
24Johnson S 2012 Appl. Opt. 51 4139
25Milstein AJiang LLuu JHines ESchultz K 2008 Appl. Opt. 47 296
26Fouche D 2003 Appl. Opt. 42 5388
27Gatt PJohnson SNichols T 2007 Proc. SPIE 6550 65500I