Controlled generation of cell–laden hydrogel microspheres with core–shell scaffold mimicking microenvironment of tumor
Li Yuenan1, Hai Miaomiao1, Zhao Yu2, Lv Yalei1, He Yi1, Chen Guo1, Liu Liyu1, Liu Ruchuan1, ‡, Zhang Guigen2, §
Department of Physics, Chongqing University, Chongqing 401331, China
Department of Biomedical Engineering, University of Kentucky, Lexington, KY 40506, USA


† Corresponding author. E-mail: phyliurc@cqu.edu.cn guigen.bme@uky.edu

Project supported by the National Natural Science Foundation of China (Grant Nos. 11474345, 11674043, and 11604030) and the Fundamental and Advanced Research Program of Chongqing (Grant No. cstc2018jcyjAX0338).

Abstract

Development of an in vitro three-dimensional (3D) model that closely mimics actual environment of tissue has become extraordinarily important for anti-cancer study. In recent years, various 3D cell culture systems have been developed, with multicellular tumor spheroids being the most popular and effective model. In this work, we present a microfluidic device used as a robust platform for generating core–shell hydrogel microspheres with precisely controlled sizes and varied components of hydrogel matrix. To gain a better understanding of the governing mechanism of microsphere formation, computational models based on multiphase flow were developed to numerically model the droplet generation and velocity field evolution process with COMSOL Multiphysics software. Our modeling results show good agreement with experiments in size dependence on flow rate as well as effect of vortex flow on microsphere formation. With real-time tuning of the flow rates of aqueous phase and oil phase, tumor cells were encapsulated into the microspheres with controllable core–shell structure and different volume ratios of core (comprised of alginate, Matrigel, and/or Collagen) and shell (comprised of alginate). Viability of cells in four different hydrogel matrices were evaluated by standard acridine orange (AO) and propidium iodide (PI) staining. The proposed microfluidic system can play an important role in engineering the in vitro micro-environment of tumor spheroids to better mimic the actual in vivo 3D spatial structure of a tumor and perfect the 3D tumor models for more effective clinical therapies.

1. Introduction

With the continuing increase in the rate of its incidence and mortality, cancer has become a pressing health issue around the world and has been receiving increased attention. Breast cancer is the most common type of cancer for women and is estimated to account for 15% of the confirmed cancer cases in 2015.[1] To develop effective cancer therapies, a suitable cell culture system has to be utilized. Studies have shown that almost all cells in vivo are exposed to a 3D environment containing various types of cells and complex extracellular matrix (ECM).[2,3] In traditional two-dimensional (2D) cell culture systems, cells can only attach to the flat solid surface of a petri dish, lacking cell–cell and cell–ECM interactions. Thus, the formation of 3D structure cannot be studied, not to mention the interaction between cancer cells and the 3D environment.[4,5] Moreover, it has been reported that in vitro cell cultures in 3D environment are advantageous over those in 2D environment for oncology studies, such as signal transduction, protein and gene expression.[2,69] Although a lot of efforts have been made during the past years, constructing an in vitro tumor model with complex ECM micro-environment remains a long-term challenge.

To overcome the disadvantages in 2D cell culture, an efficient model of 3D cell culture like multicellular tumor spheroids (MCTs) has been studied. MCTs can better mimic the actual 3D structural organization presented by solid tumors.[5,10] Several methods have been developed over the years to form MCTs, such as hanging drop,[11,12] spinner flasks,[13] ultra-low attachment plates,[14] and microfluidics.[15] Among these methods, microfluidic encapsulation of cells within hydrogel material has attracted more attention because it has unique advantages over traditional technologies including: (i) continuous, high-throughput and highly monodisperse production of 3D hydrogel-based cellular micro-environments with precisely controlled sizes, components and mechanical properties of hydrogel matrix;[16,17] and (ii) high porosity of hydrogel matrix, which guarantees good permeability of gas and liquid and provides a suitable growing condition for cell growth.[18]

To date, hydrogel scaffold materials of cell culture can be divided into two types: synthetic and natural. Alginate is a widely-used type of natural hydrogel with excellent biocompatibility and easy availability.[1922] In previous studies, normally only one kind of hydrogel material was utilized to generate cell–laden hydrogel microspheres.[22,23] However, a basic in vitro 3D ECM model for reconstructing the actual environment of breast tumor should at least include both the basement membrane (Matrigel) and the interstitial matrix (Collagen).[24,25] Matrigel, mainly composed of proteins of ECM, optimizes spatial architecture of MCTs and facilitates cell function and behavior.[26,27] Collagen I is the major component of the naturally-derived matrix and plays an important role in cell proliferation and migration.[28,29] To create microspheres containing multiple hydrogel materials, microfluidic chips were utilized to fabricate emulsions with core–shell structure in a single step, allowing precise adjustment of the core size and shell thickness, as well as the heterogeneous micro-environment of core–shell droplets.[30] The heterogeneous structure provides a more efficient platform for oncology studies, such as cancer cells metastasis and heterotypic cell–cell interactions.

Core–shell hydrogel microspheres are designed to provide more effective in vitro tumor models, given that Matrigel and Collagen I are the major components of the ECM in breast tissue. In this paper, we present a droplet-based microfluidic device for generating heterogeneous core–shell microspheres which incorporate ECM components including both Matrigel and collagen I. The microfluidic device can be used as a robust platform for generating core–shell hydrogel microspheres with precisely controlled sizes and varied components of hydrogel. The dynamics of droplet generation and velocity field evolution in the microfluidic device were investigated by both experiments and numerical simulation. The simulation results demonstrate good agreement with experimental observations. We can adjust the composition of core and shell in real-time by adjusting the flow rate of the inner and outer aqueous phase. the variability of the compositions of core and shell makes it a robust platform for real-time study. In the core, 3D hydrogel environment with the addition of ECM components including both collagen I and reconstituted basement membrane provides a good growth micro-environment for cells compared with those containing only one kind of hydrogel material. Cell growth in different hydrogel components was also evaluated in detail.

2. Simulation section

The phase field method is adopted to solve the evolution of interface between immiscible aqueous and oil phase. The interfacial layer between aqueous and oil phase is governed by a phase field variable ϕ, which takes a value from –1 (pure aqueous phase) to 1 (pure oil phase). The velocity and pressure field is governed by the Navier–Stokes equation: where ρ is the density of fluid, u is the fluid velocity, p is the hydrodynamic pressure, η is the viscosity of fluid and f is the volume force density generated by surface tensions. ρ and η can be expressed as function of the corresponding values of aqueous and oil phase via variable ϕ as: The motion of aqueous-oil interface can be solved by the following two differential equations: where γ is the mobility, λ is the mixing energy density, ε is a measure of interface thickness and ψ is the free energy. The mobility and interface thickness are linked by the mobility tuning factor χ through following equation

The Two-Phase flow, phase field module in COMSOL Multiphysics 5.3a was employed to numerically model the droplet generation and analyze the change of flow field in 2D geometry. The geometry used in the computational work was the same as that used in the experiments. Sodium alginate solution was chosen as the aqueous phase, and fluorinated carbon oil supplemented with 1-wt% biocompatible surfactant was used as the oil phase. The aqueous phase has a viscosity of 8 mPa·s and a density of 1250 kg/m3 while the oil phase has a viscosity of 1.24 mPa.s and a density of 1614 kg/m3. Surface tension values of 0.037 N/m and 0.0162 N/m were assigned to the aqueous and oil phase, respectively.

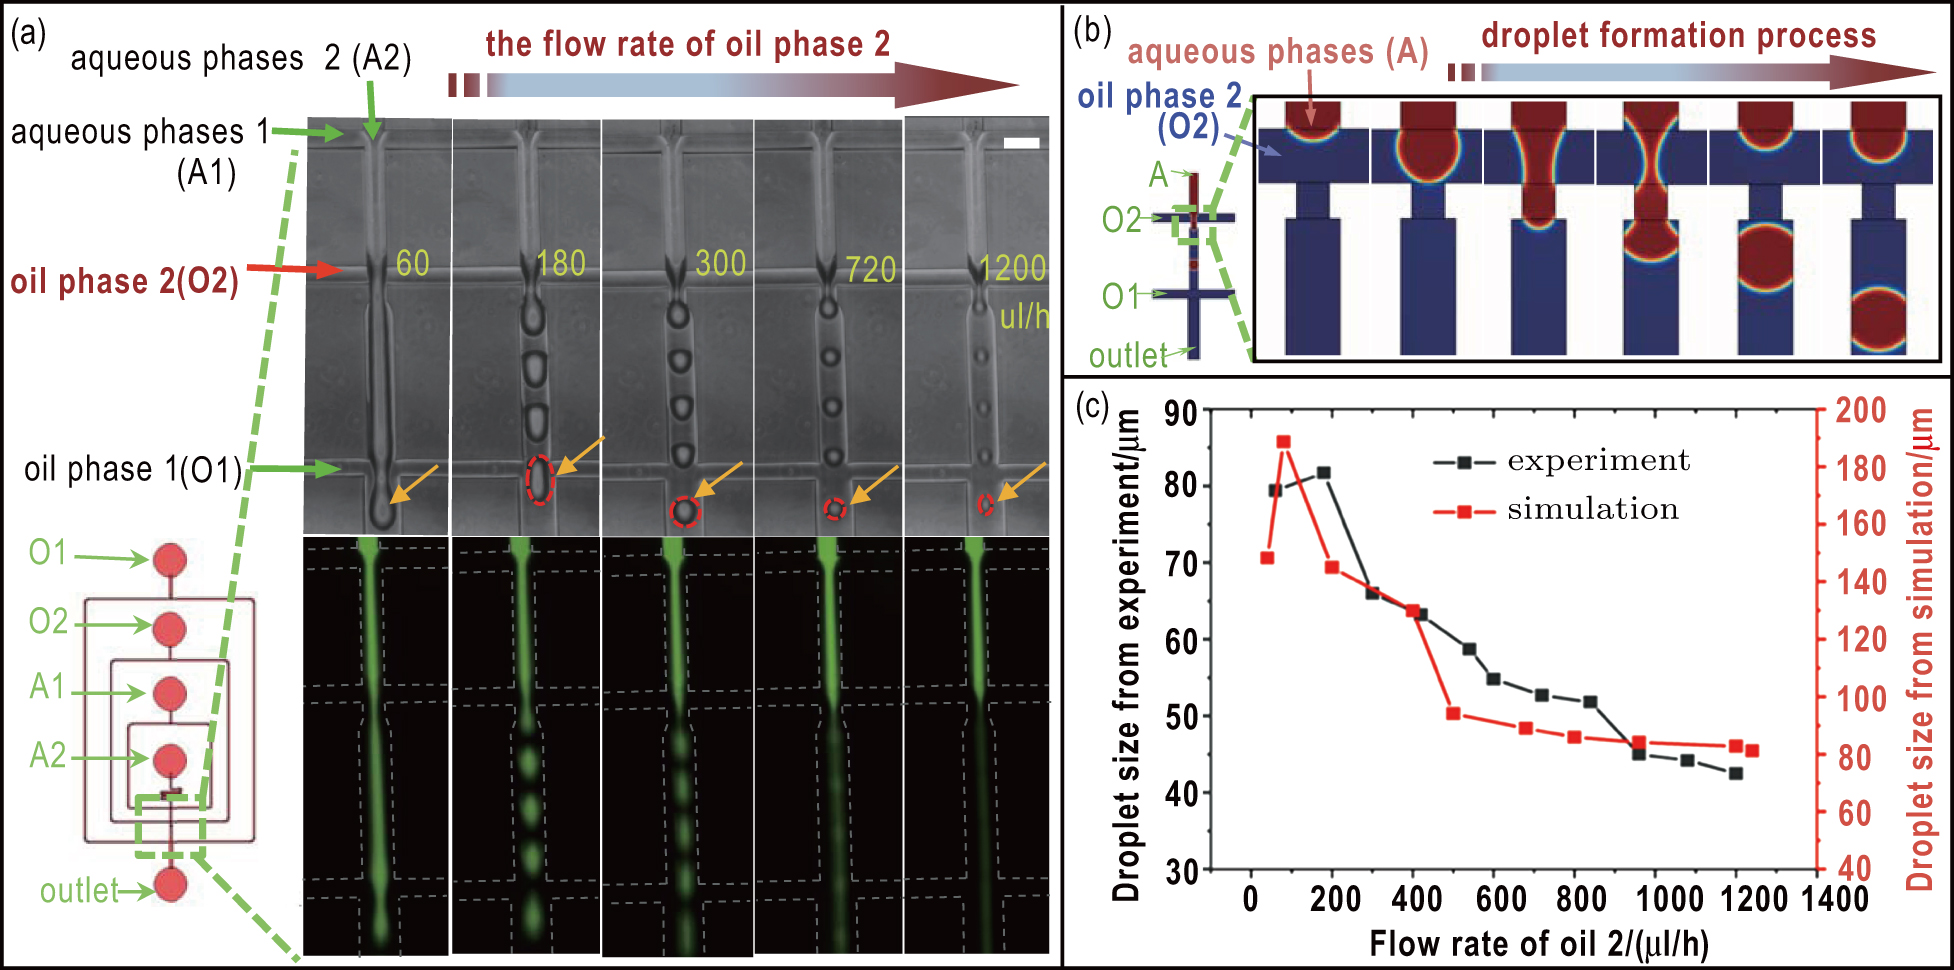
For the boundary conditions, the velocity of aqueous phase and phase field variable ϕ = –1 were assigned to the top inlet A as shown in Fig. 2(b), indicating 100% aqueous phase. Velocity of corresponding oil phase and phase field variable ϕ = 1 were applied to the two sets of side outlets, respectively. The bottom boundary was set as the outlet with zero pressure. No slip wall condition and wetted wall condition with a contact angle of 45° were applied to the other boundaries.

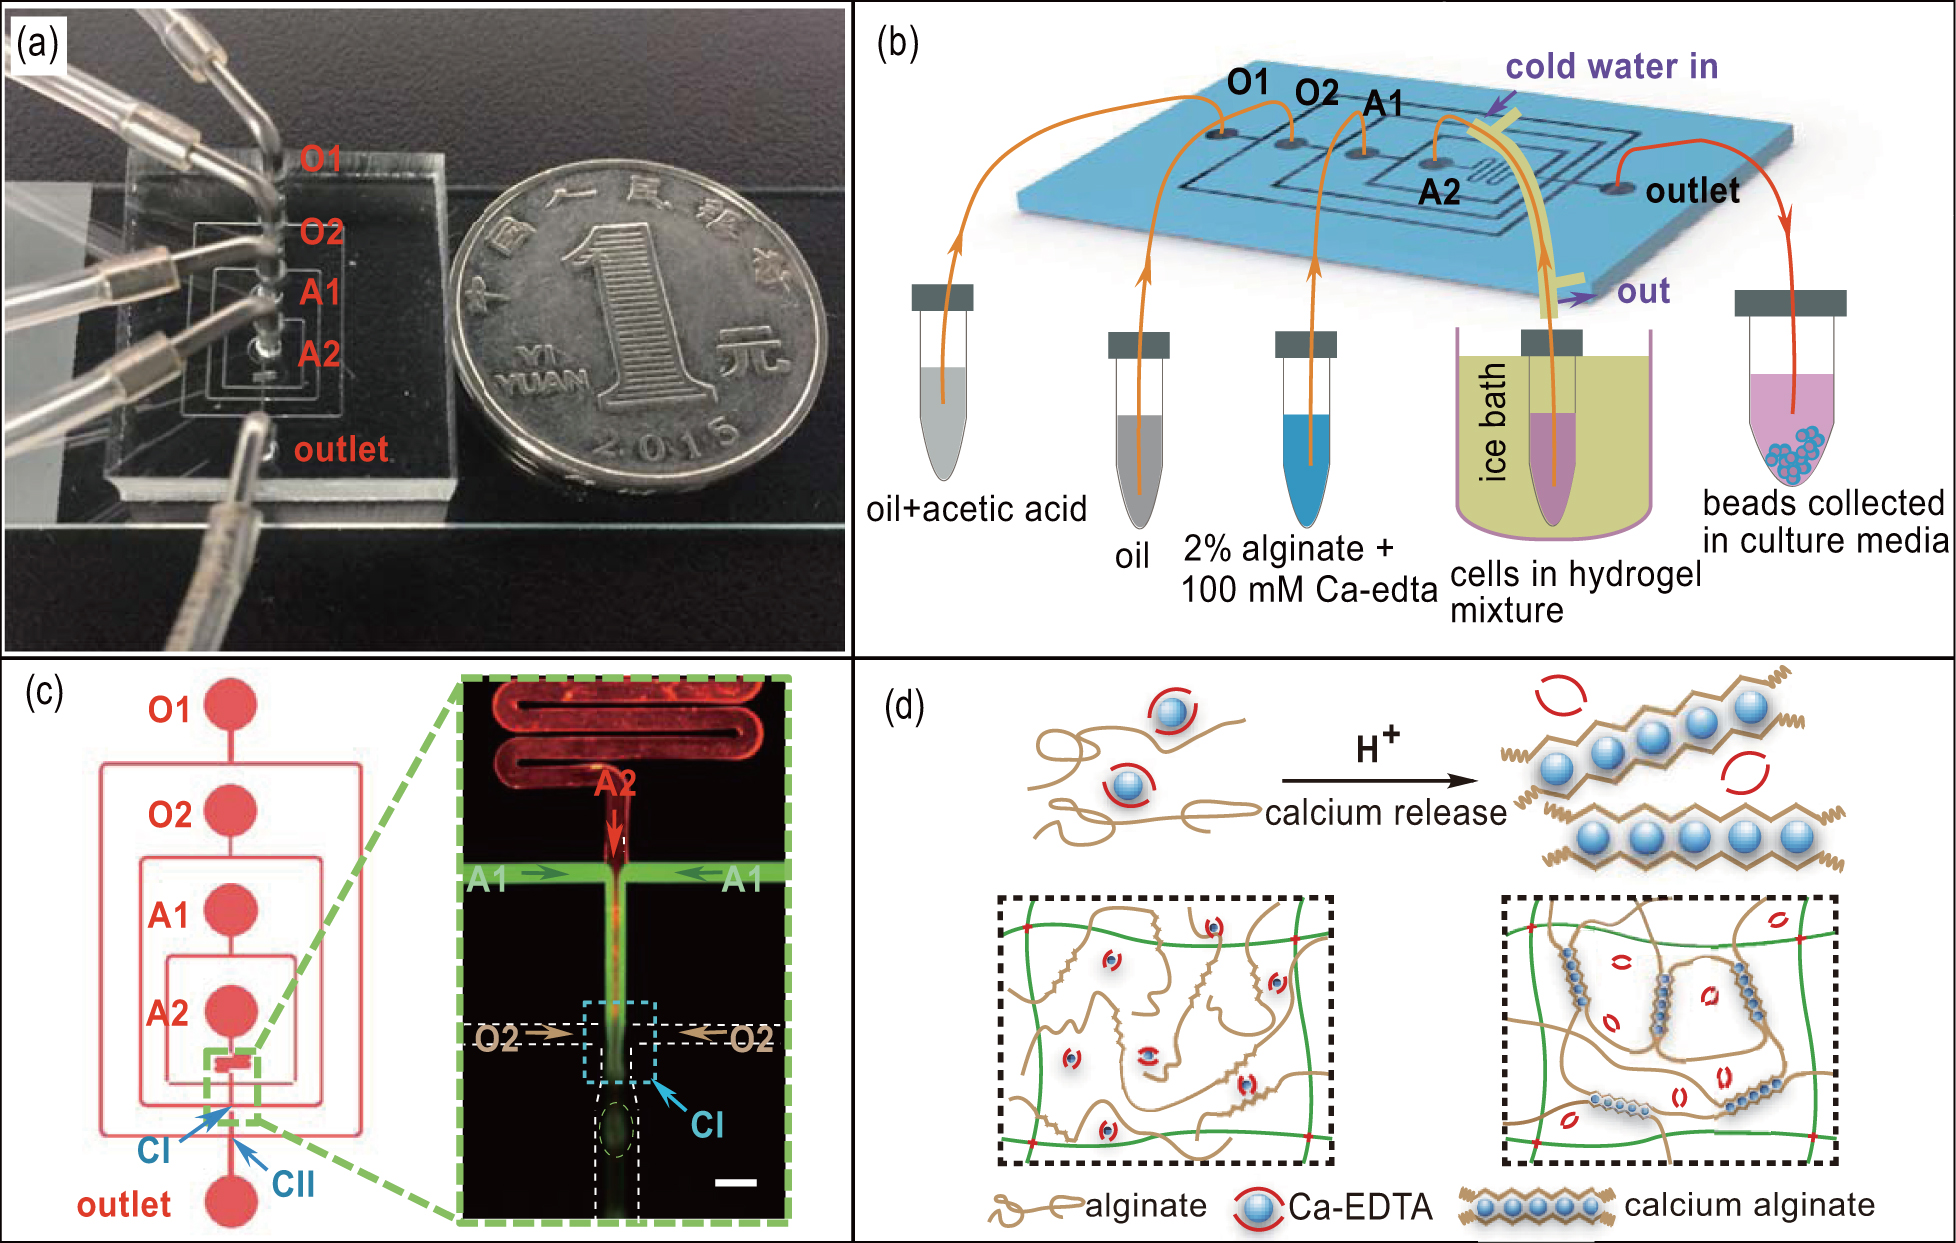
Fig. 1. (color online) The 3D microfluidic chip for droplets generation. (a) An overall view of the microfluidic chip with oil phase (O1, O2) and aqueous phase (A1, A2) supply tubes linked, placed beside a coin; (b) 3D schematics of the microfluidic chip; (c) Left: top view of the microfluidic chip designed with the Ledit software (Tanner EDA). Right: microscopic image showing the formation of droplets of two aqueous phase (green and red). This microscopic image was taken in bright field and processed with ImageJ. The scale bar is 200 μm. (d) Reaction scheme for the crosslinking process. When the pH is reduced, calcium ions are gradually released from calcium-EDTA to trigger the gelation of water-soluble alginate.
Fig. 2. (color online) Droplets with tunable sizes are generated using the chip by experiment and simulation. (a) With increasing flow rates of oil phase 2, droplet size decreases. The scale bar is 200 μm. (b) Simulation results of dynamics of droplet generation. The flow rate of the oil phase 2 (VO2) and aqueous phase (VA) were 300 μL/h and 120 μL/h, respectively. (c) Simulation and experimental results for the influence of the flow rate of oil phase 2 on the droplet size. Both simulation results and experimental measurement show similar effect: With increased flow rates of oil 2, droplet size decreased.
3. Experimental section
3.1. Fabrication of the PDMS microfluidic chip

We used soft lithographic technique[31,32] to fabricate the PDMS microfluidic chip for droplets formation. Briefly, the pattern of PDMS chip was designed with the L-edit software (Tanner EDA). The designs were then printed onto a 5-inch (1 in = 2.54 cm) chrome mask using a laser writer (Heidelberg DWL2000 Mask Writer). Silicon wafers were carefully cleaned and spin-coated with positive photoresist (ECL3027). The photoresist pattern was created by standard UV lithography techniques. After development, the silicon was treated by O2 plasma to remove the residual photoresist outside the microchannel pattern. Then the exposed silicon regions were etched down to 150 μm. The fabricated silicon wafer was transferred to a plastic 100-mm diameter petri dish to be used as the master mold. Poly(dimethyl siloxane) (PDMS, Dow Corning) was first mixed well with curing agent (Dow Corning) in 10:1 (w/w). The PDMS mixture was then poured onto the master mold to degas in a vacuum desiccator for 15 minutes and cured as PDMS in 60 °C oven for 2 h. Next, a commercially available 2-mm diameter punch (Harris Uni-Core) was utilized to punch the through-holes at each channel inlet and outlet. Subsequently, the PDMS replicas of the desired pattern were bonded to glass slides after oxygen plasma treatment. To avoid wetting of the channel of microfluidic chip by water phase and ensure stabilized droplet production, all of the fabricated channels in microfluidic chip were treated with commercial water repellent Aquapel (PPG Industries, USA).[33]

3.2. Solution preparation

The sodium alginate powder (Sigma–Aldrich) was dissolved in cell culture medium to a final concentration of 2% (w/v). The calcium-EDTA solution (100 mM) was prepared by using a solution of calcium chloride (Sigma–Aldrich) mixed with disodium-EDTA (Sigma–Aldrich) at a ratio of 1:1 (v/v). Subsequently, the pH value of the calcium-EDTA solution was adjusted to 7.2 using 1-mol/L NaOH (Fluka).

The alginate mixture for droplet generation was obtained by mixing 2% sodium alginate with 100-mM calcium-EDTA at the volume proportion of 1:1, and then vortexed to ensure thorough mixing of the two solutions.[22] To prevent clogging in microfluidic chips and sterilize the solution, alginate mixture was filtered using 0.2-μm syringe filters (Millipore) to remove any clumps of alginate or bacteria.[34] The alginate/calcium-EDTA solution was utilized as the aqueous phase for droplet generation.

The oil phase used in our study was fluorinated carbon oil (HFE7500, 3 M) supplemented with 1-wt% biocompatible surfactant (RainDance Technologies) and with or without 0.15% (v/v) acetic acid.[22] To stabilize the monodispersed droplets, the surfactant was used to prevent uncontrolled droplet coalescence prior to gelation. The acetic acid can reduce the pH level of dispersed aqueous phase, and eventually lead to alginate gelation.

3.3. Hydrogel microspheres formation

The microfluidic chip with a flow-focusing geometry was utilized in our study to generate highly monodisperse alginate droplets.[35,36] By using a long tube with 0.8-mm inner diameter and 2.4-mm outer diameter, the inlets of microfluidic chip were connected to plastic syringes (BD Falcon) with 19-gauge flat tip needles, and the outlet was also routed into a plastic centrifuge tube (Corning) for droplets collection as shown in Fig. 1(a). During the formation of cell–laden hydrogel microspheres, an ice bath and ice–cold concentric tubes were necessary to keep the thermosensitive hydrogel at a low temperature condition as shown in Fig. 1(b). Aqueous phase and oil phase were charged in separate plastic syringes and introduced to the microfluidic chip by syringe pumps (LSP01-1A, Baoding Longer Precision Pump Co., Ltd., China).

3.4. Cell culture and encapsulation

Human breast carcinoma cell line MDA-MB-231 (China Infrastructure of Cell Line Resource, Beijing, China) was cultured in DMEM (Corning) supplemented with 10% Fetal Bovine Serum (Corning) and 1% penicillin/streptomycin (Corning). Before loaded into the microfluidic chip, MDA-MB-231 cells were cultured in flasks to 80% confluence and rinsed twice with phosphate buffered saline (Corning) and then detached using 0.25% trypsin-EDTA (Corning) solution. Cell suspension was prepared with a concentration of 1×10⁷ cells/mL using cell culture medium mixed with ECM-based hydrogel solution on ice. Hydrogel droplets were generated as described in results and discussion section. After droplets gelation, the gelled hydrogel microspheres were collected using a 40-μm cell strainer (BD Falcon), and then rinsed with 1% (w/v) CaCl2 once to enhance mechanical properties and PBS twice to discard the remaining oil phase solution, followed by re-dispersing in 24-well plate (Corning) with adequate cell culture medium. The cell–laden hydrogel microspheres were cultured in an incubator with 5% CO2 at 37 °C and the culture medium was changed every two days during the experiments.

3.5. Cell staining

Cell viability was assessed using a standard acridine orange (AO) and propidium iodide (PI) staining protocol.[37] Briefly, after removing the culture medium and rinsing samples in 1 ml of PBS for 5 min at 37 °C, the cell–laden hydrogel was incubated in 5-μg/mL AO staining solution to stain living cells and 5-μg/mL PI to stain dead cells for 15 min at room temperature. After incubation, the hydrogel was then rinsed in PBS and imaged under an inverted microscope (Ti, Nikon) with a 10/20x air objective in 25-°C environment. The images and data have been processed and quantitatively analyzed later using the ImageJ and Origin software package, respectively.

4. Results and discussion
4.1. Design of the chip

We aimed to fabricate a simple and stable microfluidic device which can generate highly monodisperse alginate droplets and encapsulate tumor cells over a long period of time. As shown in Figs. 1(a)1(c), the microfluidic chip with four inlets and one outlet, consists of two main functional components: one is the laminar flow zone with a serpentine microchannel and a cross-junction, the other is the droplet formation zone with two cross-junctions (CI and CII). The serpentine microchannel can be thought of as a fluid resistor, and placed for shorter microchannel of aqueous 2 (A2) to dampen fluctuations arising from the mechanical instability of syringe pumps and the elasticity of the PDMS device.[33] The microfluidic chip for droplet generation have two inlets for oil 1 (O1) and 2 (O2), two inlets for aqueous 1 (A1) and 2 (A2). The width of the main channel of the microfluidic chip is 100 μm and the height of the channel is 150 μm. The illustration in Fig. 1(b) shows different supplies for each inlet and the product collected at the outlet. After flowing through the serpentine microchannel, aqueous 2 (red, A2) co-flows with aqueous 1 (green, A1) laminarly due to low Reynolds number. Subsequently, the mixture of aqueous solutions and oil 2 (O2) meet at the cross-junction (CI) with a width of 90 μm and length of 100 μm and spontaneously produce core–shell droplets composed of an inner aqueous (A2) core and an outer aqueous (A1) shell, due to different surface properties between aqueous and oil phase.[30,38]

4.2. Hydrogel droplets formation

The microfluidic chip that we used in our study can generate droplets with stable and uniform size. The process of droplet generation is affected by a group of independent variables, including flow rates, viscosity of medium and the geometry and dimension of the microchannel. We first investigated the effect of flow rate of the oil phase on the size of droplets. Figure 2(a) shows the experimental results. By fixing the flow rate of aqueous A1 and A2 at 80 μL/h and 40 μL/h respectively, equivalent to net aqueous flow rate of 120 μL/h, and then changing the flow rate of oil 2 (VO2) from 60 μL/h to 1200 μL/h, different sizes of droplets can be obtained. Figure 2(b) shows the simulated dynamic process of droplet generation in the microfluidic flow-focusing device with same size as in experiment. The flow rate of oil 2 (VO2) and aqueous phase (VA) were 300 μL/h and 120 μL/h respectively. Figure 2(c) compares experimental measurement and simulation results of the influence of oil phase flow rate. A close examination shows that with increasing flow rate of oil 2 from 60 μL/h to 1200 μL/h, the droplet size decreases from 81.7 μm to 42.5 μm in experiment while the simulation results display a change from 188.7 μm to 81.2 μm. The mismatch in size, can be attributed to several reasons, such as the simplified 2D models vs. complex 3D experiments, the instability of syringe pump, the resistance of pipeline, and the nonhomogeneous properties of aqueous mixture. One thing to note is that the droplets are smaller when the flow rate is 60 μL/h compared to 180 μL/h. This is because VO2 is too small to generate droplets in the first cross junction (CI), aqueous phase and oil 1 (O1) will meet at the downstream cross-junction (CII) and the higher flow rate (VO1+VO2) results in generation of droplets with smaller size. Our simulation results also capture this behavior. In addition, we investigated the effect of the flow rate of oil 1 on the size of droplet. As shown in Supplementary Material, Fig. S1 no statistical difference can be observed in droplet size when changing the flow rate of oil 1 (VO1). Therefore, we conclude that VO2 has significant influence on the size of droplets while VO1 does not.

4.3. Stability of core–shell structure

It is easy for the quickly ionically cross-linked alginate hydrogels to produce hydrogel microspheres with uncontrollable size and shape, which can clog the microchannel within several seconds. To solve this problem, we used water-soluble calcium-EDTA mixed with alginate as the aqueous phase in this study.[39] The reaction scheme is shown in Fig. 1(d). Acetic acid contained in oil 1 can reduce the pH value of the aqueous phase and trigger the ionization of the premixed calcium-EDTA complex to provide bivalent calcium ions.[22,34] The slow release of calcium ions lead to uniform gelation of alginate scaffold. The alginate shell can maintain the droplet shape and retain the Matrigel and Collagen components in the droplet core. Matrigel and Collagen stay liquid around 4 °C but will slowly form gel network as temperature goes up.[26] Thus, temperature control becomes essential for successfully fabricating core–shell droplets from thermosensitive hydrogel such as Collagen and Matrigel. To provide low temperature environment, we kept the syringe containing thermosensitive hydrogel in an ice bath during droplets generation, as illustrated in Fig. 1(b), and used an ice-cold concentric tube to cool the connector tube of microfluidic chip.

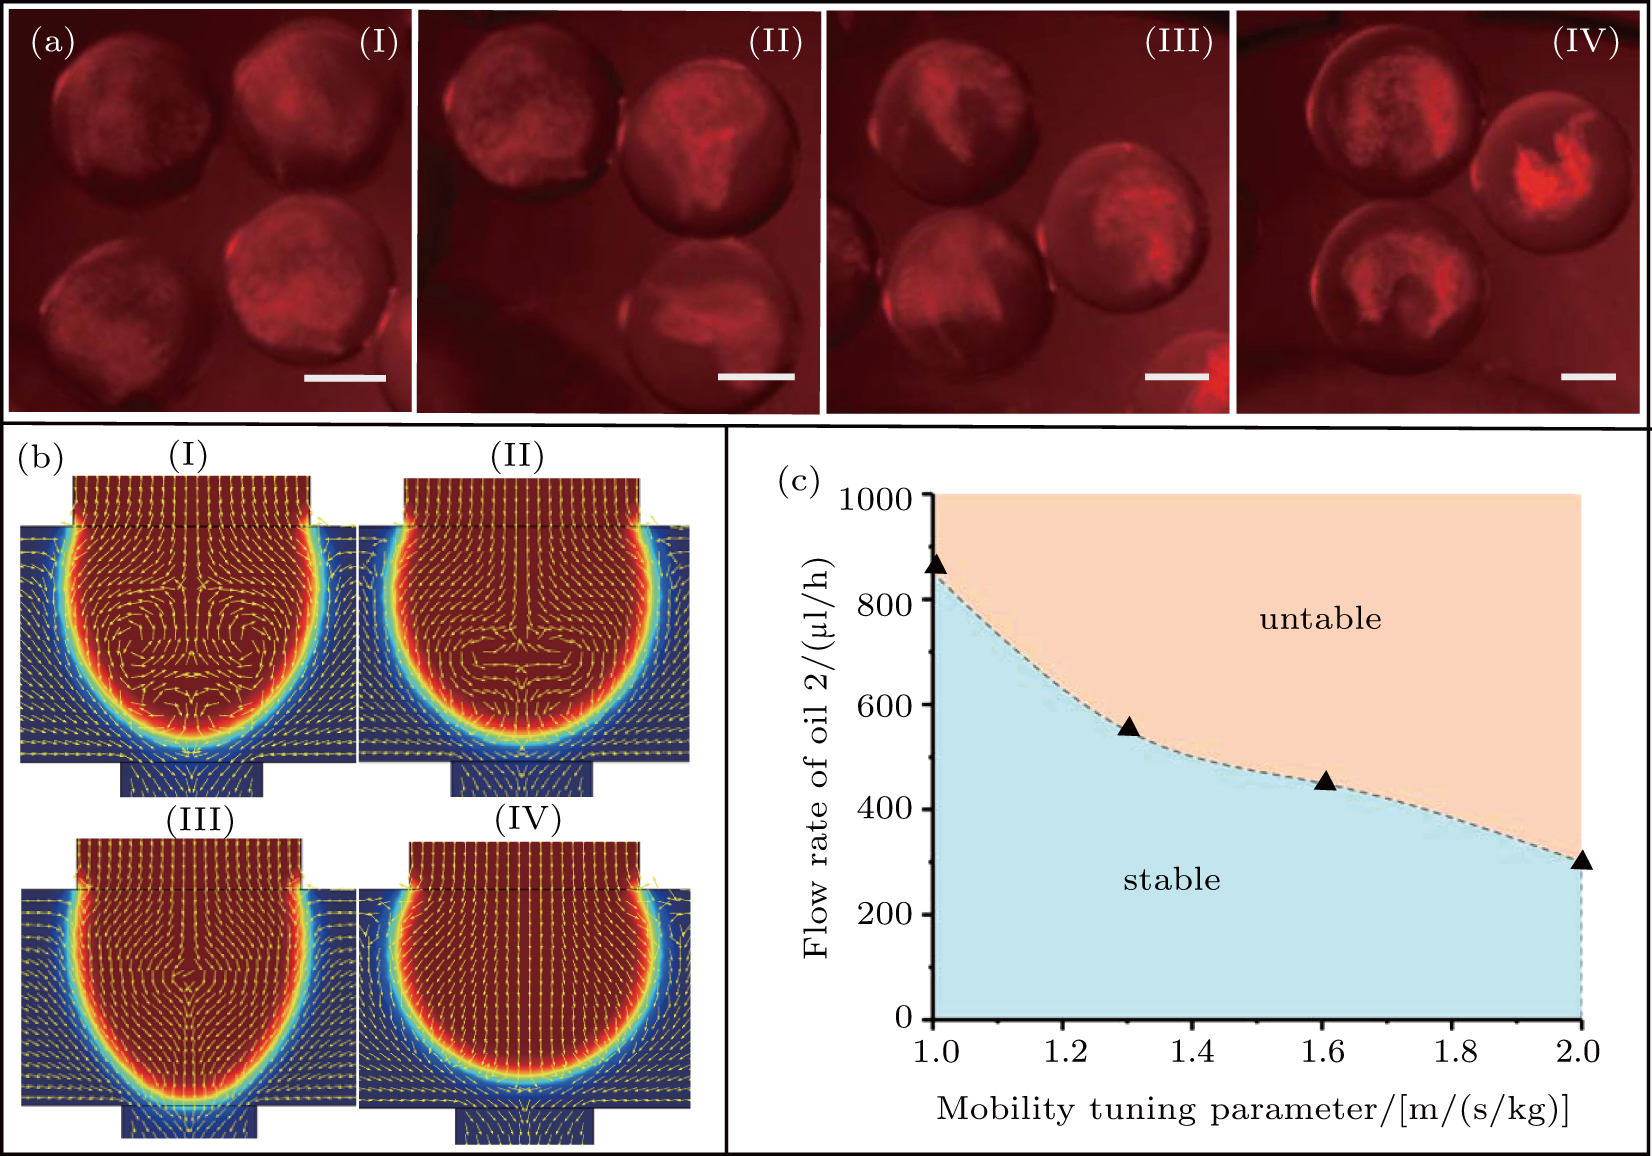
To generate core–shell hydrogel microspheres, the Matrigel and Collagen mixture with or without tumor cells was used as the aqueous 2 (A2), and the alginate/calcium-EDTA mixture was used as the aqueous 1 (A1). Fluorinated carbon oil supplemented with 0.15% (v/v) acetic acid and without acid were used as oil 1 (O1) and oil 2 (O2), respectively. The flow rate of the aqueous phase for all cases were 120 μL/h. Figure 3(a) shows as the flow rate of oil 2 decreases, the structure of core–shell microspheres experience four stages from I to IV: complete mixing, partial mixing, weak stratification and core–shell formation, indicating that flow rate of oil 2 has a significant effect on the formation of core–shell structure. Increasing oil phase velocity results in higher pressure and shear stresses during the droplet formation, leading to larger velocity fluctuations in the aqueous phase. The phase-field model was used to numerically investigate the velocity field evolution during the droplet formation process. Figure 3(b) shows that the 2D velocity field of deforming droplet also experiences four stages from I to IV: large recirculation, small recirculation, critical recirculation and no recirculation when the flow rate of oil 2 decreases, corresponding to the four stages in Fig. 3(a).

Fig. 3. (color online) Simulation and experimental results for the influence of the flow rate of oil 2 on 2D velocity field. (a) With decreasing flow rate of oil phase 2, the structure of core–shell microspheres experience four stages from I to IV: complete mixing, partial mixing, weak stratification, and core–shell formation. The scale bar is 50 μm. (b) With decreasing flow rate of oil 2, the simulation results indicate that the 2D velocity field of deforming droplet also experiences four stages from I to IV: large recirculation, small recirculation, critical recirculation, and no recirculation. (c) As the value of mobility tuning parameter χ increases the critical flow rate of oil 2 becomes smaller. The blue surface represents the velocity field with a stable flow field (IV), and the brown surface represents the velocity field with an unstable vortex flow (I and II).

The value of mobility tuning parameter χ has an effect on the critical flow rate of oil 2 at which recirculation is initiated. Figure 3(c) presents graphically velocity field stability as a function of the value of mobility tuning parameter χ. The planar part shows the division into two quadrants which give rise to different scenarios for the velocity field. The blue surface represents the velocity field with a stable flow field (IV), and the brown surface represents the velocity field with an unstable vortex flow (I and II). Increasing oil phase velocity results in an unstable vortex flow formation, leading to the destruction of the core–shell interface (i.e., layered structure). Figure 3(c) shows that as the value of mobility tuning parameter χ increases the critical flow rate of oil 2 becomes smaller. The reasonable value of χ in numerical simulation depends on real physical systems and can be determined by comparison with experimental results. It is neither too small to satisfy the numerical convergence nor too large for ensuring the diffusion not to overly damp the flow.[40] In our study, the value of χ was determined as 1.5 m·s/kg for all flow conditions in the subsequent simulation. Based on experiment and numerical simulation, the flow rate of oil 2 was chosen to be 300 μL/h, which is optimal for generating cell–laden core–shell hydrogel microspheres.

4.4. Cell–laden hydrogel microspheres formation

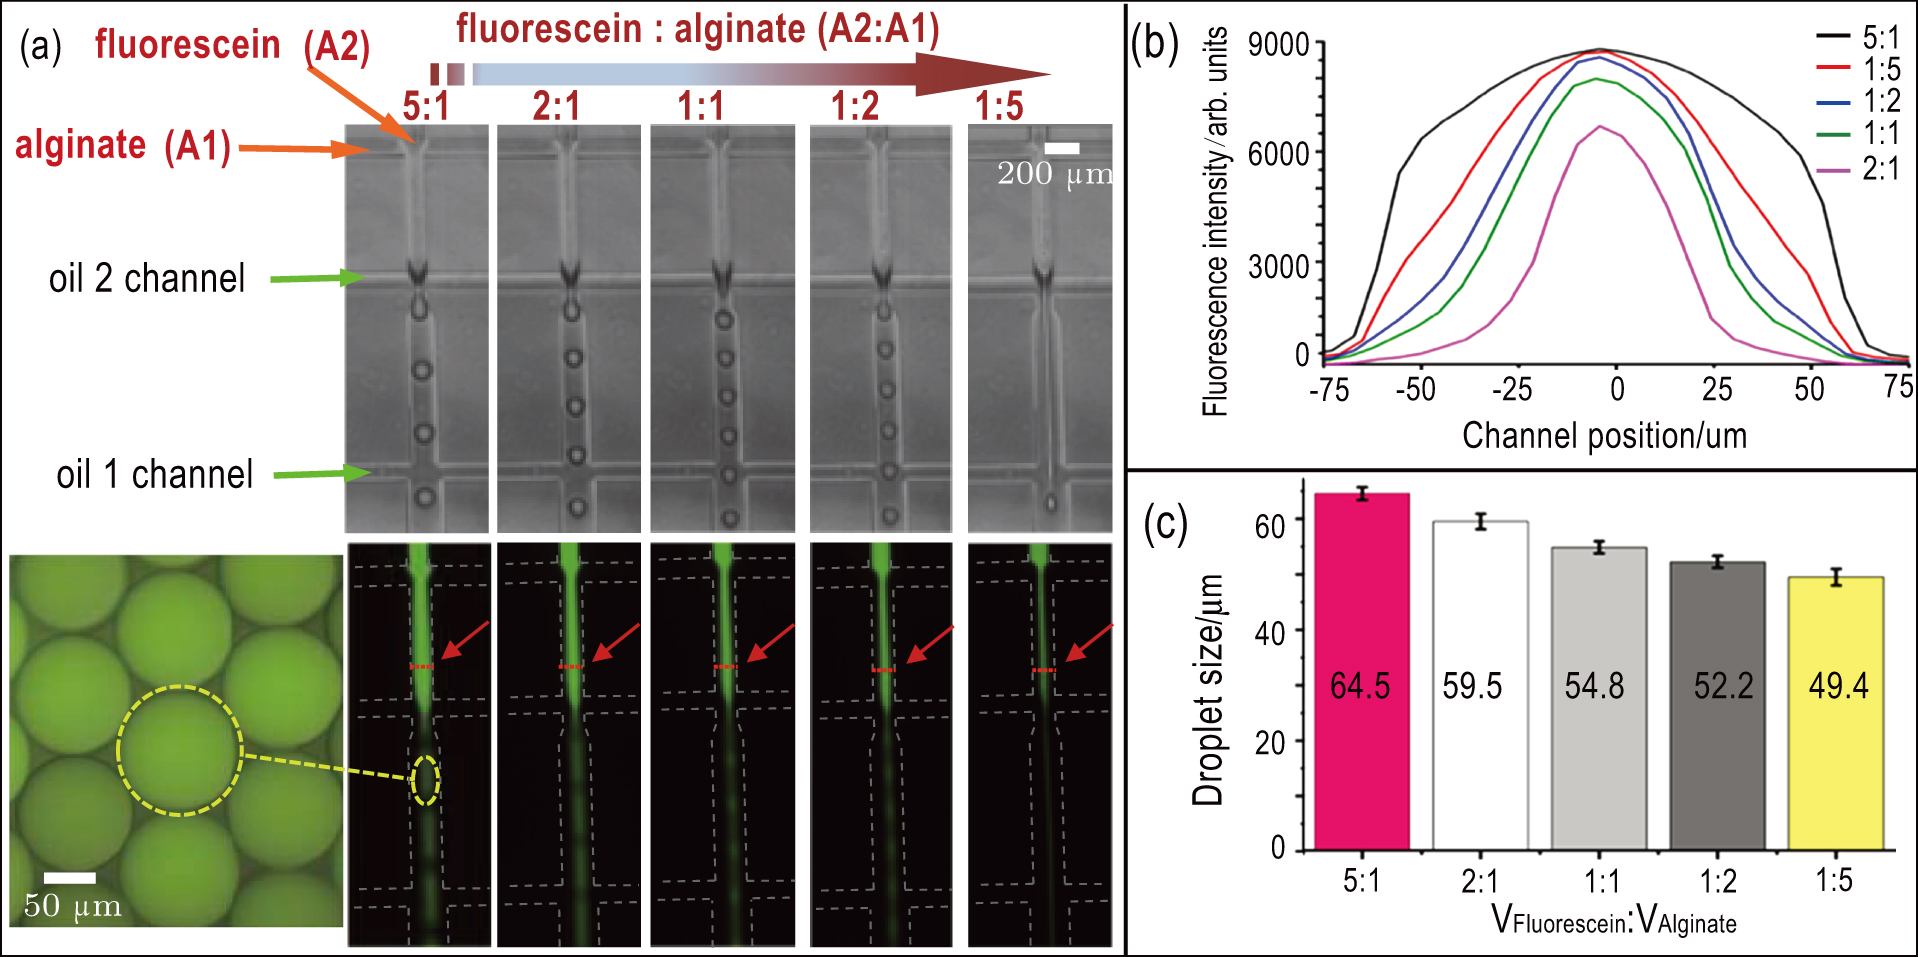
The heterogeneous core–shell structure of cell–laden hydrogel microspheres provide a more complex and realistic 3D micro-environment for mimicking the in vivo 3D spatial structure of tumor. The microfluidic chip can generate hydrogel droplets with variable volume ratios of core to shell and adjust the ratio in real-time (Fig. 4). In order to demonstrate the feasibility of generating hydrogel droplets with variable volume ratios of core to shell, PBS solution with 100-μM fluorescein was introduced into the microfluidic chip as aqueous 2 (A2), and the alginate/calcium-EDTA mixture was introduced into the channel as aqueous 1 (A1). At the same time, oil 1 (O1, with acid) and 2 (O2, without acid) were introduced into the microfluidic chip at a constant flow rate of 600 μL/h and 300 μL/h, respectively. As shown in Fig. 4(a), aqueous 2 (A2) co-flows with aqueous 1 (A1). The net flow rate of aqueous phase (VA1+VA2) was maintained at 120 μL/h and the flow rate ratio of different aqueous solutions was adjusted. Experimental results showed that, the lower ratio of VFluorescein to VAlginate (VA2: VA1), the narrower the fluorescein flow. The distribution of fluorescence intensity over the channel cross-section in the co-flow area (Fig. 4(a), red arrow) at different ratio of VA2 to VA1 is shown in Fig. 4(b). By reducing the flow ratio of VA2 to VA1 from 5:1 to 1:5, the size of droplets decreased slightly from 64.5 μm to 49.4 μm as shown in Fig. 4(c). However, if the ratio of VA2 to VA1 exceeds 1:1, as shown in Fig. S2,the shell is mechanically weak and the spherical structure cannot be sustained. Consequently, the ratio of VA2 to VA1 should be less than 1:1 to form cell–laden core–shell hydrogel microspheres in the subsequent experiments.

Fig. 4. (color online) Droplets with variable volume ratios of the core and shell are generated. (a) The lower ratio of VFluorescein to VAlginate (VA2:VA1), the narrower fluorescein flow. (b) The distribution of the fluorescence intensity over the channel cross-section in the co-flow area (Fig. 4(a), red arrow) at different ratio of VFluorescein to VAlginate. (c) Statistical results show that droplet size slightly decreases with reduced ratio of VFluorescein to VAlginate.

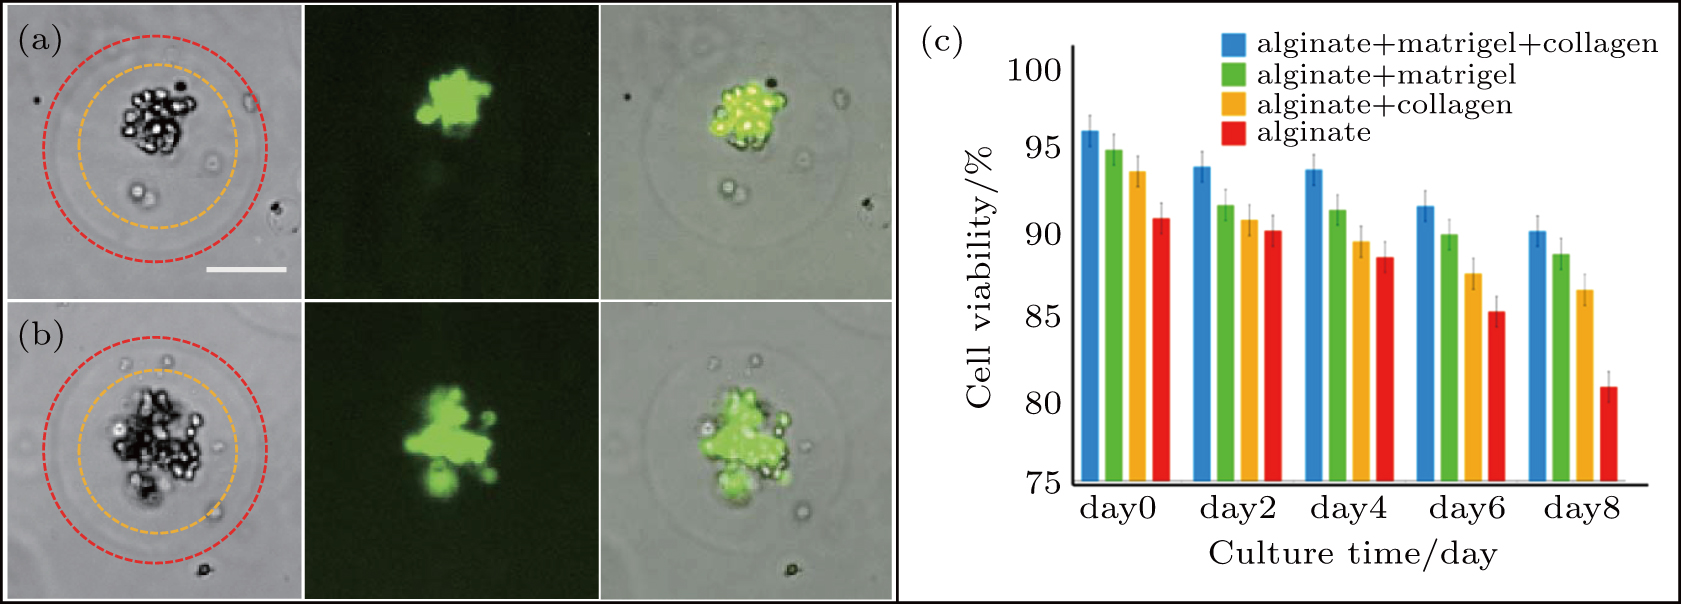
To generate cell–laden core–shell hydrogel microspheres, all of the fabricated PDMS microfluidic chips were sterilized with 75% ethanol and UV light irradiation for 30 minutes before cell encapsulation. By changing the flow rate of the inner and outer aqueous phases, we can adjust the composition of droplets. Figures 5(a)5(b) and figure S3 show the 3D cell–laden core–shell microsphere has a clear interface between the outer shell and the inner core. Figures 5(a) and 5(b) show that 3D hydrogel microspheres with different packing density of cells encapsulated in the core were generated at different ratio of VA2 to VA1 of 1:3 and 1:2, respectively. We used water-soluble calcium-EDTA mixed with alginate as the aqueous phase and acetic acid contained in oil 1 to trigger the gelation of alginate. If there is not enough time for crosslinking, then incomplete gelation of the alginate droplets will happen. Figure S5 shows collected hydrogel microspheres with insufficient crosslinking. According to our experimental results, a crosslinking time of 2 min was sufficient to achieve complete gelation of the alginate/calcium-EDTA droplets and high viability of cells, and similar results were obtained in previous study by Stefanie Utech (2015).[41] After gelation, the cell–laden hydrogel microspheres were first rinsed by 1% CaCl2 to improve the mechanical properties, then rinsed by PBS to remove residual oil and acid, and finally re-dispersed in the cell culture medium for long-term culture. As shown in Fig. 5(c), the process of generation of cell–laden hydrogel microsphere by the microfluidic device is compatible with MDA-MB-231 cells, indicating that the exposure of cell–laden hydrogel microspheres to the acidified oil does little harm to cells within the required crosslinking time.

Fig. 5. (color online) Cell viability and proliferation. Different packing density of cells encapsulated in the core of 3D hydrogel microspheres at different ratio of VA2 to VA1 of (a) 1:3 and (b) 1:2, respectively. The net flow rate of aqueous phase (VA1+VA2) was maintained at 120 μL/h. The scale bar is 40 μm. (c) Statistical results of viability of MDA-MB-231 cells encapsulated in alginate + Matrigel + Collagen, alginate + Matrigel, alginate + Collagen, and alginate only hydrogel for 8 days. 3D hydrogel environment with the addition of extracellular matrix components including both Collagen I and reconstituted basement membrane provides a better growth micro-environment for cells compared with those containing only one kind of hydrogel material.

The viability of encapsulated cells in four different hydrogel matrices were assessed at 0, 2, 4, 6, and 8 days.[37] Initially, cells are sparsely dispersed in the hydrogel matrix. After 2 hours culture, assay results show more than 92% viability as shown in Fig. 5(c). After 8 days of culture, as shown in Fig. S4, tumor cells form compact clusters with high cell viability. Figure 5(c) shows that the viability of cells encapsulated in pure alginate hydrogel is around 81%. The viability of cells in alginate hydrogel supplemented with 2-mg/mL Collagen and with 3.5% Matrigel is improved to 87% and 89%, respectively. Furthermore, cells in alginate hydrogel supplemented with both 3.5% Matrigel and 2-mg/mL Collagen shows 91% viability. Student’s two-tailed t-test was used to evaluate the statistical significance of the results. The viability of cells was significantly different between alginate + Matrigel + Collagen hydrogel matrix and alginate-only hydrogel matrix (p<0.05). Therefore, the ECM-based core–shell hydrogel scaffold provides a more efficient in vitro 3D model for tumor cell study.

5. Conclusion

A microfluidic device has been developed to generate heterogeneous core–shell microspheres that incorporate ECM components including both Matrigel and collagen I. The dynamics of droplet generation and velocity field evolution in the microfluidic device were investigated by both experiments and numerical simulation. The simulation results demonstrate good agreement with experimental observations. The microfluidic device provides a more efficient platform to manipulate cells and their environment, especially for oncology studies, such as anticancer drugs, cancer cells metastasis and tissue model studies, as the heterogeneous core–shell microspheres potentially provide well mimicked ECM micro-environment to observe cell–cell and cell–ECM interactions. Furthermore, the variability of the compositions of core and shell makes it a robust platform for real-time study, such as proliferation within natural ECM materials or invasion into hydrogel matrix under an engineered 3D micro-environment.

Reference
[1] Chen W Zheng R Baade P D Zhang S Zeng H Bray F Jemal A Yu X Q He J 2016 CA Cancer J. Clin. 66 115
[2] Grolman J M Zhang D Smith A M Moore J S Kilian K A 2015 Adv. Mater. 27 5512
[3] Kim T G Shin H Lim D W 2012 Adv. Funct. Mater. 22 2446
[4] Truong D Puleo J Llave A Mouneimne G Kamm R D Nikkhah M 2016 Sci. Rep. 6 34094
[5] Carvalho M P Costa E C Miguel S P Correia I J 2016 Carbohydr Polym 150 139
[6] Lee J M Mhawech-Fauceglia P Lee N Parsanian L C Lin Y G Gayther S A Lawrenson K 2013 Lab Invest 93 528
[7] Quail D F Joyce J A 2013 Nat. Medicine 19 1423
[8] Patil P U D’Ambrosio J Inge L J Mason R W Rajasekaran A K 2015 J. Cell Sci. 128 4366
[9] Nabet B Y Qiu Y Shabason J E Wu T J Yoon T Kim B C Benci J L DeMichele A M Tchou J Marcotrigiano J Minn A J 2017 Cell 170 352
[10] Fennema E Rivron N Rouwkema J Blitterswijk C V Boer J D 2013 Trends Biotechnology 31 108
[11] Kelm J M Timmins N E Brown C J Fussenegger M Nielsen L K 2003 Biotechnology & BioEng. 83 173
[12] Tung Y C Hsiao A Y Allen S G Torisawa Y S Ho M Takayama S 2011 Analyst 136 473
[13] Santini M T Rainaldi G 1999 Pathobiology 67 148
[14] Vinci M Gowan S Boxall F Patterson L Zimmermann M Court W Lomas C Mendiola M Hardisson D Eccles S A 2012 Bmc Biol. 10 29
[15] Yu L Chen M C Cheung K C 2010 Lab Chip 10 2424
[16] Tumarkin E Tzadu L Csaszar E Seo M Zhang H Lee A Peerani R Purpura K Zandstra P W Kumacheva E 2011 Integrative Biol. Quant. Biosci. From Nano Macro 3 653
[17] Velasco D Tumarkin E Kumacheva E 2012 Small 8 1633
[18] Karoubi G Ormiston M L Stewart D J Courtman D W 2009 Biomaterials 30 5445
[19] Barron C He J Q 2017 J. BioMater. Sci. Polym. Ed. 28 1245
[20] Gruene M Pflaum M Deiwick A Koch L Schlie S Unger C Wilhelmi M Haverich A Chichkov B N 2011 Biofabrication 3 015005
[21] Loozen L D Wegman F Öner F C Dhert W J A Alblas J 2013 J. Mater. Chem. 1 6619
[22] Chen Q Utech S Chen D Prodanovic R Lin J M Weitz D A 2016 Lab Chip 16 1346
[23] Yu L Grist S M Nasseri S S Cheng E Hwang Y C Ni C Cheung K C 2015 Biomicrofluidics 9 507
[24] Han W Chen S Yuan W Fan Q Tian J Wang X Chen L Zhang X Wei W Liu R 2016 Proc. Natl Acad. Sci. USA 113 11208
[25] Dolega M E Abeille F Picollet D ‘Hahan N Gidrol X 2015 Biomaterials 52 347
[26] Fridman R Benton G Aranoutova I Kleinman H K Bonfil R D 2012 Nat. Protocols 7 1138
[27] Kleinman H K Martin G R Seminars in Cancer Biology 378 386 10.1016/j.semcancer.2005.05.004
[28] Walters B D Stegemann J P 2014 Acta BioMater. 10 1488
[29] Kleinman H K Klebe R J Martin G R 1981 J. Cell Biol. 88 473
[30] Utada A S Lorenceau E Link D R Kaplan P D Stone H A Weitz D A 2005 Science 308 537
[31] Whitesides G M Ostuni E Takayama S Jiang X Ingber D E 2001 Annu. Rev. BioMed. Eng. 3 335
[32] Younan Xia G M W 1998 Angew. Chem. Int. Ed. 37 23
[33] Mazutis L Gilbert J Ung W L Weitz D A Griffiths A D Heyman J A 2013 Nat. Protocals 8 870
[34] Andersen T Auk-Emblem P Dornish M 2015 Microarrays (Basel) 4 133
[35] Loscertales I G Barrero A Guerrero I Cortijo R Marquez M Gañán-Calvo A M 2002 Science 295 1695
[36] Thorsen T Roberts R W Arnold F H Quake S R 2001 Phys. Rev. Lett. 86 4163
[37] Ingeson-Carlsson C Martinez-Monleon A Nilsson M 2015 Exp. Cell Res. 338 127
[38] Baroud C N Gallaire F Dangla R 2010 Lab A Chip 10 2032
[39] Gwon S H Yoon J Seok H K Oh K H Sun J Y 2015 Macromol. Res. 23 1112
[40] Yue P Feng J J Liu C Shen J 2004 J. Fluid Mech. 515 293
[41] Utech S Prodanovic R Mao A S Ostafe R Mooney D J Weitz D A 2015 Adv. Healthc Mater. 4 1628