Locating the position of objects in non-line-of-sight based on time delay estimation
Wang Xue-Feng1, 2, Wang Yuan-Qing1, †, , Su Jin-Shan1, 2, Yang Xing-Yu1, 2
School of Electronic Science and Engineering, Nanjing University, Nanjing 210046, China
School of Electronic Information Engineering, Yili Normal University, Yining 83500, China


† Corresponding author. E-mail: yqwang@nju.edu.cn

Project supported by the National Science and Technology Major Project of China (Grant No. AHJ2011Z001) and the Major Research Project of Yili Normal University (Grant No. 2016YSZD05).

Abstract
Abstract

Non-line-of-sight imaging detection is to detect hidden objects by indirect light and intermediary surface (diffuser). It has very important significance in indirect access to an object or dangerous object detection, such as medical treatment and rescue. An approach to locating the positions of hidden objects is proposed based on time delay estimation. The time delays between the received signals and the source signal can be obtained by correlation analysis, and then the positions of hidden objects will be located. Compared with earlier systems and methods, the proposed approach has some modifications and provides significant improvements, such as quick data acquisition, simple system structure and low cost, and can locate the positions of hidden objects as well: this technology lays a good foundation for developing a practical system that can be used in real applications.

1. Introduction

The non-line-of-sight imaging is the way to detect hidden objects, which cannot be reached directly by human vision, such as around a corner or behind a diffuser, and it has received much attention in recent years. For the imaging around the corner the reflection and diffusion of light are mainly used. It needs to rely on an intermediate medium which has the property of reflection or diffusion. For the imaging that relies on the diffuse intermediate medium, the laser source is focused onto a diffuser with characteristics of transmission and diffusion, the light scatters through the diffuser and spreads on a hidden object, then the light is scattered back again to the diffuser by the hidden object. It is finally obtained by the detectors which receive the backscattered light.

Earlier, the range-gated technology is used to obtain the non-line-of-sight imaging,[1,2] and it depends on the reflection of the intermediate medium (glass, metal frame and ceramic tile). The reflection imaging of the hidden object in the house can be detected by a range-gated camera. The light can also scatter through the opaque objects and imaging.[3] The “seeing around the corner” is the main way of non-line-of-sight imaging, and it usually uses the active imaging.[4] The hidden objects imaging behind a diffuser is another way, such as non-invasive imaging through opaque scattering layers.[5]

The technique of the time-of-flight (TOF) was used to investigate the inverse light transmission.[6] The method proved the existence of a set of inter-reflection cancelation operators that enable computing each n-bounce image. Femtosecond transient imaging utilized the ultrafast laser and picosecond streak camera to see the hidden objects around the corner.[711] They used the multiple reflections and five-dimensional (5D) time-light transmission matrixes; the reconstruction method was to make the elliptical tomographic projection. The three-dimensional (3D) hidden object around the corner has been reconstructed and the resolution achieved a precision of sub-millimeter depth. They continued to reconstruct the wide-angle, spatially varying reflectance hidden objects behind the ground glass diffuser, in which they used time-resolved inversion of backscattered light.[12,13] The different indirect and direct illumination concepts (point, surface and volume scattering sources) were also discussed to reconstruct hidden objects in non-line-of-sight imaging,[14] and they mainly focused on the large scales (on a meter scale) and a relatively long image acquisition time. Compared with the high resolution streak camera, the time-gated single photon avalanche diode (SPAD) for detecting the time-of-flight information has low cost with maintaining a comparable time resolution.[15] The SPAD was also used to track the hidden objects around corner.[16]

The reconstruction algorithm of non-line-of-sight imaging primarily depends on the information obtained by the detectors. The range-gated imaging technology[1,2] does not require reconstruction, the CCD camera captures the images reflected from the intermediate medium directly, but the image resolution is low. In the femtosecond transient imaging system used is the streak camera which obtains the streak images of hidden objects around the corner. The forward model of light transmission is established by elliptical tomographic projection and the filtered back projection is used in the reconstruction algorithm. The SPAD can detect the backscattered photons, and the time correlated single photon counting (TCSPC) module is used to produce a histogram of the photon counts versus the number of time bins after the illumination pulse. In the reconstruction method the back projection algorithm is also used. Currently, the conceptions of most proposed algorithms are of chromatographic process, which is similar to computer tomography (CT). So the general method is to perform the tomographic reconstruction, and the back projection algorithm is used to image reconstruction. The back projection algorithm is also used in synthetic aperture radar system.[17] The tomography reconstruction algorithms require data acquisition many times, the light source needs repeating on many spots, and the detectors also record data repetitively for multiple data acquisition correspond, so data collection needs to take a long time. Due to a large number of data acquisitions, the reconstruction is also slow. The detector requires high accuracy and sensitivity, which is expensive (such as picosecond streak camera). Those shortcomings block the practical applications.

In the paper, we present a different reconstruction algorithm based on time delay estimation for the localization of hidden objects. There is a certain time delay between different signals. When the signal arrives at the detector at different times, the location of the reflect signals are estimated by the time delay. The light source in our system only focuses on one spot and does not need to repeat many spots and times, neither does the data acquisition. Accordingly, the data acquisition is finished simultaneously. The structure of the system shows simpler and lower cost. The reconstruction algorithm based on the time delay estimation can locate the hidden object in real time.

2. Time delay estimation algorithm

The time delay estimation (TDE) algorithm is based on time difference of the arrived signals between the different detectors. The position and direction of the return signal can be located by the TDE algorithm. It is an important part of signal processing in signal detection, and is widely used in radar systems, sonar systems, communications and biomedical fields.[1822] Estimation of the acoustic signal is the most widely used, according to the similar characteristics of acoustic field propagation and light field propagation, the localization method of the sound field can be applied to the light field.

The basic idea of TDE is that by measuring the time interval t of signal propagation, under the known speed of light v in air and the distance s can be obtained, and ultimately using s the location of source or reflector is determined.

For the active detection system, the source signal is s(n), the received signal is detected by the detector, and it can be described by the following mathematical expression:

where N is the number of observation samples, D is the number of signals, αd is the amplitude of the signal attenuation in the d-th path, τd is the time delay of the d-th path signal, v(n) is the Gaussian noise, and s(n) is the source signal. We make an assumption as follows: the noise is of normal stationary random process, and the relationship between signal and noise is independent.

Cross-correlation function is used in the basic method of estimating the time delay between the two signals,[23,24] the correlation function of source signal and the received signal is expressed as
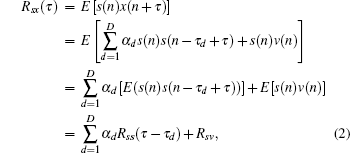
where Rss (ττd) is the auto-correlation function of s(n), E(·) is the mathematical expectation. In general, the noise is irrelevant to the target signal, we consider the noise and the source signal to be orthogonal, or assume them to be approximately orthogonal, so formula (2) is changed into

With the property of the auto-correlation function, when ττd = 0, Rss reaches a maximum value, and the correlation value between the two received signals is maximal, so choose τ as the delay value when the Rss (ττd) is maximum:

3. Modeling of non-line-of-sight imaging

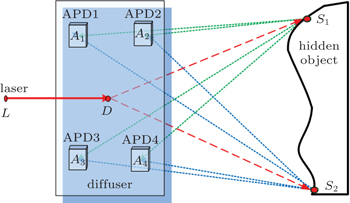
The laser pulse propagation process is shown in Fig. 1. A pulsed laser at point L strikes a diffuser at point D. Light scatters through the diffuser and toward a hidden object (the red dashed lines from point D to point S1 and S2). The backscattered light beams from the hidden object are back to the diffuser again and received by the detectors which are placed outside the diffuser (on the side of laser source). Those are lines from point S1 to points A1, A2, A3, and A4 (the green dashed lines) and from point S2 to points A1, A2, A3, and A4 (the blue dashed lines). We use four APDs to receive the return signals in experiment. The diffuser is opaque and the hidden object cannot be seen through it. The light transmits through the diffuser and spreads to all directions, the hidden object can be covered by the scattered light.

Fig. 1. Schematic of propagation process of laser pulse in our experiment system.
3.1. Forward model: time delay of light pulse

A laser source is in the form of time domain signal, and can be expressed as[25]

where τ = T1/2/3.5 and T1/2 is the full width at half maximum (FWHM), a standard measure of the pulse width.

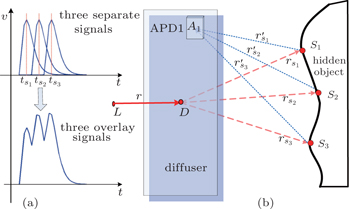
We consider the case of received signal by one APD, and select three points on the hidden object randomly (points S1, S2, and S3), and the light propagation process is shown in Fig. 2(b). The distance between light point L and point D is r. The light transmits through the diffuser at point D and reaches three points S1, S2, and S3 on the hidden object, the transmission distances are rs1, rs2, and rs3 respectively. The backscatter light beams from the hidden object are received by the APD, the transmission distances from S1, S2, and S3 to A1 are , , and respectively, and the received signals by one APD is shown in Fig. 2(a). The upper portion of Fig. 2(a) shows the returned signals of three points separately on the hidden object; the return times of the three signals can be obtained from the following formulas:

Fig. 2. Received signals from hidden object by one APD. (a) the received signals from three random points of the hidden object, the upper signals are separated for three points; the lower signal is detected by APD; (b) the light transmission process of the laser to one APD.

Since the distance between points of the hidden object is very small, the time delays among the return signals are small too and less than the laser pulse width generally, the received signals will be overlaid. Each APD detector should receive overlaid signals, which are shown in the lower part of Fig. 2(a). The pulse width of received signal is broadened and has multiple peaks at different times. If the signals are received from the same plane of the hidden object, then the different signals have the same altitude heights, and the time delay between the return signals is very small, thus producing high dense overlaid signals, and finally the signals that are received by the detector should become a wider pulse width than the source signal’s, typically having a major peak.

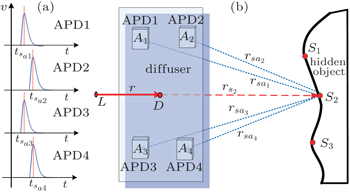
Figure 3 shows that the light beams scattered from a random point S2 on the hidden object transmit to the diffuser and are received by four APDs. The distance from the diffuser at point D to point S2 is rs2, and the backscattered light transmission distances from the point S2 to four APDs are rsa1, rsa2, rsa3, and rsa4 respectively. The returned signals that are detected by APDs are shown in Fig. 3(a). The time delays occur in the four APDs at different distances, and the times of the received signal in APD are

Fig. 3. Received signals by four APDs from one point of the hidden object. (a) Four signals received by four APDs respectively from one point of the hidden object, (b) the light transmission process of the laser source to the four APDs.
3.2. Locating the position of the hidden object

The basic method of estimating TDE is to calculate the correlation function between the source signal and the received signal, and estimate the time delay between them. According to the time delay information and the light propagation velocity, the position of the hidden object can be located.

Let the received signals of four APDs be a1(t), a2(t), a3(t), and a4(t), the source signal is p(t), according to formula (2), the correlation between each received signal and the source signal is calculated as

The correlation signal is calculated from formula (8), and the major peaks of the received signal are detected. The time τi at the peak value is the time delay between the source signal and received signal, the four time delay values are τ1, τ2, τ3, and τ4.

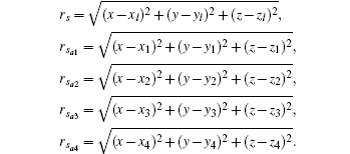
The position of the object is assumed to be s2 (x,y,z) in Fig. 3(b). The distances between point s2 and four APDs are rsa1, rsa2, rsa3, and rsa4 respectively. The source point l(xl,yl,zl), distance r, and four APD points a1 (x1,y1,z1), a2 (x2,y2,z2), a3 (x3,y3,z3), and a4 (x4,y4,z4) are known. The distances from laser source to diffuser, from the diffuser to hidden object and backscattering from the hidden object to the detector are r, rs2, and rsa1 respectively, and the total distance of the light transmission from the laser source to the detector is r + rs2 + rsa1 (for example APD1), which is the time-delay-producing distance between the source signal and received signal. The time-delay-producing distances between the four APD signals and the source signal are

where

Equation (9) is a ternary quadratic group, and needs three equations to be solved. We just need to obtain the information about three APDs. For solving nonlinear equations, in order to prevent the iteration result from diverging, we use the quasi-Newton iterative method[26,27] to solve the nonlinear equations, and the iterative formula is

where Δxk = xk+1xk, and yk = f(xk+1) − f(xk).

4. The experiment results

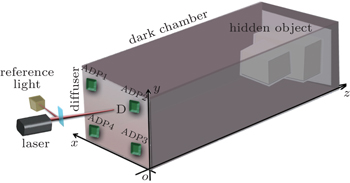
In the experiment, the laser source is a pulse-mode 1064 nm with 10-ns pulse width at a repetition rate of 10 kHz, and has an average power of 1W. The detectors are four APDs. Oscilloscope with a sampling rate of 1 GHz is used to data acquisition. Experimental setup of scene is shown in Fig. 4. In order to verify the experimental results, we build a cuboid dark chamber with a size of 600(length)×200(width)×200(height) (in unit cm). Three-dimensional (3D) coordinates are also shown in Fig. 4, the light source is focused on the point D(100,80,0) of the diffuser, the four APDs are placed outside the diffuser, and their positions are (180, 180, 0), (20, 180, 0), (20, 20, 0), and (180, 20, 0) respectively. Since the position of the hidden object has three unknown variables in Eq. (9), we only need three equations to solve it. In our experiments three APDs are used to receive signals, the APD1, APD2, and APD3 are used in experiment 1, and APD1, APD2, and APD4 are used in experiment 2 in the following text.

Fig. 4. Experiment setup of our system scene. The laser light is illuminated onto a diffuser at point D, transmits through the diffuser and continues to scatter onto the hidden object, then the light from the hidden object can scatter back to the diffuser again, finally the four APDs receive the backscatter signals.

The light source is focused onto the diffuser and scatters through the diffuser toward the hidden object, the light beams scatter back onto the diffuser and are received by APDs. Three APDs record the returned signals for each light incident on the diffuser. The light in the system is only focused on one spot and the data acquisition is finished simultaneously. We have carried out two experiments in the present work.

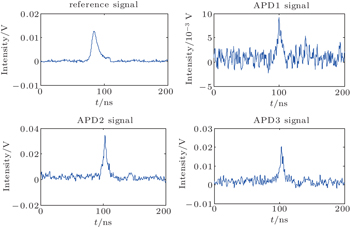
Experiment 1 There is a white board serving as a hidden object in the dark chamber; it is placed at a distance of 190 cm from the diffuser. The signals received by three APDs are shown in Fig. 5. The first signal is reference signal, the signals from the second to fourth are received by three APDs, respectively. There are three time delays between reference signal and received signals. Since only one board is placed in the darkroom, there are no altitude differences between the points in the board. The received signals come back to APDs concentrated in a short period of time, which form one major peak of overlay signals. Due to the overlay of multiple signals, the amplitude of received signal should be increased. But there are lots of light energy losses in the scatter through the diffuser, in the transmission toward the hidden object and then scattering back to the diffuser, furthermore, many signals cannot reach the detectors due to the weak energy and noise. So the received signals are weak.

Fig. 5. Reference signal and received signals which are detected from one white board.

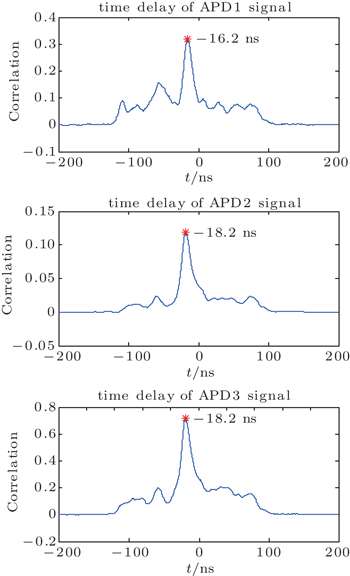
The time delay estimation between source signal and three APD signals are shown in Fig. 6. We use formula (8) to calculate the time delay between each APD and source signal. The minus sign in Fig. 6 indicates that the received signal lags behind the reference signal; the major peak in the correlation signal (maximum peak) is the delay time.

Fig. 6. Time delays between source signal and APD received signals in Fig. 5. The one major peak is corresponding to the time delay, which is marked as asterisk (*) and the label text is translated into time (ns).

The three time delay values are −16.2 ns, –18.2 ns, and –18.2 ns of the correlation signals in Fig. 6. Equation (9) is used to calculate the location point s(x,y,z) of the hidden object with distances from light source to detectors. We use quasi-Newton iteration method (Eq. (10)) to solve nonlinear equations. The result shows the 187-cm depth of the hidden object has a 3-cm error.

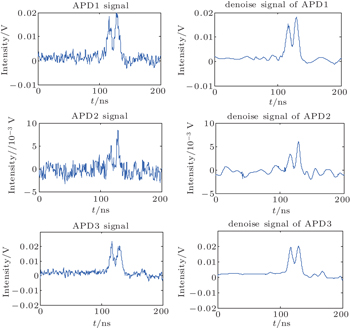
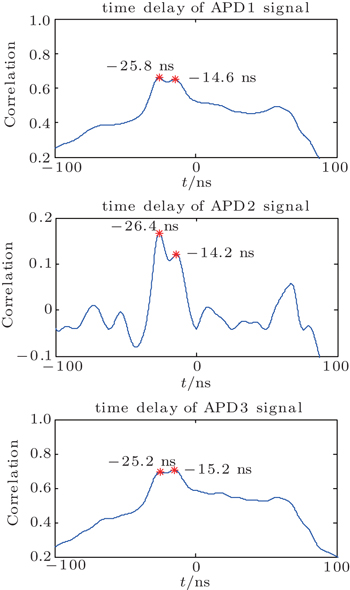
Experiment 2 In order to validate that the method can locate multiple objects at different depths, we place two white boards in a darkroom with depths of 1.6 m and 3.3 m respectively to the diffuser, their sizes are 75 cm × 80 cm and 150 cm × 150 cm, the front board is the smaller size board and the bigger size board is in the back. Though the front board will cover a part of the back board, the light can scatter to the other part of the back board and backscatter to the diffuser, finally we receive the signal from the back board. The received signals by the APDs are shown in the column on the left-hand side of Fig. 7. According to the time delay of multiple hidden objects with different depths, there is a larger time delay with different depths; the received signals each have two major peaks. Since the received signal has noise, the wavelet de-noise method is applied to the signals before the correlation. The de-noised signals are shown in the column on the right-hand side of Fig. 7. We can see that the de-noised signal is smooth and the pseudo peaks are reduced obviously.

Fig. 7. Three APDs received signals which are detected from two white boards, and their de-noised signals. The three signals in the left column are received signals and the three signals in the right column are their de-noised signals.

The results of time delay are shown in Fig. 8, and the result signal in each correlation signal has two major signals, corresponding to the two hidden objects with different depths. The positions of major peaks in Fig. 8 for three APDs are (−25.8 ns, −14.6 ns), (−26.4 ns,−14.2 ns), and (−25.2 ns, −15.2 ns) respectively, which are the time delays of the two hidden objects with different depths.

Fig. 8. Time delays between source signal and APD received signals in Fig. 7. The two major peaks are corresponding to the two time delays (the two white boards in experiment 2), which is asterisked (*) and the label text is translated into time (ns).

We use a quasi-Newton iteration method to calculate the locations of hidden objects; the results are 413 cm and 241 cm. The depths of two hidden objects are 333 cm and 161 cm which subtracts the distance 80 cm from light point L to point D on the diffuser.

As shown in Figs. 5 and 7, the received signals of APD1 in Fig. 5 and APD2 in Fig. 7 are weak with larger noise, since the detection sensitiveness is lower than those of other APDs. After being de-noised, the signal also has two major peaks in Fig. 7, and two time delay values are estimated by the correlation analysis, even though there exist many pseudo peaks. In the experiment, we first detect the peaks of the received signals, if the received signal has two major peaks, the estimated values should have two time delays, and there are two major peaks in the correlated signal.

In our experiment, the light source only focuses on single position, the detectors receive the signals from the hidden objects simultaneously, and the locating algorithm can also be finished in real time. The proposed method can achieve rapid and real-time location of the object position with simple structure. It is expected to be applied to the practical application.

5. Conclusions

We use a near-infrared laser source, which scatters through the diffuser and continues to spread onto the hidden objects, the light scatters back again from the hidden objects and reflects to the diffuser, finally the light beams are received by the detectors. The experimental data are obtained from the experiment setup with a darkroom in laboratory. The time delay estimation method is presented, we use the correlation algorithm to obtain the time delays between the received signals and the source signal. With the time delay and distance information, and using the quasi-Newton iteration method (Eq. (10)) we locate the depths of hidden objects. Experimental results show that the proposed method can quickly locate the positions of hidden objects.

The system proposed in the present paper can recognize hidden targets behind camouflage, vegetation, water, haze and fog, fire, and smoke. It can detect hidden objects which cannot be directly observed, and applied to medical treatment, rescue, and other potential object detection.

Reference
1Repasi ELutzmann PSteinvall OElmqvist M 2008 Proc. SPIE 7144 71140D
2Repasi ELutzmann PSteinvall OElmqvist MGöhler BAnstett G 2009 Appl. Opt. 48 5956
3Popoff SLerosey GFink MBoccara A CGigan S 2010 Nat. Commun 1 626
4Steinvall OElmqvist MLarsson H2011Proc. SPIE 8186 Electro-Optical Remote Sensing, Photonic Technologies, and Applications V5 October, 201181860510.1117/12.893605
5Jacopo BPutten E GChristian BLagendijk AVos W LMosk A P 2012 Nature 491 232
6Seitz S MMatsushita YKutulakos K N2005IEEE ICCVOctober 15–21, 2005Beijing, China144010.1109/ICCV.2005.25
7Kirmani AHutchison TDavis JRaskar R2009IEEE ICCVSeptember 29–October 2, 2009Kyoto, Japan15910.1109/ICCV.2009.5459160
8Kirmani AHutchison TDavis JRaskar R 2011 Int. J. Comput. Vis. 95 13
9Gupta OWillwacher TVelten AVeeraraghavan ARaskar R 2012 Opt. Express 20 19096
10Velten AWillwacher TGupta OVeeraraghavan ABawendi M GRaskar R 2012 Nat. Commun. 3 745
11Velten AWu DJarabo AMasia BBarsi CJoshi CLawson EBawendi MGutierrez DRaskar R 2013 ACM Trans. Graph. 32 44
12Naik NBarsi CVelten ARaskar R 2014 J. Opt. Soc. Am. 31 957
13Raviv DBarsi CNaik NFeigin MRaskar R 2014 Opt. Express 22 20164
14Laurenzis MVelten A2013Proc. SPIE 8897 Electro-Optical Remote Sensing, Photonic Technologies, and Applications VII; and Military Applications in Hyperspectral Imaging and High Spatial Resolution SensingOctober 15, 2013Germany88970610.1117/12.2028776
15Buttafava MZeman JTosi AEliceiri KVelten A 2015 Opt. Express 23 20997
16Gariepy GTonolini FHenderson RLeach JFaccio D 2016 Nature Photon. 10 23
17Chen SZhao H CZhang S NChen Y 2013 Acta Phys. Sin. 62 218405 (in Chinese)
18Carter G CKnapp C 1976 IEEE Trans. Acoust Speech 1 357
19Lai XTorp H 1999 IEEE Trans. Ultrason. Ferroelectr. Freq. Control 46 277
20Pinton G FDahl J JTrahey G E 2006 IEEE Trans. Ultrason. Ferroelectr. Freq. Control 53 1103
21Ho K CChan Y T 1997 IEEE Trans. Aerosp. Electron. Syst. 33 770
22Li JPei M JQi D LQi Y PYang YSun Z R 2014 Chin. Phys. 23 124209
23Carter G C 1987 Proc. IEEE 75 236
24Knapp CCarter G C 1976 IEEE Trans. Acoust Speech 24 320
25Steinvall O KCarlsson T 2001 Proc. SPIE 4377 23
26Khiyabani F MLeong W J 2014 Appl. Math. Comput. 233 272
27Al-Baali MSpedicato EMaggioni F 2013 Optim. Methods Softw. 29 937