†Corresponding author. E-mail: anyuw@mail.tsinghua.edu.cn
*Project supported by the Research Fund for the Doctoral Program of Higher Education of China (Grant No. 20120002110031) and the National Natural Science Foundation of China (Grant No. 11334005).
Sonoluminescence is a complex phenomenon, the mechanism of which remains unclear. The present study reveals that an abnormal ionization process is likely to be present in the sonoluminescing bubble. To fit the experimental data of previous studies, we assume that the ionization energies of the molecules and atoms in the bubble decrease as the gas density increases and that the decrease of the ionization energy reaches about 60%–70% as the bubble flashes, which is difficult to explain by using previous models.
Single bubble sonoluminescence (SBSL) was first observed more than 20 years ago.[1, 2] Significant experimental and theoretical progress has been made to understand this phenomenon. It is now possible to accurately calculate bubble pulsation, [3, 4] understand noble gas rectification[5] (chemical instability), the bubble shape, and diffusive instability, [6, 7] and to describe the gas dynamics inside the bubble with considering thermal conduction, [8, 9] heat exchange, vapor effects, [10, 11] and chemical reactions, [12– 14] as well as to simulate bubble radiation processes.[15– 18]
The temperature inside the collapsing bubble is estimated to be about ten thousand degrees and the gas density is estimated to be close to the density of the liquid when the bubble flashes. It is generally believed that both SBSL and multi-bubble sonoluminescence (MBSL) are produced in the high-density and hot gas inside the bubble. The precise mechanism of sonoluminescence, however, is still unknown. Calculated results only qualitatively accord with the observed data. In the cases where calculations have been used to quantitatively interpret the experimental data, [15, 16, 19] vapor effects were neglected or the temperature and pressure inside the bubble were assumed to be uniform, which over-simplifies the gas dynamics inside the bubble. Considering all possible physical and chemical processes, we have previously simulated SBSL.[20] For most cases, the numerical light pulse widths, that is, the full width at half maximum (FWHM) values of light pulse, are much narrower than the experimental results, and neither the spectral profile nor the total photon number accord well with the experimental data. Thus, it is possible that the processes of SBSL in the calculation are actually not true and that some additional processes were not considered.
The key to understanding the mechanism of SBSL or MBSL was revealed in a recent experiment in Putterman’ s group, who observed that the degree of ionization of the gas inside the bubble reaches an unexpectedly high level at a moderate temperature.[21, 22] They found that in order to explain the opacity in the sonoluminescing bubble, the degree of ionization needs to be much larger than that predicted by the Saha equation.
In 2001, Yasui developed an equation that describes a reduction of ionization energy during sonoluminescence.[23] Yasui’ s model predicts that the ionization energy can decrease by more than 60%, which results in an extraordinary degree of ionization. This result is consistent with the observation of Putterman’ s group. In the present paper, we employ Yasui’ s equation and simulate the light emission process of SBSL to determine whether the abnormal ionization can quantitatively explain the experimental data.
The theoretical model used in the present study is similar to that reported in Ref. [20]. In the model, two gas components, i.e., inert gas and water vapor, are considered to be inside the bubble. Moreover, the evaporation and condensation of water vapor occur at the bubble wall, but the inert gas is confined to the bubble. Many properties, such as the viscosity, diffusion, and thermal conduction of the gas, are considered in the calculation. The heat exchange between the gas in the bubble and the surrounding water, the ionization of atoms or molecules, and chemical dissociation of hot gases are also considered. The atomic and ionic emission spectra of the inert gas, [24] molecular emission spectrum of OH radicals near 310 nm, the radiative attachment of electrons to atoms or molecules, and bremsstrahlung (electron– neutral atom and electron– ion) and recombination radiation are included in the model. These important light emission processes depend on the local pressure, density, and temperature, which can be evaluated by solving the partial differential equations for the fluid mechanics inside the bubble, and by considering the additional correction that is due to chemical dissociation and ionization. The boundary is the moving bubble wall, and its motion can be described by the Rayleigh– Plesset (RP) equation. For details on the model, please refer to Refs. [14], [17], and [18].
For the RP equation governing the variation of the bubble radius, we adopt the Keller– Miksis form:[4]

where R(t) is the radius of the bubble, p∞ is the ambient pressure, ps(t) = − pa sin(ω t) is the driving acoustic pressure at the location of the bubble, ω is the frequency of the acoustic wave, tR ≡ R/cl, cl, and ρ l are the sound speed and the liquid density on the liquid side of the bubble wall, respectively. The values of these parameters can be determined using the Tait equation, pl = pg(R, t) − 4η Ṙ /R − 2σ /R, which defines the pressure on the liquid side of the bubble wall; pg(R, t) is the pressure on the gas side of the bubble wall, η is the viscosity coefficient, and σ is the surface tension coefficient of the liquid. M ≡ Ṙ /cl is the bubble-wall Mach number, which includes effects due to the compressibility of the liquid.
The reduction of the ionization energy has been considered in previous calculations. Typically, as the bubble flashes, the ionization energy of atoms in the bubble lowers by about 1 eV (i.e., by less than 10%).[14, 16] Unlike the standard method used in previous models, in the present method we employ the equation proposed by Yasui[23] to calculate the reduction in ionization energy. It follows that the ionization energy of atoms or molecules is reduced in the dense gas by the overlap of their electron wave functions.[25, 26] The reduced ionization energy (χ red) is estimated from the following equation

where

Here, χ is the ionization energy of the gas in the vacuum, aB is the Bohr radius (aB = 5.29 × 10− 11 m), V is the bubble volume, nt is the total number of molecules inside the bubble, and k′ is the ratio of the radius of the gas molecules to that of a hydrogen atom. In Ref. [23], k′ is fixed for a given atom or molecule, k′ = 1.57 for Ar, 1.27 for O atoms, 1.29 for N atoms, 1.88 for NO, 2.17 for NO2, 2.08 for N2, 1.94 for O2, 1.83 for H2, and 2.0 for the other molecules. To investigate how the reduction of the ionization energy influences the numerical results, the value of k′ for inert gas atoms is not fixed, rather an adjustable parameter, 
As the experimental data of the SBSL pulse width used are not accompanied by the data of the ambient radius and the amplitude of the driving acoustic pressure, we evaluate these parameters using the theory of the diffusive instability of SBSL.[6, 27] However, the relative concentration of gas in the liquid is estimated according to the partial pressure of the gas in the liquid, which may cause errors. To allow the comparison of our results with the experimental data, we should select appropriate bubbles and calculate the FWHM as a function of their relative SBSL intensity. In our calculations, we find that the ambient radius and the amplitude of the driving acoustic pressure are not strictly in accordance with the diffusion curves of the relative concentrations, but are off the curves, especially for Xe and He bubbles. In addition, the photon number and the pulse width of SBSL will vary with the degree of ionization in the bubble. From Eq. (3) we can see that with different values of 

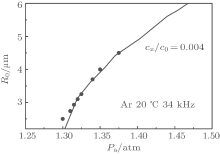
Figure 1 shows the calculated curve of the diffusive equilibrium in the pa– R0 plane (the positive slope indicates the stability) for an Ar bubble in 20-° C water with f = 34 kHz. For comparison with the experimental data, we select the bubbles (marked with solid circles in Fig. 1) near the curve for a relative gas concentration of c∞ /c0 = 0.004[28] and calculate the photon numbers and FWHMs using Eq. (3) (the present method) for 
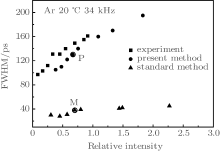 | Fig. 2. FWHMs versus relative SBSL intensity. The squares represent the experimental data from Ref. [28], the circles represent the results from the bubbles selected in Fig. 1, calculated by the present method, and the triangles represent the results from the same bubbles, calculated by the standard method. |
Although the measurement of the FWHM as a function of the relative SBSL intensity is important, the numerical simulation should also include characteristics of the SBSL spectrum. In the calculation, we need to know both the ambient radius of the bubble and the amplitude of the driving acoustic wave. However, these two parameters have not been delivered simultaneously together with the observations of the SBSL spectrum in previous reports. Fortunately, in the case of SBSL bubbles in water, the spectra reported tend to come from bubbles with the brightest output. For stable SBSL bubbles, there is an upper threshold for the ambient radius R0 and also there is a threshold for the amplitude of the driving acoustic pressure pa, which is attributed to shape instabilities[6] and spherical asymmetrical perturbation of the acoustic wave.[7] Generally, when the upper threshold of pa or R0 is approached, the SBSL emission reaches its brightest point. According to this condition, we calculate an Ar bubble with R0 = 5.75 μ m and pa = 1.45 atm in 20-° C water at f = 34 kHz. With the present method, the calculated spectrum (dashed line) of the bubble is in good agreement with the experimental observation[29] (solid line). In this case, the ionization energy of the gas decreases by 60% and the degree of ionization in the bubble is about 24% when the bubble flashes. However, using the standard method, the degree of ionization in the bubble is less than 4% and there is a large discrepancy between the calculated and experimental spectra (dotted– dashed line) as shown in Fig. 3.
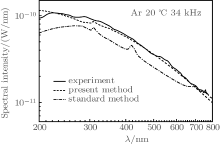 | Fig. 3. Variations of spectral intensity with wave length of an Ar bubble in 20-° C water with f = 34 kHz. The solid line represents the experimental data.[29] The dashed and dotted lines denote the results calculated by the present method and the standard method, respectively. |
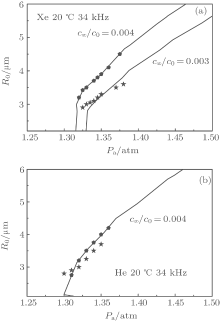
To provide further clarification, we also calculate the FWHMs and spectra for Xe and He bubbles using a similar method. The experimental data used are measured in water with a relative gas concentration of c∞ /c0 = 0.004; the calculations in the present study do not accord well with the experimental data. However, we find that they are in good agreement when we select bubbles [marked with stars in Fig. 4(a)] off the curve of diffusive equilibrium in the pa– R0 plane with a relative gas concentration of c∞ /c0 = 0.003 for Xe bubbles and c∞ /c0 = 0.004 for He bubbles [marked with stars in Fig. 4(b)]. For the standard method, the same agreement is not found (Fig. 5). Adjusting pa and R0 slightly near the curve of diffusive equilibrium in the pa– R0 plane close to the experimental conditions, the calculations with the present method accord with the experimental results. In these cases, the ionization energies of the inert gases Xe and He decrease by 54% and 76% respectively.
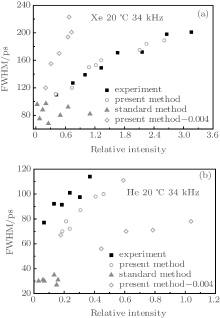 | Fig. 5. Variations of FWHM with the relative light emission intensity of SBSL. The solid squares represent the experimental data from Ref. [28], the empty circles and empty diamonds represent the bubbles selected in Fig. 4 (stars and pentagons, respectively), calculated with the present method, and the solid triangles represent the bubbles selected in Fig. 4 (stars) calculated with the standard method. |
Considering the fact that the SBSL spectra available are measured from the brightest bubbles, we calculate the spectra of suitable Xe and He bubbles. Figures 6(a) and 6(b) show the spectral intensities of Xe and He bubbles, respectively, in 20-° C water with f = 34 kHz. The solid lines represent the results from the experiment.[29] The dashed lines represent the spectra calculated with the present method. When the bubble flashes, the ionization energies of the gases Xe and He decrease respectively by 50% and 48%, and the corresponding degrees of ionization in the bubbles are 13% and 11%. The dotted– dashed lines represent the spectra calculated with the standard method; when the bubble flashes, the degrees of ionization are less than 1% for Xe and 2% for He respectively. From Fig. 6, we can see that with the present method, the calculated spectra are much more consistent with the experimental observations, although there is still a slight discrepancy between the calculated and the experimental spectra from the He bubble. In spite of this, the result for the He bubble is considerably improved compared with previous calculations.
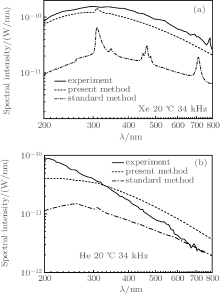 | Fig. 6. Spectral intensities of a Xe bubble (a) and a He bubble (b) in 20-° C water with f = 34 kHz. The solid lines are obtained from experimental data.[29] The dashed and dash– dotted lines denote the results calculated using the present method and the standard method, respectively. |
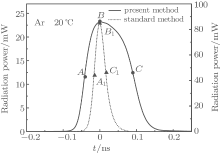
To further understand the processes involved in SBSL, we now compare the differences between the calculations obtained by the present method and those by the standard method. We choose an Ar bubble with R0 = 3.1 μ m and pa = 1.32 atm. The FWHM values are shown in Fig. 2; the circled points P and M represent the present and standard methods, respectively. Figure 7 shows the calculated radiation pulses per flash with the present method (solid line) and the standard method (dotted line). For comparison, the two radiation pulses have the same horizontal axis but different vertical axes. The solid line corresponds to the left vertical axis and the dotted line corresponds to the right vertical axis. It can be seen that the FWHM calculated with the present method is much wider than that calculated with the standard method; this wider pulse width calculated with the present method is closer to the experimental values.
For an Ar bubble, we now investigate how the ionization energy (Fig. 8(a)), the degree of ionization (Fig. 8(b)), temperature (Fig. 8(c)), and pressure (Fig. 8(d)) in the center of the bubble vary with time, t, during SBSL. In Fig. 8, the solid lines represent the results obtained with the present method and the dotted lines denote those obtained with the standard method. With the present method, equation (3) is used to evaluate the reduction of the ionization energy inside the bubble. When the bubble flashes, the ionization energy decreases more and the degree of ionization increases to a greater extent than those with the standard method. However, the temperatures and pressures calculated with the two different methods are similar.
Furthermore, we compare in Fig. 9 the temporal profiles of the ionization energies, degrees of ionization, and opacities in the bubbles corresponding to the times marked in Fig. 7 (i.e., A, B, C and A1, B1, C1). The reduced ionization energy of Ar atoms in the center of the bubble at time B is about 4.6 eV, as shown in Fig. 9(a). This represents a 71% decrease (the ionization energy of Ar is 15.8 eV). The reduced ionization energy corresponds to a degree of ionization of almost 32% near the center of the bubble; see Fig. 9(b). At times A and C, the ionization energies both reduce to about 6.5 eV and they almost decrease by 59%; however, at these times, the temperatures are not sufficiently high and the degree of ionization is less than 5%. We find that in the center of the bubble, the calculated temperature at B is about 1.55 × 10⁴ K, while at A and C the temperatures are about 9.9 × 10³ K and 9.5 × 10³ K, respectively.
 | Fig. 9. Variations of the reduced ionization energies of Ar atom (a), degrees of ionization (b), the values of absorption coefficient κ λ multiplied by the bubble radius R at λ = 310 nm (c), and 812 nm (d) with radial distance r inside a bubble, corresponding to the times (i.e., A, B, and C) marked in Fig. 7. |
We now discuss whether the SBSL bubble is transparent or opaque. For the transparent case, the absorption coefficient κ λ multiplied by the bubble radius R is much less than 1, i.e., κ λ R ≪ 1 and for the opaque case, κ λ R ≫ 1. From Figs. 9(c) and 9(d), we can see that the bubble is almost opaque, both at λ = 310 nm and at λ = 812 nm, during the period of the bubble flash.
The results obtained by using the standard method are shown in Fig. 10. The reduced ionization energies of an Ar atom in the center of the bubble at times A1, B1, and C1 [Fig. 10(a)] are all about 14 eV, and the calculated temperatures in the center of the bubble corresponding to A1, B1, and C1 are about 1.9 × 10⁴ K, 2.0 × 10⁴ K, and 1.8 × 10⁴ K, respectively. Under this condition, the degree of ionization in the bubble is very low, and even at time B1 (when the emission is most intense) the degree of ionization is less than 8% [Fig. 10(b)].
 | Fig. 10. Variations of reduced ionization energies of Ar atom (a), degrees of ionization (b), values of absorption coefficient κ λ multiplied by the bubble radius R at λ = 310 nm (c), and 812 nm (d) with radial distance r inside a bubble, corresponding to the times (i.e., A1, B1, and C1) marked in Fig. 7. |
The values of κ λ R in the bubble are less than 1 at times A1, B1, and C1 for λ = 310 nm, indicating that it is almost transparent as shown in Fig. 10(c). For λ = 812 nm, κ λ R ≫ 1 at times A1, B1, and C1, see Fig. 10(d). The experimentally observed spectra are quite close to the blackbody radiation spectrum. This shows that the results calculated with the present method are more consistent with the experimental observation than with the standard method.
Although our calculation gives the results consistent with the experimental data, this does not, in itself, explain the mechanism of SBSL. Except for using Eq. (3) to calculate the reduced ionization energy in the present calculation, the rest of the calculation is the same as that used in previous studies. By using Eq. (3), the ionization energy of atoms or molecules in the bubble can be dramatically lowered and the ionization degree can be significantly enhanced as the bubble flashes, which results in good agreement between the calculated and the experimentally observed results. A key point is that a large degree of ionization is reached in the SBSL bubble at relatively moderate temperatures. Although we do not claim that equation (3) is correct, the important point is that the expected, large ionization degree cannot be calculated in a bubble using standard equations of reduction of ionization energy.[14, 16] Therefore, we believe that abnormal ionization processes, which result in a high degree of ionization, occur in the SBSL bubble. Nevertheless, it is not suggested that such abnormal ionization processes must necessarily be described by Eq. (3). It is worthwhile to further study the processes that occur inside the bubble during compression when ionization occurs.
We simulate the ionization and bubble conditions during SBSL emission. In the calculation, the reduced ionization energy of atoms or molecules is evaluated by the equation proposed by Yasui, which significantly lowers the ionization energy of the molecule or atom inside the bubble as it flashes. When the ionization energy dramatically decreases, a high degree of ionization ensues at relatively moderate temperatures. Good agreement between the calculation and experimental data is attained. This indicates that abnormal ionization processes, such as that described by Eq. (3), may occur during SBSL. We suggest further research be conducted on this abnormal ionization.
| 1 |
|
| 2 |
|
| 3 |
|
| 4 |
|
| 5 |
|
| 6 |
|
| 7 |
|
| 8 |
|
| 9 |
|
| 10 |
|
| 11 |
|
| 12 |
|
| 13 |
|
| 14 |
|
| 15 |
|
| 16 |
|
| 17 |
|
| 18 |
|
| 19 |
|
| 20 |
|
| 21 |
|
| 22 |
|
| 23 |
|
| 24 |
|
| 25 |
|
| 26 |
|
| 27 |
|
| 28 |
|
| 29 |
|


