Abnormal ionization in sonoluminescence

Abnormal ionization in sonoluminescence |
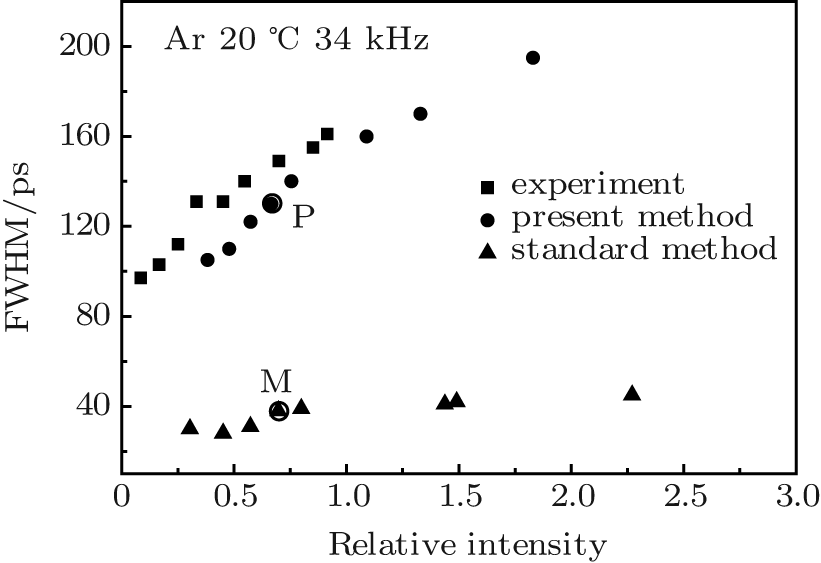
| FWHMs versus relative SBSL intensity. The squares represent the experimental data from Ref. [ 28 ], the circles represent the results from the bubbles selected in Fig. 1 , calculated by the present method, and the triangles represent the results from the same bubbles, calculated by the standard method. |
 |