


Comparison of ligand migration and binding in heme proteins of the globin family
[Nienhaus Karina) , Ulrich Nienhaus G.†a), b), c)  ]
]
]
|
|


†Corresponding author. E-mail: uli@illinois.edu Since March 2015, the author has been on a 12-month sabbatical leave as a visiting scholar at Stevens Institute of Technology, Hoboken, New Jersey 07030, USA.
The binding of small diatomic ligands such as carbon monoxide or dioxygen to heme proteins is among the simplest biological processes known. Still, it has taken many decades to understand the mechanistic aspects of this process in full detail. Here, we compare ligand binding in three heme proteins of the globin family, myoglobin, a dimeric hemoglobin, and neuroglobin. The combination of structural, spectroscopic, and kinetic experiments over many years by many laboratories has revealed common properties of globins and a clear mechanistic picture of ligand binding at the molecular level. In addition to the ligand binding site at the heme iron, a primary ligand docking site exists that ensures efficient ligand binding to and release from the heme iron. Additional, secondary docking sites can greatly facilitate ligand escape after its dissociation from the heme. Although there is only indirect evidence at present, a preformed histidine gate appears to exist that allows ligand entry to and exit from the active site. The importance of these features can be assessed by studies involving modified proteins (via site-directed mutagenesis) and comparison with heme proteins not belonging to the globin family.
Proteins are linear polymers of amino acids that are covalently linked via peptide bonds.[1] The polypeptide chain usually folds into secondary structure elements such as α -helices and β -sheets and assumes a tightly packed, well-defined threedimensional architecture, which is only weakly stabilized and, consequently, displays marked structural fluctuations under physiological conditions.[2– 4] For several decades, these intricate nanostructures have fascinated scientists from a wide range of disciplines. Although protein science is truly transdisciplinary, scientists from a particular discipline approach proteins from a particular direction. Life scientists (e.g., biology, biochemistry, medicine) typically dwell on aspects of protein function and functional interactions within the cellular and organismal context. Chemists are mostly attracted to mechanistic details of protein reactions including protein folding and catalysis. For biophysicists, proteins and other biopolymers are tiny nanomachines; they aim to describe functional details in mechanistic terms. Biological physicists treat proteins as an exciting sort of condensed matter and strive to extract general principles of complex systems from protein structuredynamics- function studies. The rugged energy landscape[5– 9] is a key overarching concept shared by all proteins that is also relevant for other, non-biological systems including glasses, spin glasses, and soft condensed matter.
For many years, myoglobin (Mb) has served as a paradigm in the exploration of the protein energy landscape and its relation to structure, dynamics, and function.[4, 5] Mb is a small heme protein of 17.5 kDa molecular mass. Its 153- meric polypeptide chain folds into eight α -helices that wrap around a disk-shaped heme prosthetic group, which is covalently linked to residue 93 (histidine 93, H93) of the polypeptide chain via its central iron atom. At the heme iron, small ligands such as O2, CO or NO can bind reversibly. In the early 1970s, Mb was widely considered by biochemists as a wellunderstood protein, performing a simple biological function (i.e., dioxygen storage and transport) that could be described by a one-step bimolecular reaction, Mb + O2 → MbO2, as inferred from its single-exponential ligand binding kinetics.[10] This simplistic view had to be abandoned in 1975, when Frauenfelder and coworkers revealed a surprising complexity of ligand binding in their seminal flash photolysis experiments on MbCO and MbO2.[11] They dissolved heme proteins in glycerol-water cryosolvents, which allowed them to perform such experiments over a wide range in temperature, T. By temperature variation, thermally activated rate processes can be slowed and even entirely arrested, which greatly helped to resolve the individual steps in the complex ligand binding process. Their key findings were as follows: For T < 160 K, after photodissociation, ligands rebind to site A at the heme iron from a site B within the protein interior, indicating that they cannot escape into the surrounding solvent in the absence of protein structural fluctuations, which are only activated above ∼ 160 K.We note that this is also the temperature at which the cryosolvent acquires mobility, [12] indicating that the dynamics of the protein and the surrounding hydration shell are intimately coupled. The kinetics of low-T internal (geminate) rebinding are markedly non-exponential. For 40 K < T < 160 K, rebinding can be described by a model invoking a single distribution of enthalpy barriers, so the fraction of molecules that is still in the photodissociated state B at time t after a photolyzing laser pulse is given by

The entire temperature dependence of the kinetics results from the temperature dependence of the rate coefficient kBA via the Arrhenius law, 
with pre-exponential factor, ABA, gas constant, R, and reference temperature, T0, set to 100 K. The presence of a distribution of enthalpy barriers, g(HBA), implies that proteins do not exist in a unique structure of minimal free energy, but rather assume a huge number of conformational substates with markedly different rebinding rate coefficients. At low temperatures, they form a frozen, non-interconverting ensemble. We note that, for T < 40 K, molecular tunneling becomes noticeable in addition to thermal (Arrhenius) activation.[13, 14]
For T > 160 K, additional features were observed in the rebinding kinetics.[11] Two further processes were found to be independent of ligand concentration in the sample and, therefore, also assigned to internal, or geminate, rebinding of ligands that remain associated with the protein after photodissociation. Finally, the slowest, exponential process was unambiguously assigned to bimolecular binding of ligands from the solvent, based on its dependence on the ligand concentration in the solvent. Overall, a kinetic model with five states separated by four sequential barriers governing ligand binding reproduced the data well.[11] It was based on an essentially static, temperature-independent reaction enthalpy surface. Structural interpretations were also provided, but in the absence of experimental evidence, they were mere speculation at the time.
After this seminal work, it took ∼ 30 more years until, finally, a profound understanding of the details of this simple biological process was achieved. Some new experimental results and theoretical considerations, although being fundamentally important, initially even generated confusion. For example, Henry et al.[15] reported biphasic kinetic curves for MbCO flash photolysis at room temperature, suggesting that a three-state model suffices to explain MbCO rebinding under physiological conditions (Fig. 1(a)), with a bound state A, an unbound state B with the ligand in the heme pocket, and a state S, in which the ligand has escaped into the solvent. Another complication arose from attempts to introduce intrinsic relaxation dynamics into the reaction energy landscape. In 1983, Agmon and Hopfield[16] presented a model in which the internal barrier, HBA, increases with time after ligand dissociation due to protein structural relaxations from the ligand-bound conformation immediately after ligand dissociation to an equilibrium deligated (“ deoxy” ) conformation. Frauenfelder and coworkers[6, 9, 17] showed that the observed temperature dependence of the kinetic data, and also band shifts of heme electronic transitions, can indeed support such a scenario, assuming that HBA increases by ∼ 11 kJ/mol. However, detailed quantum-chemical calculations by McMahon et al.[18] subsequently provided strong evidence that enthalpy barrier increases due to protein relaxation are only of limited extent in Mb. In fact, as we now know, the temperature-dependent peculiarities of the ligand rebinding kinetics in MbCO and MbO2 between 160 K and 300 K arise by and large from the involvement of additional kinetics, introduced as states C and D by Austin et al.[11]
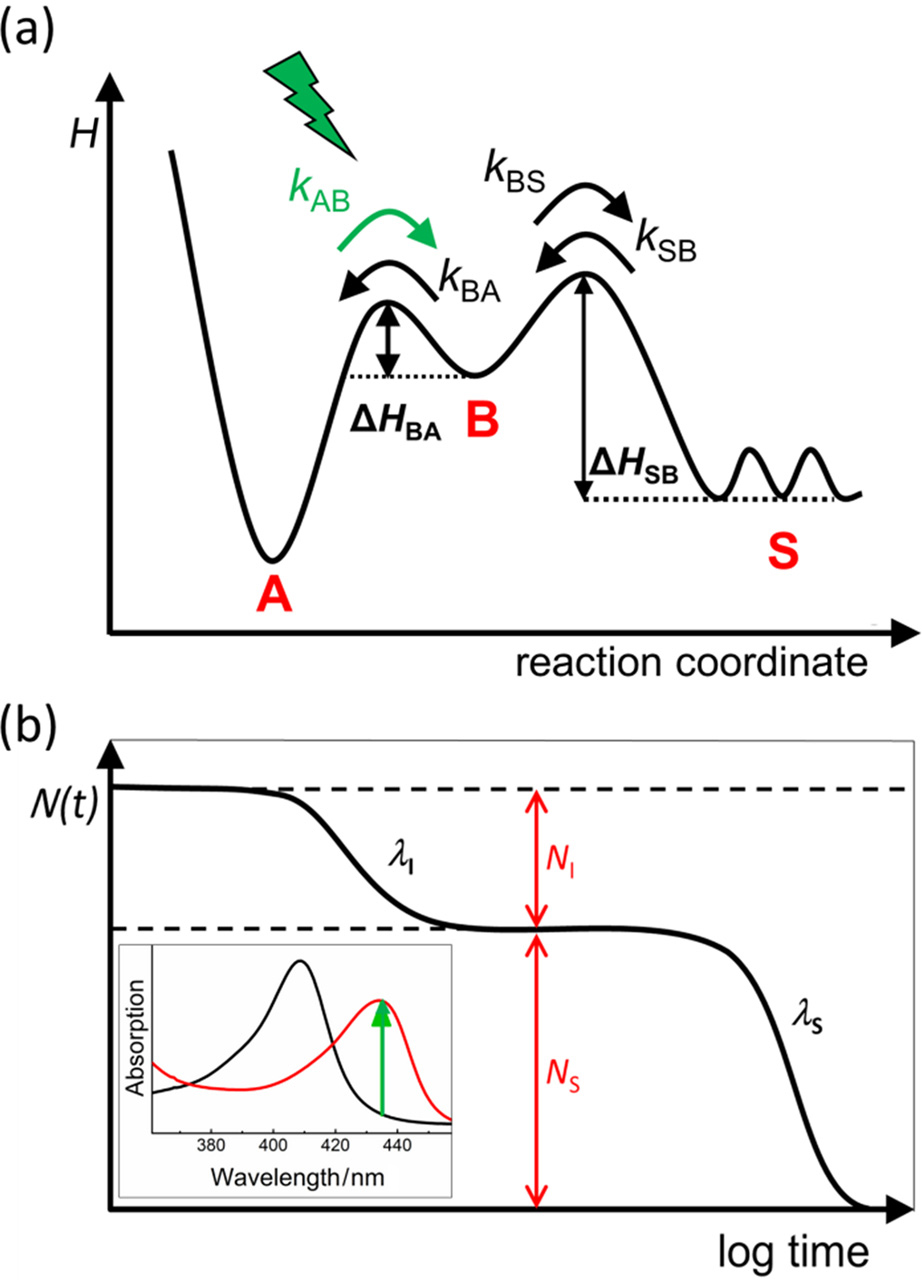 | Fig. 1. Time-resolved UV/visible absorption spectroscopy on heme proteins. (a) Three-well model describing ligand binding in Mb. (b) Schematic depiction of a two-step rebinding process. Fast step: geminate rebinding. Slow step: bimolecular rebinding. NI, S: fraction of ligands that rebind internally/from the solvent. λ I, S: rate coefficients. Inset: Steady-state absorption spectra of a CO-ligated (black) and a deligated ferrous (red) heme (here: Mb). |
A deep, mechanistic understanding of these effects, however, had to await the structural characterization of various photoproduct intermediates that form after ligand photodissociation and their kinetic/spectroscopic assignment. Starting in 1994, x-ray structures of MbCO photoproducts appeared.[19– 22] Upon illumination of MbCO crystals below ∼ 40 K, photodissociated CO ligands were observed in site B on top of pyrrole ring C of the heme group, oriented parallel to the heme plane. Thus, the ligands remain near the heme iron, as was predicted from MbCO mutant studies and anticipated from the observation of molecular tunneling at low T, which due to the large masses and the associated small de- Broglie wavelengths requires very small tunneling distances (< 1 Å ).[23] Importantly, by using picosecond IR spectroscopy, Anfinrud and coworkers confirmed that the B site is the primary ligand docking site also in ligand binding at physiological temperatures.[24, 25] In 1997, Scott and Gibson[26] proposed a rebinding model that contained the primary docking site B and two secondary docking sites, assigned to internal cavities within Mb (Xe4 and Xe1), which had been identified in Mb already in 1984 owing to their ability to bind xenon atoms.[27] Shortly afterwards, Fourier transform infrared (FTIR) temperature derivative spectroscopy experiments on MbCO gave the first spectroscopic hint that ligands can indeed migrate to other sites within the protein even at cryogenic temperatures when the sample is subjected to extended illumination.[28] Intricate illumination protocols were developed to enhance specific photoproduct populations in MbCO solutions and crystals.[28– 30] These efforts culminated in x-ray structures of these intermediates at cryogenic temperatures, proving that ligands can diffuse from the initial docking site B into the Xe4 and Xe1 cavities.[31– 34] Only a few years later, ‘ movies’ of ligands populating the internal sites after photodissociation were generated by using time-resolved x-ray crystallography.[35– 38] However, they do not directly reveal ligand transitions between sites. Notably, the key question as to how ligands enter or exit the Mb protein is still controversially discussed.[35, 39, 40] In 1966, Perutz and Matthews[41] had already envisioned that a rotation of the distal histidine side chain (H64 in Mb) could form a short, direct channel between the heme pocket and the solvent. Experimental evidence in favor of the histidine gate will be discussed below.
The key realization from all this work is that, in addition to the ligand binding site at the heme iron, a primary ligand docking site exists in the heme pocket that ensures efficient ligand binding to and release from the heme iron. There are also secondary ligand docking sites (Xe4 and Xe1 cavities), giving rise to kinetic states C and D in the rebinding kinetics.[11] The secondary sites greatly affect the ligand binding process, although their physiological relevance is presently not entirely clear. In this work, we compare heme proteins of the globin family and explore similarities and differences in the mechanistic details of their ligand binding reactions.
Flash photolysis kinetics at ambient temperature were measured on dilute samples dissolved in aqueous buffer. A buffer solution (1 ml– 2 ml 100-mM sodium phosphate/citrate (pH 4– 6), sodium phosphate (pH 6.2– 8.6) or sodium carbonate buffer (pH > 8.6)) filled a 3 cm × 1 cm × 1 cm glass cuvette sealed with a rubber septum and was equilibrated with 0.05 atm or 1 atm CO partial pressure under anaerobic conditions. Subsequently, 1-M sodium dithionite solution was added to a final concentration of 100 μ M by using a gas-tight syringe, and a few microliters of a concentrated protein stock solution were added to a final concentration of ∼ 10 μ M. For low-T experiments, the aqueous buffer was replaced by 75% glycerol/25% buffer (vol/vol) to ensure transparent samples in the entire temperature range. Typically, up to five hundred kinetic transients were averaged to yield a low-noise rebinding transient.
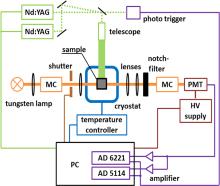
Figure 2 shows a schematic diagram of our home-built flash photolysis system.[42] In this setup, the sample is photolyzed by a 532-nm, 6-ns (full width at half maximum) pulse from a frequency-doubled, Q-switched Nd:YAG laser (Surelite II, Continuum, Santa Clara, CA); typical pulse energies are ∼ 100 mJ. For the monitoring beam, we use a 150-W tungsten lamp in a parabolic reflector housing (model A 1010, PTI, Brunswick, NJ). The light is passed through a monochromator and guided by lenses through the sample, a notch filter and a second monochromator to suppress scattered light from the 532-nm laser pulse and, finally, onto a photomultiplier tube (model R5600U, Hamamatsu Corp., Middlesex, NJ), which converts the intensity of the transmitted light into a voltage signal. The PMT output is fed into two analog-to-digital converter cards (NI-PCI 5114 and NI-PCI 6221, National Instruments, Munich, Germany) and digitized in the time ranges 4 ns– 3 ms and > 4 μ s, respectively, to yield a rebinding trace.
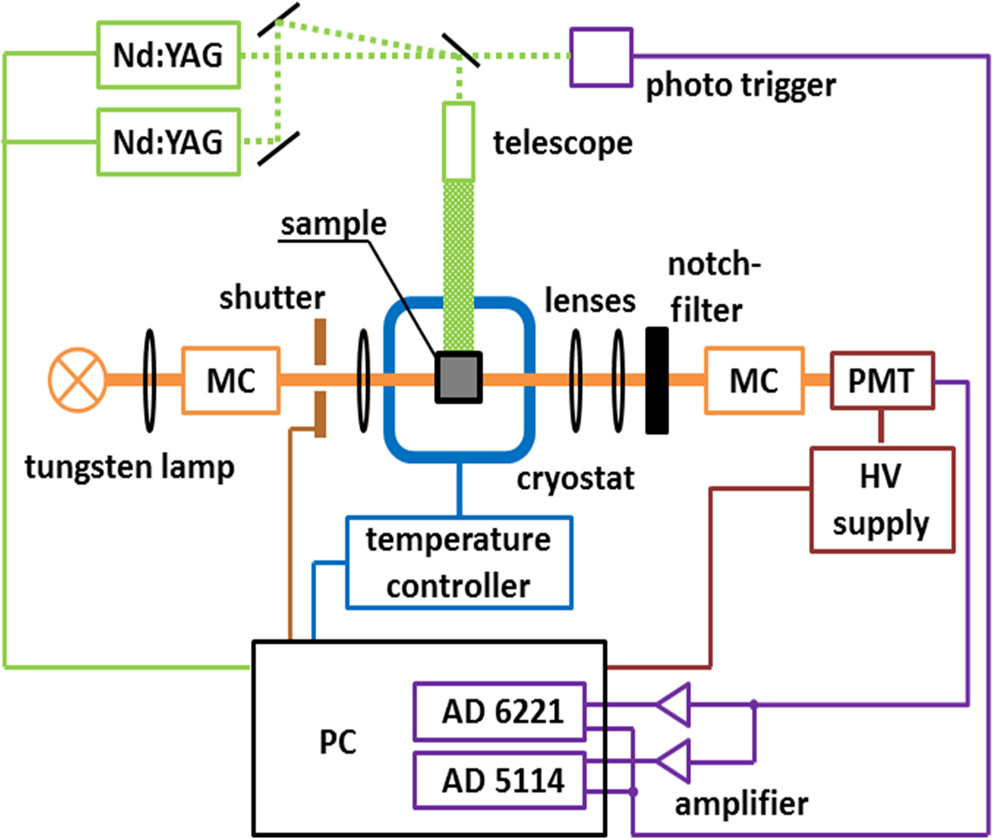 | Fig. 2. Experimental setup of our home-built flash photolysis system. MC, monochromator; PMT, photomultiplier tube; HV, high voltage. |
In the experiment, we measure time-dependent changes in the absorption of light due to a brief laser pulse. The absorbance, or optical density, A(λ ), of a sample is given by Beer’ s law,

with incident light intensity, I0, light intensity after passing through the sample, I, extinction coefficient ɛ (λ ), concentration c and path length l. The optical density is thus proportional to the concentration of the absorbing species.
To follow ligand binding, we monitor the strong electronic transition at ∼ 400 nm (Soret band) of the heme prosthetic group, which is sensitive to the binding of ligands to the heme iron (Fig. 1(b), inset) and even to protonation events and structural changes in its vicinity.[8, 43] In flash photolysis experiments, CO is often preferred over the physiological ligand O2 because of technical advantages. Heme auto-oxidizes in the presence of O2, which introduces experimental problems, and CO has additional spectroscopic advantages including a strong infrared absorption (see Refs. [44] and [45] and references therein). Moreover, although CO and O2 can both be photodissociated with a quantum yield of 100%, [46– 48] a considerable fraction of the O2 ligands cannot be observed in nanosecond flash photolysis experiments, even at ∼ 4 K, [49] because they rebind in an essentially barrier-less fashion on the picosecond time scale. Therefore, using CO simplifies the experiments and, due to its similar size, still allows similar ligand migration effects to be probed as with O2.
In the experiments reported here, we have monitored the intensities of the transmitted light (typically at 436 nm) as a function of time, so that we can calculate the absorbance change according to

where I(0− ) denotes the intensity just before the laser flash impinges on the sample. Assuming that the observed absorbance changes arise only from ligand rebinding, the fraction of proteins that have not bound a ligand at time t after the photolyzing pulse, N(t), is given by

Here, Δ Amax denotes the absorbance change upon complete photolysis, which can be determined from steady-state spectra. If the absorbance change recorded at the earliest time is less than expected, rate processes occur on timescales faster than the time resolution of our nanosecond-resolving instrument.
The kinetics of ligand binding to heme proteins typically show multiphasic behavior. The three-state model, with bound state A, geminate state B, and ligand-dissociated state S, is the simplest model capturing the essential aspects (Fig. 1(a)). Therefore, we will briefly discuss it here. The three states are interconnected by four microscopic rate coefficients, kAB, kBA, kBS, and kSB. Bimolecular rebinding, i.e., binding of a ligand from the solvent, involves surmounting two sequential barriers, Δ HSB and Δ HBA, associated with ligand entry/exit and bond formation, respectively. If the two kinetic processes are temporally well separated (kSB ≪ kBA or kBS), and kAB ≈ 0, the three-well model has a very simple solution. Immediately after the photolyzing flash, all ligands are at site B, so that the fractional populations, NA(0) = 0, NB(0) = 1, NS(0) = 0, and the development of the photodissociated fraction over time,

is given by two sequential exponential processes (assuming well-defined Δ HSB and Δ HBA), representing geminate and bimolecular rebinding (Fig. 1(b)),

with fractional amplitudes,

and apparent rate coefficients,

Here, the subscripts ‘ I’ and ‘ S’ stand for ‘ internal’ and ‘ solvent’ . Because solvent rebinding is a bimolecular process, the observed bimolecular rebinding depends on the ligand concentration [L]. Typically, the experiments are carried out with a large excess of ligand, [L] ≫ [P], so [L] is time-independent during the reaction and can be described with a constant pseudo-first order rate coefficient, 

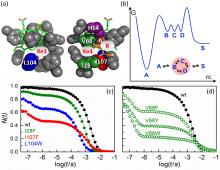
Structural details of MbCO in the vicinity of the active site are displayed in Fig. 3(a), including the heme group, important amino acid residues and the CO ligand in the boundstate position A. The primary docking site B and the secondary sites C and D (Xe4 and Xe1 cavities) are also indicated.
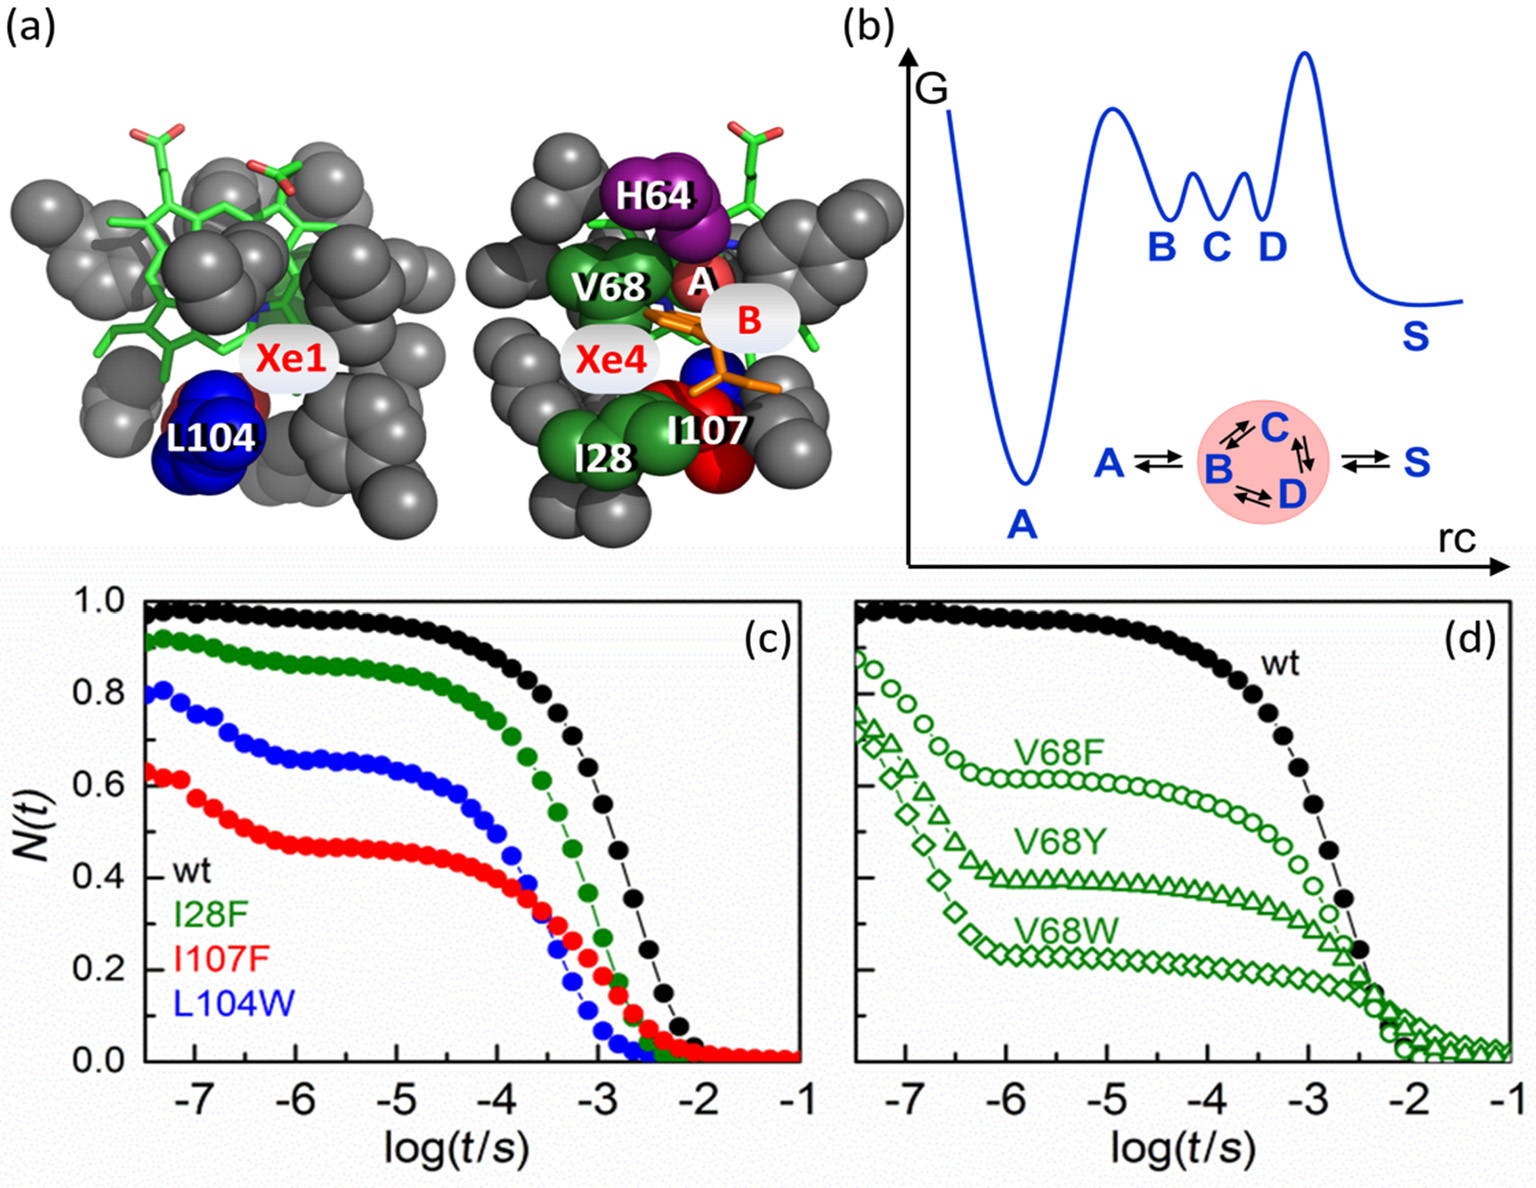 | Fig. 3. (a) Essential features at the active site of wild-type MbCO. View onto the proximal (left) and the distal (right) sides of the structure. (b) Reaction free energy landscape describing ligand binding in Mb. (C. D) Flash photolysis kinetics of CO rebinding (at 1-bar CO) monitored at 436 nm and 20 ° C. (c) Wild-type Mb (black symbols), I28F Mb (green), L104W Mb (blue), I107W Mb (red). (d) Wild-type Mb (black symbols), V68F Mb (green circles), V68Y Mb (green triangles), V68W Mb (green diamonds). |
CO rebinding in wild-type Mb after photolysis of the ligand at ambient temperature is plotted (in black) from 30 ns to 0.1 s in Fig. 3(c).[50] To show the fraction of proteins without a ligand at time t after photolysis, N(t), the absorbance difference was scaled according to the change expected on the basis of steady-state spectra of the CO-bound and CO-free (deoxy) species. Thus, we observe essentially 100% photodissociation at 30 ns. A tiny step between 100 ns and 1 μ s is barely visible; this is the geminate rebinding process, which involves only 4% of the population.[15] The remaining 96% rebind from the solvent on the millisecond timescale. We have also included rebinding traces of Mb mutants I28F (green), L104W (blue), and I107W (red) in Fig. 3(c). These mutants were designed to fill the internal Xe cavities with bulky side chains so that CO cannot reside in them.[30] We mention in passing that a related strategy, namely to fill the cavities with Xe atoms, leads to comparable results.[50] In mutant I28F, a bulky benzyl moiety fills the Xe4 cavity (site C, see Fig. 3(a)). In mutant L104W, site D is blocked by the huge indole double ring of residue W104, and in mutant I107W, the indole constricts the pathways to both the C and D sites (Fig. 3(a)). For all three mutants, geminate recombination is markedly enhanced; the fraction of ligands escaping from the protein, NS, is reduced in the order wild-type > I28F > L104W > I107W. Moreover, enhanced geminate rebinding, i.e., increased NI, is associated with faster bimolecular rebinding because λ S = kSBNI (Eq. (9)). I107W MbCO shows non-exponential bimolecular rebinding, indicating that subconformations with markedly different rebinding rates exist in deligated I107W MbCO, which interconvert on times slower than milliseconds.
For a three-well-model with bound state A, photoproduct state B inside the protein and solvent state S, λ S (Eq. (9)) can be rewritten as

and, thus, as a product of rate coefficient kBA, the pocket occupation factor PB, which represents the equilibrium coefficient for binding CO at the B site if there were no recombination at the heme iron, and NS, the probability of ligand escape from the protein after dissociation from the heme iron.[51] To include multiple internal CO binding sites, we assume that the photolyzed CO molecules quasi-equilibrate among states B, C, and D before either rebinding or exiting, as depicted by the shaded circle in the inset of Fig. 3(b). This means that ligand transitions between B, C, and D are faster than ligand binding to the heme iron or exit from the protein. Consequently, the reaction free energy surface for CO binding to Mb (Fig. 3(b)) displays an inner barrier (bond formation) and an outer barrier (ligand entry/exit) much larger than the internal barriers between geminate sites B, C, D. Then, states B, C, and D can be treated formally as a single kinetic state in a three-well model with bound state A, geminate state (B, C, D) and solvent state S. This arrangement decreases the probability of CO to reside at site B, which is the only site from which ligands can recombine. Following the treatment given in Ref. [50], the rate coefficient kBA is rescaled by an ‘ internal’ pseudo-equilibrium factor PB/CD, which is defined as an equilibrium coefficient between state B and states C, D in the absence of binding or escape,

With Eq. (11), λ S can be written as
In Eq. (12), we have also introduced a modified pocket occupation factor PBCD/S, which represents the overall equilibrium population at internal sites B, C, and D with respect to the solvent S (if no recombination would occur at the heme iron). NS denotes the overall probability of CO exit from either geminate site (B, C, D).
Overall, comparison of the Mb variants with modified internal docking sites gives a clear picture of their mechanistic roles in ligand escape from and ligand binding to Mb. After photodissociation, ligands initially settle in site B, from where they can either escape or re-establish the bond with the heme iron. Binding of CO at geminate sites B, C, and D is governed by weak van-der-Waals interactions. With the secondary sites C and D available, the CO ligands fluctuate among states B, C, and D and spend only a small fraction of time on average in the reactive site B. Therefore, CO ligands have a lower probability of rebinding internally, and more likely escape into the solvent via channels formed transiently by large-scale protein fluctuations. For wild-type Mb, the observed geminate rebinding yield of 4% indicates that a covalent bond with the heme iron is formed only once for 25 CO entries into protein (on average). In the mutants with blocked secondary sites, photodissociated ligands have a higher probability to reside at the primary docking site B. Accordingly, their probability to rebind geminately is enhanced because sites C and D are (partially) occluded.
CO ligands entering the protein from the outside, presumably via the histidine gate[52] (see below), eventually arrive at site B. In the Mb variants with (at least partially) blocked secondary docking sites C and D, the probability to remain unbound inside the protein is reduced, i.e., an immediate reescape is less likely and, as a result, bimolecular rebinding is also faster. Occluding sites C and/or D effectively reduces the number of ligand entries without subsequent bond formation.
Replacing amino acid V68 also alters the size and shape of the distal pocket, especially in the vicinity of the primary docking site B (Fig. 3(a)). If bulky amino acids are introduced, the volume of site C is also reduced, [53] and escape to site D is hindered.[54] Therefore, ligands are observed to predominantly rebind from B because of the roadblock at position 68, resulting in the high geminate yield (Fig. 3(d)); only a small fraction of ligands manage to escape into the solvent. In contrast to our findings with the I28F, L104W, and I107W variants, their bimolecular rebinding becomes slower with increasing geminate yield. This behavior results from the reduced access to site B if a bulky amino acid resides at position 28, so incoming ligands can no longer be captured efficiently at site B and escape again.
In summary, ligand binding in Mb at physiological temperatures can be described by an effective three-state model with kinetic states A, (B, C, D) and S, with state (B, C, D) comprising three internal docking sites. Bond formation to the heme iron can only occur from the primary docking site B, however. Sites C and D are not located on the actual ligand entry and exit route.
Unlike monomeric Mb, hemoglobin I (HbI) from the blood clam Scapharca inaequivalvis is a dimeric heme protein, [55] with two identical polypeptide chains associated to form the functional unit (Fig. 4(a)). Low temperature FTIR experiments on CO-ligated HbI have shown that photodissociated ligands visit a primary docking site B and also two secondary sites C and D, which coincide with two cavities (Xe4 and Xe2) in the protein that were shown to accommodate xenon atoms in the crystal structure.[56] Bulky residues at position 25 (corresponding to position 28 in Mb) block site C with their side chains; [56] a bulky residue at position 114 blocks the channel towards sites C and D, just like residue 107 in Mb.[57] Interestingly, the distal histidine, H69 (analogous to H64 in Mb), is located at the dimer interface (Fig. 4(a)).[58] Because opening of the histidine gate for ligand entry or exit requires structural rearrangements involving H69 and adjacent residues, which could be severely hindered at the dimer interface, this situation raises the intriguing question whether ligands enter or exit via the histidine gate, or if they utilize other routes.
 | Fig. 4. (a) Essential features of the HbICO dimer. (b) Flash photolysis kinetics of CO rebinding (at 0.05-bar CO) in HbICO variants dissolved in buffer (closed symbols) and 75%/25% glycerol/buffer (open symbols), monitored at 436 nm and 20 ° C. Black, wild-type HbI; green, I25W HbI; red: I114F HbI; purple, H69L HbI. |
Comparison of CO rebinding in wild-type HbI and variants I25W and I114F at ambient temperature shows enhanced geminate rebinding in the mutants (Fig. 4(b)), as was observed for Mb and its corresponding mutants. However, in contrast to the results with Mb (Fig. 3(a)) and the expectations from the three-state model (Eq. (10)), the bimolecular rebinding rates are essentially identical for all three HbI proteins. This finding is explained by the conformational transition from the highaffinity R state to the low-affinity T state of the quaternary structure of dimeric HbI that occurs after photolysis of the CO.[59] The R– T transition includes a movement of residue 97 from the subunit interface into the proximal heme pocket, reorganization of an interfacial water cluster, and relocation of the heme groups toward the subunit interface. The intercalation of water molecules within the subunit interface is reflected by the increase of the absorption difference, Δ A, on the microsecond timescale (Fig. 4(b)). Because of the heme relocation, the steric interference between the H69 side chain and the approaching ligand is increased in the unligated T-state, so geminate rebinding is suppressed and the association rates are lowered. In glycerol/buffer solvent, the protein stays in the R-state, so the geminate process is not hindered by H69, and bimolecular rebinding is generally faster than in the T-state (Fig. 4(b)).
Despite these additional complications, the effects of single amino acid replacements in Mb and HbI are analogous, suggesting that ligands use similar migration routes, including the histidine gate. Flash photolysis experiments on HbI mutant H69L provided further evidence that, as in Mb, the histidine side chain constitutes a ‘ gate’ , which rotates to transiently open a channel in the protein matrix for ligand entry and exit.[56] Replacement of the distal histidine, H69, by leucine greatly increases the geminate yield and the CO association rate (Fig. 4(b)). Both effects support the notion that H69 is the entry/exit gate because such a substitution has two effects: It relieves steric hindrance at the heme iron by preventing water from approaching the active site, and it also opens a channel between the heme pocket and the solvent. These findings also imply that, as in Mb, the secondary sites are not located on the ligand migration pathway into and out of the protein.
Overall, the kinetics of ligand binding in HbI can be modelled in a similar way as in Mb, with a three-state kinetic model, with a bound state A, a state in which the ligand stays unbound at a small number of sites within the protein, and a solvent state S. However, for HbI, there is a pronounced effect due to the R– T quaternary transition, so that the three states have different properties in the R and T states.
Neuroglobin (Ngb) is a monomeric heme protein expressed in the central and peripheral nervous system of mammals, in the cerebrospinal fluid, in the retina and in endocrine tissues, which was discovered in the year 2000.[60] It is thought to be involved in neuroprotection under hypoxic or ischemic conditions.[61] Its active site structure differs markedly from Mb and HbI.[62, 63] Without an exogenous ligand, the heme iron is hexacoordinated by the proximal and distal histidines, H96 and H64, in both the ferric (Fe3+ heme) and ferrous (Fe2+ heme) states (Fig. 5(a)). Therefore, binding of an exogenous diatomic ligand is only possible after cleavage of the Fe-H64 bond.
 | Fig. 5. (a) Active site structures of Ngb in the bishistidine- hexacoordinate (red, pdb code 1Q1F) and CO-ligated (black, pdb code 1W92) states. (b) CO rebinding in Ngb monitored at 436 nm and 293 K. Closed symbols: 1-bar CO; open symbols: 0.05-bar CO. Inset: geminate phase recorded at 275 K. (c) Contour plot showing the time dependence (30 ns– 3 s) of the photolysis difference spectrum of NgbCO (400 nm– 450 nm). Schematic depictions of photolysis difference spectra at 10 μ s (blue line) and 100 ms (red line) after the flash are included. Dotted black line: kinetics measured at 436 nm. |
In Fig. 5(b), we have plotted the time traces of CO recombination to murine Ngb after photolysis at 293 K for two different CO concentrations, observed at a wavelength of 436 nm. The absorbance data were normalized to N(t) = 1 at the earliest time points. As for MbCO rebinding, the experimental data (symbols) show two steps.[64, 65] However, in contrast to MbCO, the fast step depends on the CO concentration and, thus, represents bimolecular recombination, whereas the second, slow step is independent of the CO concentration. We note that geminate rebinding is also present, but it is too fast to resolve with our nanosecond-resolving instrument at 293 K. It is, however, detectable at 275 K (Fig. 5(b), inset).[64]
To correctly interpret the two-step kinetics, one has to consider the peculiar structure of Ngb (Fig. 5(a)).[62] After photodissociation of the Fe– CO bond, the iron is pentacoordinate and extremely reactive. Therefore, geminate rebinding is very fast at 293 K and outside the time window of our experimental setup. Still, a major fraction of CO ligands is able to escape into the solvent and, upon returning to the heme iron, competes with the endogenous H64 for the vacant binding site at the heme iron. Thus, the fast step in the kinetics results from both CO binding and H64 binding. Subsequently, all iron atoms are hexacoordinated. Because the absorption spectra of NgbCO and the histidine-bound Ngb species are different, a plateau develops for times between ∼ 1 ms and 1 s (Fig. 5(b)). As CO binding to the pentacoordinate heme is bimolecular and endogenous ligand binding is unimolecular, the fraction with bound H64, represented by the amplitude of the plateau, increases with decreasing CO concentration. Only after thermal dissociation of the endogenous ligand at t > 1 s, CO can form the thermodynamically more stable complex, as shown by the decay of the plateau.[63]
The two kinetic steps are well separated in time, indicating that the rate coefficient of histidine dissociation from the heme iron, k− His ≪ kHiskCO. CO rebinding can be described by

Here, λ 1 and λ 2 are the apparent rate coefficients of the first and second step, respectively,


The approximation in Eq. (15) is well justified because N2≪ N1. The fractions of Ngb molecules binding in the first and second step, are given by

where kCO = k′ CO · [CO] is a pseudo-first order rate coefficient.
To support the interpretation of these kinetics, it is helpful to examine the time evolution of the entire spectrum by performing nanosecond time-resolved spectroscopy by monitoring at different wavelengths. These data are shown as a contour plot of the spectral changes occurring in the Soret region between 400 nm and 450 nm after photolysis in Fig. 5(c). Dashed black contour lines represent the missing absorption of the CO-ligated form, whereas solid black contour lines represent the additional absorption due to the transient unligated species. The difference spectrum at ∼ 10 μ s after the flash (Fig. 5(c), blue line) shows that CO-ligated Ngb absorbs at 415 nm; unligated Ngb absorbs at 432 nm, which is characteristic of a pentacoordinate heme. At ∼ 100 ms, the maximum has shifted to 425 nm (red line in Fig. 5(c)), indicating that the iron coordinates to the distal histidine at this time. The dotted black line in Fig. 5(c) marks the wavelength (436 nm) at which the kinetic traces shown in Fig. 5(b) were recorded. It shows that the amplitude of the slow kinetic step (Fig. 5(b)) does not reflect the actual fraction of H64-ligated Ngb.
Recently, we have combined atomistic simulations and FTIR spectroscopy experiments to elucidate possible CO migration pathways in Ngb.[66, 67] Analogues of the secondary docking sites B and C in Mb were identified unambiguously. After photodissociation of NgbCO, ligands initially become trapped at the primary docking site B, from where they are able to migrate to site C (and other sites), which is reminiscent of Mb. Likewise, as in Mb, [68– 70] an aromatic amino acid at position 28 (position 29 in Mb) results in increased trapping in the C site.
Comparison of three different globins, Mb, HbI, and Ngb, suggests that ligand migration between multiple internal docking sites is a general phenomenon observed in this protein family. In particular, a well accessible primary docking site B was found to be indispensable for efficient ligand binding and release, and secondary docking sites enhance the probability of ligand escape after dissociation from the heme iron. Recently, we have shown that such a B site is likewise important for indoleamine 2, 3-dioxygenase (IDO), a heme enzyme that does not belong to the globin family, to bind dioxygen and to perform its physiological function.[71] Cytochrome c (Cyt c) is a small electron-carrying heme protein that does not bind exogenous ligands because its heme iron is axially coordinated by the endogenous residues H18 and M80. However, a ligand binding functionality can be engineered into Cyt c by replacing M80 by amino acids that do not coordinate to the heme iron, such as alanine. These Cyt c variants are completely useless as reversible ligand storage devices. As the protein matrix does not provide internal ligand docking sites such as the primary B site near the heme iron, ligand binding to these Cyt c mutants is extremely fast (picosecond timescale) even at very low temperatures; ligand escape is essentially impossible.[72]
However, there are also heme proteins that show efficient ligand binding and release, but do not make use of docking sites. An example is nitrophorin 4 (NP4, Fig. 6), an NO transporter that relies on a ferric (Fe3+ ) heme group. NO binding to NP4 occurs at a site that is accessible to the aqueous environment at pH 7. As soon as the NO has vacated the binding site, the ferric heme iron coordinates a water molecule so that immediate reassociation of NO to the ferric iron is impossible and, instead, ligand escape is promoted.[73]
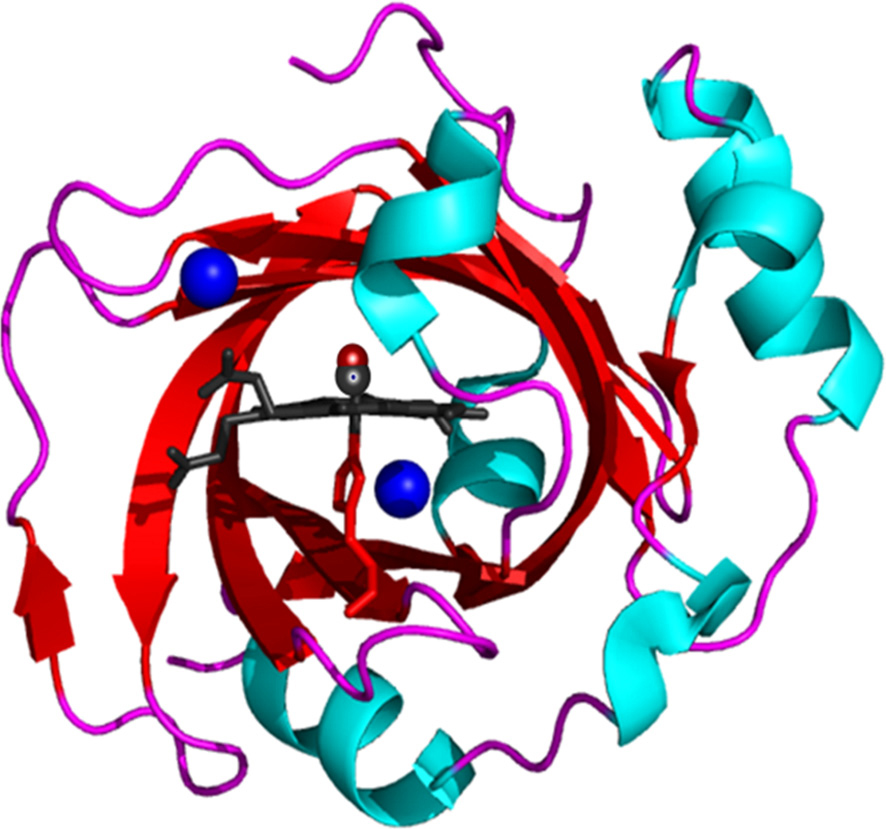 | Fig. 6. Cartoon representation of NP4 (pdb code 1U0X). Blue spheres mark the protein cavities Xe1 and Xe2. |
For heme proteins, large amounts of spectroscopy and crystallography data have been amassed to observe ligands on their migration pathways. Still, the direct observation of ligands migrating between the different way stations on their route from the outside to the active site has remained elusive. In fact, there is no direct experimental evidence identifying the entry/exit portal for ligands into Mb or other globins. Perutz and Mathews[41] first speculated that rotation of the distal histidine side chain (H64 in Mb, Fig. 3) could form a channel between the heme pocket and the solvent. Later on, crystal structures of Mb with bulky ligands bound to the heme iron were determined.[74, 75] They showed that an exit channel can be pried open by these ligands, which are not well accommodated in the heme pocket. Case and Karplus[76] also obtained supporting evidence for such a scenario in their early work using molecular dynamics simulations. However, there are also reports arguing in favor of multiple pathways, including a high-throughput flash photolysis experiment on more than 1500 Mb variants.[77] More recently, Cohen et al.[39] suggested again that multiple ligand pathways exist in Mb, based on molecular dynamics simulation studies.
In our view, the strongest experimental evidence of ligand entry and escape via the ‘ histidine gate’ presently comes from a time-resolved x-ray crystallography study on Mb mutant L29W.[35, 78] In this mutant, CO rebinding is exceptionally slow (t1/2 > 20 ms). Moreover, an extremely long residence time of the photodissociated CO in secondary docking site D (Xe1, half-life t1/2 ∼ 1.5 ms) was observed, which is more than two orders of magnitude in time longer than in wildtype MbCO (t1/2 ∼ 10 μ s).[79] It is even longer than the overall rebinding process in wild-type MbCO (t1/2 ∼ 150 μ s).[79] In L29W MbCO, the voluminous indole side chain of W29 (Fig. 3(a)) blocks the pathway for CO migration from secondary site D via C to the distal heme pocket.[31] To return, the ligand has to wait for rare fluctuations that open this path. The enormously long residence time in D clearly proves that the CO in L29W has no alternative pathway available to leave the Xe1 cavity, at least on timescales relevant for the ligand binding reaction. At one point, the W29 side chain opens the channel to the distal pocket, so that the CO ligands can return to the distal pocket. Apparently, they can escape from the protein from there, presumably by an opening fluctuation of the histidine gate. Only much later (t1/2 ∼ 20 ms), CO ligands are found to rebind to the heme iron.
The work presented here exemplifies the challenges involved in studying even the simplest biological reactions in atomistic detail. Evidently, such detailed investigations can only be performed on select model proteins; they teach us general principles that can be transferred to the vast number of proteins in the biological world.
It is a great pleasure to acknowledge fruitful collaborations with many researchers in the heme protein field, especially with H. Frauenfelder (Los Alamos National Labs, Los Alamos, NM), J. S. Olson (Rice University, Houston, TX), F. Parak (TU Munich, Munich, Germany), M. Schmidt (University of Wisconsin, Milwaukee, WI), W. E. Royer (UMass Medical School, Worcester, MA), W. R. Montfort (University of Arizona, Tucson, AZ), M. Brunori and B. Vallone (University of Rome “La Sapienza”), M. Meuwly (University of Basel, Basel, Switzerland), S. R. Yeh and D. Rousseau (Albert Einstein College of Medicine, New York, NY). GUN was supported by the Deutsche Forschungsgemeinschaft (DFG, grant Ni291/10).
| 1 |
|
| 2 |
|
| 3 |
|
| 4 |
|
| 5 |
|
| 6 |
|
| 7 |
|
| 8 |
|
| 9 |
|
| 10 |
|
| 11 |
|
| 12 |
|
| 13 |
|
| 14 |
|
| 15 |
|
| 16 |
|
| 17 |
|
| 18 |
|
| 19 |
|
| 20 |
|
| 21 |
|
| 22 |
|
| 23 |
|
| 24 |
|
| 25 |
|
| 26 |
|
| 27 |
|
| 28 |
|
| 29 |
|
| 30 |
|
| 31 |
|
| 32 |
|
| 33 |
|
| 34 |
|
| 35 |
|
| 36 |
|
| 37 |
|
| 38 |
|
| 39 |
|
| 40 |
|
| 41 |
|
| 42 |
|
| 43 |
|
| 44 |
|
| 45 |
|
| 46 |
|
| 47 |
|
| 48 |
|
| 49 |
|
| 50 |
|
| 51 |
|
| 52 |
|
| 53 |
|
| 54 |
|
| 55 |
|
| 56 |
|
| 57 |
|
| 58 |
|
| 59 |
|
| 60 |
|
| 61 |
|
| 62 |
|
| 63 |
|
| 64 |
|
| 65 |
|
| 66 |
|
| 67 |
|
| 68 |
|
| 69 |
|
| 70 |
|
| 71 |
|
| 72 |
|
| 73 |
|
| 74 |
|
| 75 |
|
| 76 |
|
| 77 |
|
| 78 |
|
| 79 |
|