


High-contrast imaging based on wavefront shaping to improve low signal-to-noise ratio photoacoustic signals using superpixel method
Cite this Article
Lv Xinjing, Xu Xinyu, Feng Qi, Zhang Bin, Ding Yingchun, Liu Qiang. High-contrast imaging based on wavefront shaping to improve low signal-to-noise ratio photoacoustic signals using superpixel method. Chinese Physics B, 2020, 29(3): 034301 
Permissions
High-contrast imaging based on wavefront shaping to improve low signal-to-noise ratio photoacoustic signals using superpixel method
† Corresponding author. E-mail:
Project supported by the National Key Research and Development Program of China (Grant No. 2017YFB1104500), the Beijing Natural Science Foundation, China (Grant No. 7182091), the National Natural Science Foundation of China (Grant No. 21627813), and the Research Projects on Biomedical Transformation of China-Japan Friendship Hospital (Grant No. PYBZ1801).
Abstract
Photoacoustic (PA) imaging has drawn tremendous research interest for various applications in biomedicine and experienced exponential growth over the past decade. Since the scattering effect of biological tissue on ultrasound is two- to three-orders magnitude weaker than that of light, photoacoustic imaging can effectively improve the imaging depth. However, as the depth of imaging further increases, the incident light is seriously affected by scattering that the generated photoacoustic signal is very weak and the signal-to-noise ratio (SNR) is quite low. Low SNR signals can reduce imaging quality and even cause imaging failure. In this paper, we proposed a new wavefront shaping and imaging method of low SNR photoacoustic signal using digital micromirror device (DMD) based superpixel method. We combined the superpixel method with DMD to modulate the phase and amplitude of the incident light, and the genetic algorithm (GA) was used as the wavefront shaping algorithm. The enhancement of the photoacoustic signal reached 10.46. Then we performed scanning imaging by moving the absorber with the translation stage. A clear image with contrast of 8.57 was obtained while imaging with original photoacoustic signals could not be achieved. The proposed method opens new perspectives for imaging with weak photoacoustic signals.
1. Introduction
Noninvasive biomedical imaging plays an important role in modern medicine. Imaging of blood vessel, brain tissue, and other biological tissues is of great help to disease diagnosis, disease treatment, and drug delivery.[1–3] When light propagates in biological tissues, it undergoes multiple scattering and rapidly becomes diffused light.[4] Usually, random speckles are formed due to multiple scattering when light passes through the scattering media. Traditional optical imaging methods such as confocal microscopy,[5] optical coherence tomography (OCT),[6] and two- or three-photon microscopy[7] utilize ballistic photons to image and often have high resolution. But influenced by scattering, the imaging depth of these methods is limited, usually less than one transport mean free path.[8] Thus, they can only be applied to superficial biological tissues.
The scattering effect of biological tissues on ultrasound is two- to three-orders magnitude weaker than that of light.[9] Based on photoacoustic effect, photoacoustic imaging[10,11] combines the advantages of light absorption contrast and ultrasound transmission. Photoacoustic effect refers to the phenomenon that the absorber absorbs the energy of the incident laser and excites ultrasound signal. When the laser irradiates the absorber, the absorber absorbs the light energy of the incident light and converts it into heat, causing local temperature rise and thermal expansion. As a result, a raised pressure is generated in the area of the absorption body irradiated by the light. If the laser pulse width is shorter than the stress relaxation time and the thermal relaxation time, heat and pressure will not diffuse to the surrounding area apparently within the duration of the laser pulse. With thermal diffusion, the absorber produces thermal-elastic deformation and transmits pressure outward which forms ultrasound. The generated ultrasound signal is the photoacoustic signal. The amplitude of the photoacoustic signal is determined by the laser fluence F and the absorption coefficient μa of the absorber

Although ultrasound can travel farther than light in the scattering media, the incident laser beam is still seriously affected by scattering. As the imaging depth increases, the influence of scattering on the incident light is aggravated and the generated photoacoustic signal weakens or even disappears. To enhance the amplitude of the photoacoustic signal, it is necessary to reduce the effect of scattering on the incident light and focus light as much as possible to the target point.
Wavefront shaping methods[12] have been developed to focus light through scattering media noninvasively. The basic principle is to modulate the wavefront phase and amplitude of the incident wave through an optical modulator to compensate for the light distortion caused by scattering. Wavefront shaping methods including transmission matrix method,[13–15] iterative optimization method,[16] optical phase conjugation (OPC),[17,18] and time-reversed ultrasonically encoded (TRUE) optical focusing technique[19] have made remarkable progress, especially in resolution and imaging speed. The light intensity of the target point is detected as the feedback signal for iterative optimization wavefront shaping. Focusing light through the scattering media by wavefront shaping has drawn much attention since the light detector cannot detect the light intensity of the target point which is inside the scattering media noninvasively. Although the TRUE method can detect the ultrasonically encoded light coming from the focal point using a light detector placed outside the scattering media, this method is hindered by complex experimental optical setup and cumbersome experimental procedures.[19]
The amplitude of the photoacoustic signal is proportional to the light fluence of the target area that the photoacoustic signal can be used as the feedback signal for wavefront shaping of the incident light.[20] Combining photoacoustic imaging and wavefront shaping further reduces the influence of scattering on the incident light and the photoacoustic signals collected for image reconstruction are significantly enhanced. In 2011, Kong et al. first proposed the idea of photoacoustic guided wavefront shaping.[21] They modulated the wavefront of the incident light with a deformable mirror (DM) to maximize the photoacoustic signal and achieved light focusing. In 2013, Chaigne et al. noninvasively measured the photoacoustic transmission matrix of the scattering media with the phase-only spatial light modulator (SLM) exploiting the photoacoustic effect.[22] Light focusing through the scattering media could be achieved utilizing the measured photoacoustic transmission matrix and the enhancement of the photoacoustic signal reached about 6. In 2013, Caravaca-Aguirre et al. combined the SLM with the genetic algorithm to iteratively optimize the wavefront of the incident light with the photoacoustic feedback, and the enhancement reached 10.[23] The SLM is commonly used in photoacoustic wavefront shaping researches to modulate the wavefront of the incident light.[24–26] The low refresh rate of the SLM, about 100 Hz, restricts its application in vivo imaging since the speckle decorrelation time[27] of biological tissue is short. Much faster refresh rate can be achieved with digital micromirror device (DMD), up to 32 kHz.[28] However, the DMD surface can only endure pulse laser fluence no more than 200 μJ/cm2 while the SLM surface can endure 40 mJ/cm2. Lower pulsed laser fluence leads to weaker photoacoustic signal and lower SNR. In 2014, Wang et al. first used DMD for photoacoustic wavefront shaping.[29] They raised the SNR to 3.9 by averaging 64 acquisitions of photoacoustic signals that the optimization process took about 2 hours with 1-kHz laser pulse repetition rate. The data averaging method is time consuming and can only slightly improve the SNR. In 2016, Tzang et al. proposed a lock-in detection method for photoacoustic signals and improved the SNR by at least one order of magnitude.[30] With 20-kHz laser pulse repetition rate, the linear photoacoustic wavefront shaping process took 6 minutes and the nonlinear photoacoustic wavefront shaping process took about 1 hour. The enhancement of the photoacoustic signals reached 9 and 16, respectively. However, this method requires complicated circuits for analog signal processing and expensive light modulation devices. In 2019, Sun et al. combined wavelet denoising with correlation detection and improved the SNR of the photoacoustic signals by 6.5 times.[31] They used DMD for photoacoustic wavefront shaping and the enhancement of the photoacoustic signal reached 7.83. The optimization process was completed in 30 minutes with only 10-Hz laser pulse repetition rate.
The effect of phase and amplitude co-modulation is much better than pure amplitude modulation.[32] As a binary amplitude modulation digital micromirror device, DMD cannot modulate the phase of the incident light directly. The superpixel method[33] has been developed to achieve amplitude and phase co-modulation with DMD. In 2018, Jia et al. first achieved light focusing through the scattering media with DMD-based superpixel method.[34] So far, the DMD-based superpixel method has never been used in photoacoustic.
In this paper, we applied the DMD-based superpixel method to photoacoustic wavefront shaping and imaging research of low SNR photoacoustic signals for the first time. We extracted the photoacoustic signals submerged in noise with wavelet denoising and correlation detection method. Then we combined the superpixel method with DMD to modulate the phase and amplitude of the incident light and used the genetic algorithm for iterative optimization of the wavefront. Enhancement of the photoacoustic signal reached 10.46. Scanning imaging was performed by moving the sample on a two-dimensional translation stage. After optimization, a clear image with contrast of 8.57 was obtained while imaging with original photoacoustic signals directly could not be achieved.
2. Experiment setup
The experiment setup is shown in Fig.
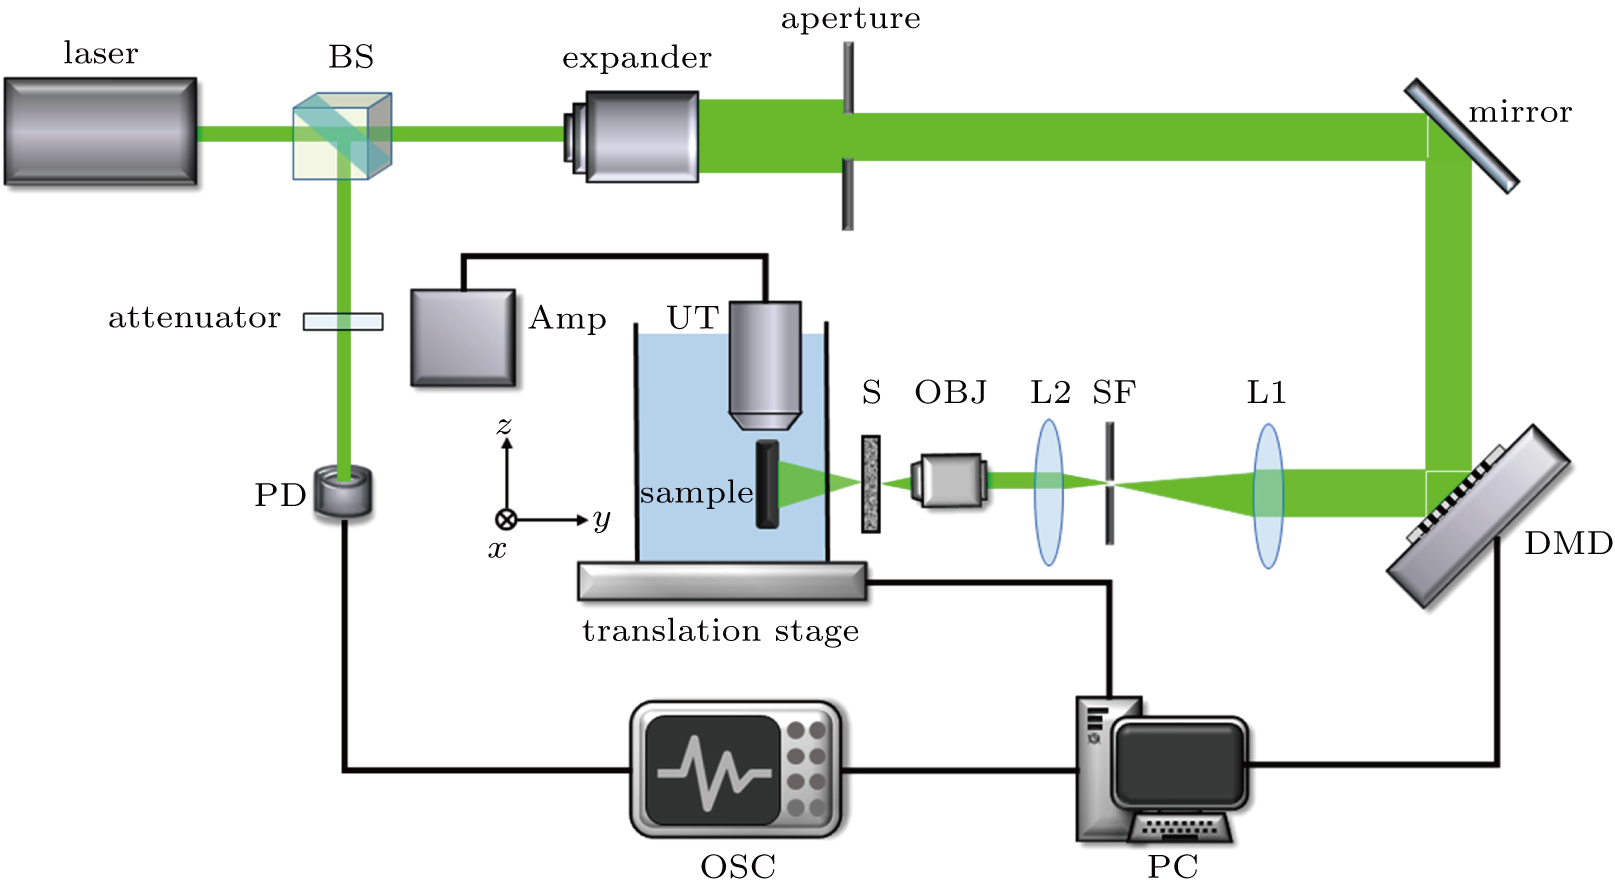 | Fig. 1. Schematic diagram of the experimental setup. BS: beam splitter; PD: photodiode; DMD: digital micromirror device; L1, L2: lens; SF: spatial filter; OBJ: objective; S: scattering diffuser; UT: ultrasonic transducer; Amp: amplifier; OSC: oscilloscope. |
3. Experimental results and discussion
2(a) . Wavelet analysis can effectively reduce white noise, but the signal is also disturbed by clutters. We selected the signal with better waveform which was not affected by clutters as the template and calculated the correlation coefficients between the collected signals and the template signal after wavelet denoising to remove the signals in which the clutters and the photoacoustic signal overlapped in time domain. The normalized correlation coefficient is given by[39]


2(a) , the white noise has been effectively reduced and the useful signals were not disturbed by clutters. The SNR of the denoised signals reached 11.06, which was 5.17 times higher than that before denoising. We effectively improved the SNR of the photoacoustic signals with wavelet denoising and correlation detection method while Wang et al. averaged 64 acquisitions of the photoacoustic signals but only raised the SNR to 3.9.[29] Sun et al. raised the SNR of the photoacoustic signals from 3.86 to 25.2.[31] In our experiment, the raw photoacoustic signals were weak and had low SNR which restricted the SNR of the processed signals.3(a) . In the experiment, we carried out 80 iterations. Further increase the number of iterations, the enhancement of the photoacoustic signal was not significant while the optimization time became longer. Figure 3(b) shows in detail the first generation, the 20th generation, the 40th generation, the 60th generation photoacoustic signals and the optimal photoacoustic signal.
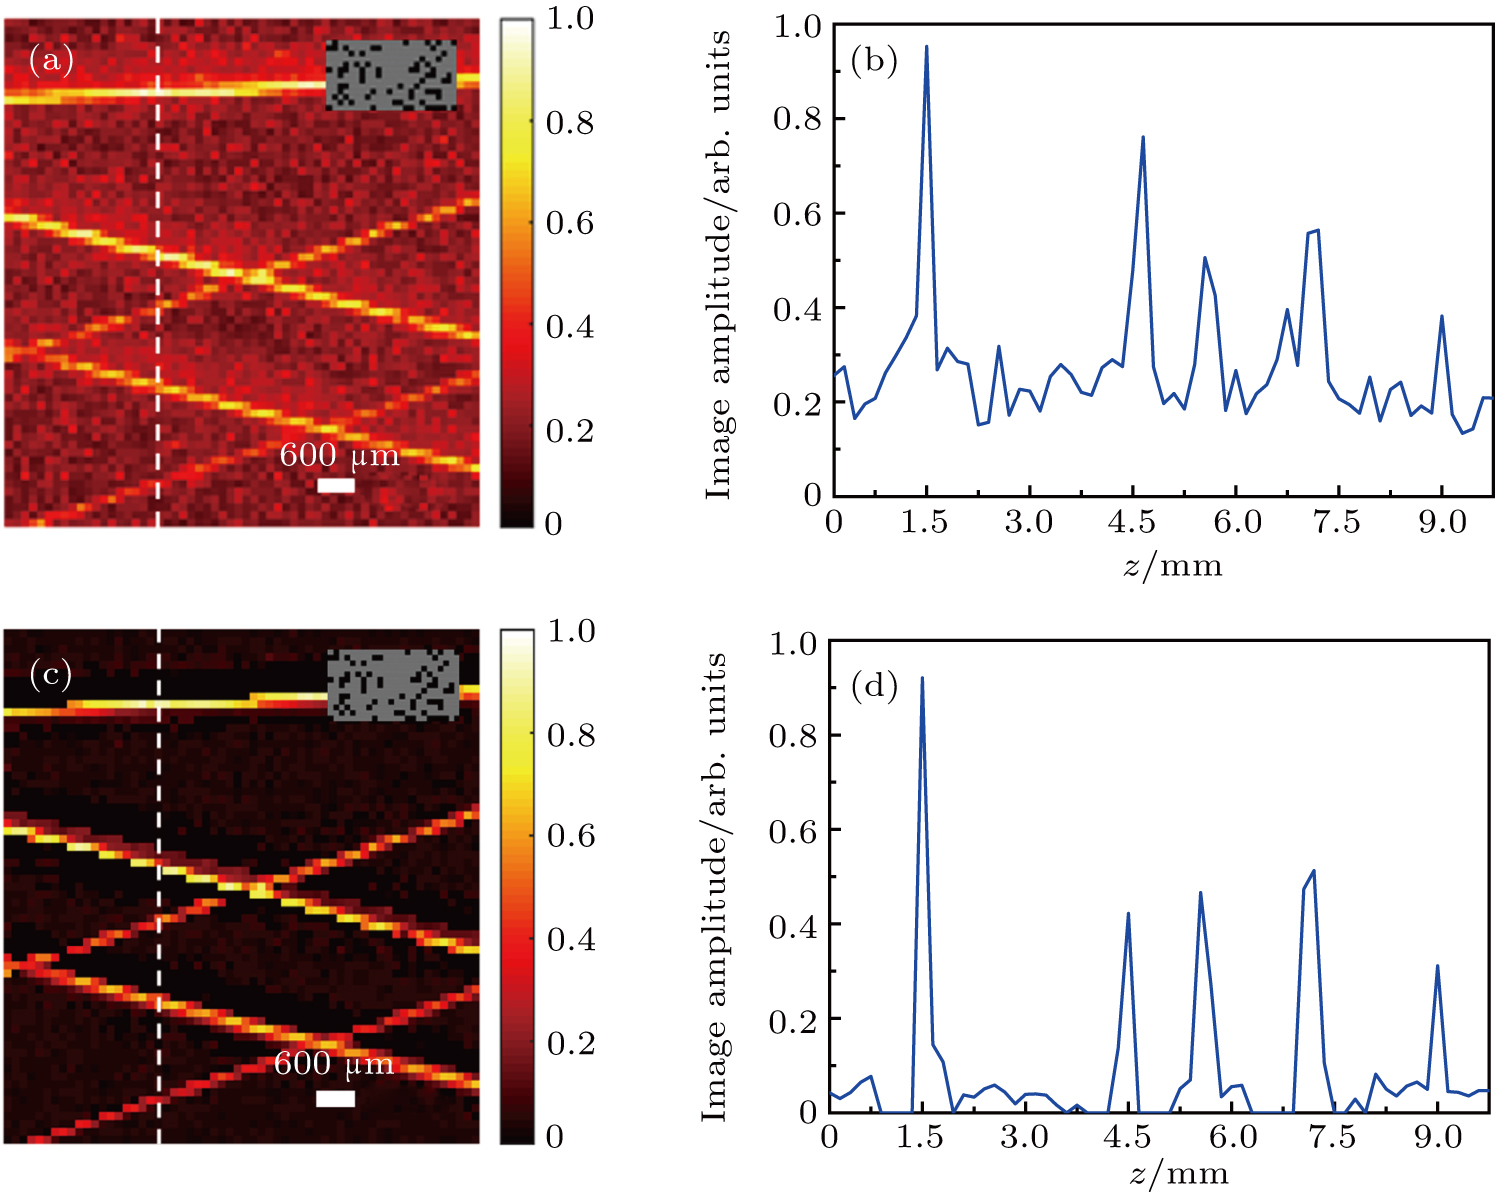
5(b) shows the image amplitude distribution along the twentieth column in Fig. 5(a) marked with the white line. The five peaks in Fig. 5(b) correspond to the five absorption nylon wires in Fig. 5(a) . The half-width at those peaks are all no more than 3 points, corresponding to a resolution of at least 450 μm.
Figure
 | Fig. 2. (a) The random signal before and after denoising. The blue curve represents the raw signal without denoising. The red curve represents the signal after denoising. (b) Scanning image reconstructed with the raw signals. (c) Scanning image reconstructed with the denoised signals. The insets represented the random superpixel mask. |
Scanning imaging was performed by moving the absorption sample in x–z plane on the two-dimensional translation stage. We scanned 60 points along the x direction and 65 points along the z direction with a scanning step of 150 μm. At each point, 10 signals were collected for data averaging. The maximum amplitude projection image of the crossed nylon wires could be reconstructed by calculating the photoacoustic signal amplitude of each point. As shown in Fig.
In order to improve the SNR of the PA signals, we utilized wavelet analysis for signal denoising and correlation detection to remove the invalid signals in which the clutters and the photoacoustic signal overlapped.[31] Wavelet analysis[36,37] is an ideal tool for signal time –frequency analysis and processing. We selected the fourth-order daubechies wavelet as the mother wavelet that was similar to the waveform of the PA signal to perform 8-layer wavelet decomposition on the photoacoustic signals. Considering effectiveness and simplicity, the sqrtwolog threshold was chosen and the calculation formula is[38]


As shown in Fig.
In order to improve the photoacoustic signal amplitude effectively and obtain high quality photoacoustic image, we used DMD based superpixel method for wavefront shaping of the incident light. In wavefront shaping experiment, the enhancement[32] defined as the ratio of the intensity of the focus after and before optimization is often used to evaluate the effect of optimization. The theoretical enhancement of iterative optimization wavefront shaping can be expressed as

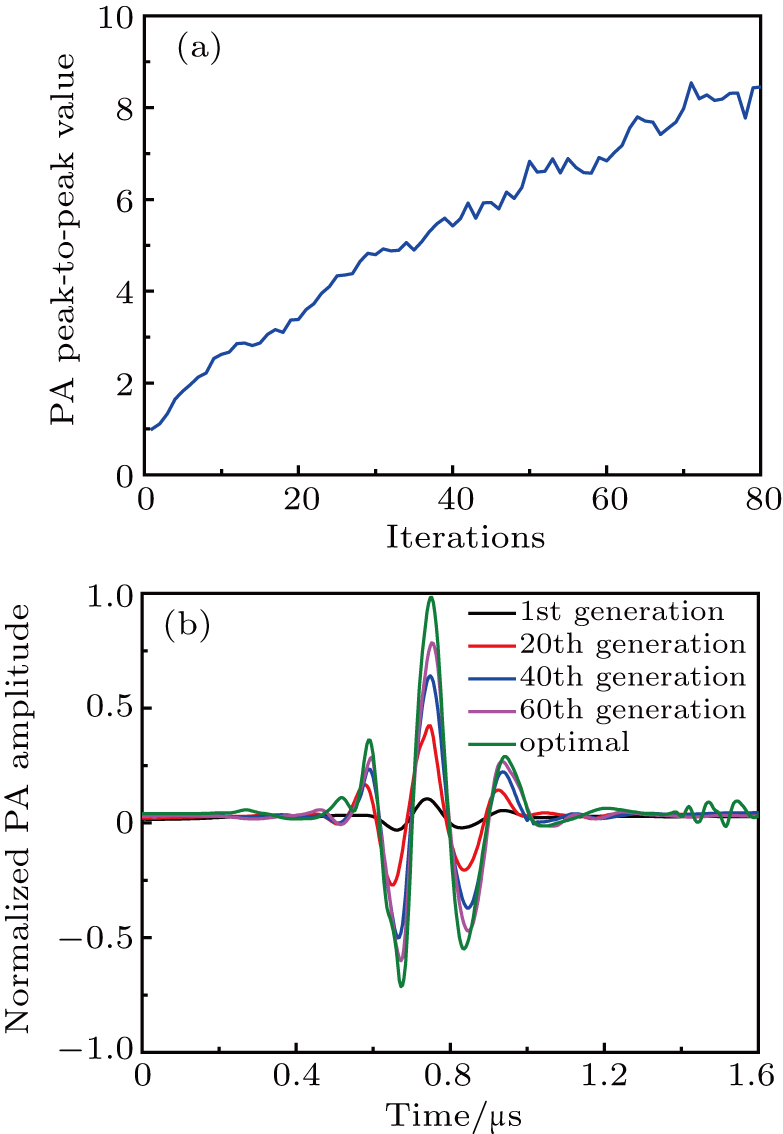 | Fig. 3. (a) Evolution curve of the averaged photoacoustic signal amplitude. (b) Photoacoustic signals collected during the wavefront shaping optimization. The black, red, blue, purple, and green curves represent photoacoustic signals of different generations in the optimization process respectively. |
After optimization, the scattered light was effectively focused at the target point on the sample and the photoacoustic signal was greatly enhanced with the optimal mask loaded on the DMD as shown in Fig.

 | Fig. 4. Comparison of three photoacoustic signals. The black, red, and blue curves represent the photoacoustic signals generated when the random mask, the full white mask, and the optimal mask loaded on the DMD, respectively. |
After optimization, the optimal mask was loaded on the DMD and remained unchanged. We moved the sample with the two-dimensional translation stage and collected the photoacoustic signals to reconstruct the image. Firstly, we used the collected photoacoustic signals to reconstruct the image directly without any processing on the signals. Figure

 | Fig. 5. (a) Scanning image with the unprocessed signals. (b) The image amplitude distribution along the white line in (a). (c) Scanning image with the denoised signals. (d) The image amplitude distribution along the white line in (c). The insets represent the optimal superpixel mask. |
Then we processed the collected photoacoustic signals to remove the noise mixed in the signals. Figure
4. Conclusion
Photoacoustic imaging is challenged by weak photoacoustic signal and low signal-to-noise ratio. We proposed a new wavefront shaping and imaging method of low SNR photoacoustic signal based on DMD and superpixel method.
When the incident light was seriously affected by scattering, weak photoacoustic signals were excited and they were submerged in white noise and clutters. We performed wavelet analysis and correlation detection on the raw photoacoustic signals and raised their SNR from 2.14 to 11.06. We modulated the wavefront phase and amplitude of the incident light with DMD based superpixel method and the enhancement of the photoacoustic signal reached 10.46. The theoretical enhancement of pure amplitude modulation is only 6.68. Our experiment demonstrated that phase and amplitude co-modulation with DMD based superpixel method could achieve much better effect than pure amplitude modulation even when the SNR of photoacoustic signal was low. The enhancement can be further improved by raising the SNR of the original photoacoustic signals, applying more fine-grained phase control and utilizing the ultrasonic transducer with higher central frequency and tighter detection focal region.
After optimization, we kept the optimal mask loaded on the DMD and moved the absorption sample in the x–z plane by the two-dimensional translation stage to scan and image. A clear image with contrast of 8.57 and resolution of 300 μ m was obtained while imaging with original photoacoustic signals directly could not be achieved. The nylon wires could be clearly distinguished in the photoacoustic image. The imaging resolution was mainly limited by the ultrasonic transducer and better resolution can be achieved using ultrasonic transducer with higher central frequency.
Different from the time-consuming signal averaging method, the wavelet denoising and correlation detection of signals only took less than 50 ms. The optimization process took about 20 minutes and was mainly limited by the laser repetition rate of 10 Hz. At present, the refresh frequency of DMD can be as high as 32 kHz. With higher repetition rate pulse laser and faster calculating devices such as FPGA,[42] optimization can be accomplished in several seconds.
We experimentally demonstrated the superior performance of the DMD based superpixel method in photoacoustic wavefront shaping and imaging research of low SNR photoacoustic signals. Our research opens new perspectives for photoacoustic wavefront shaping and imaging with weak photoacoustic signals. The proposed method presents huge development potential and would promote the development of photoacoustic wavefront shaping technology and the practical application of photoacoustic wavefront shaping in biological imaging.
Reference
| [1] | |
| [2] | |
| [3] | |
| [4] | |
| [5] | |
| [6] | |
| [7] | |
| [8] | |
| [9] | |
| [10] | |
| [11] | |
| [12] | |
| [13] | |
| [14] | |
| [15] | |
| [16] | |
| [17] | |
| [18] | |
| [19] | |
| [20] | |
| [21] | |
| [22] | |
| [23] | |
| [24] | |
| [25] | |
| [26] | |
| [27] | |
| [28] | |
| [29] | |
| [30] | |
| [31] | |
| [32] | |
| [33] | |
| [34] | |
| [35] | |
| [36] | |
| [37] | |
| [38] | |
| [39] | |
| [40] | |
| [41] | |
| [42] |