
Photoluminescence in fluorescent 4H-SiC single crystal adjusted by B, Al, and N ternary dopants
Cite this Article
Zhuo Shi-Yi, Liu Xue-Chao, Huang Wei, Kong Hai-Kuan, Xin Jun, Shi Er-Wei. Photoluminescence in fluorescent 4H-SiC single crystal adjusted by B, Al, and N ternary dopants. Chinese Physics B, 2019, 28(1): 017101 
Permissions
Photoluminescence in fluorescent 4H-SiC single crystal adjusted by B, Al, and N ternary dopants
† Corresponding author. E-mail:
Project supported by the National Key Research and Development Program of China (Grant Nos. 2017YFB0405700 and 2016YFB0400400), the Young Scientists Fund of the National Natural Science Foundation of China (Grant Nos. 51602331 and 61404146), and the Shanghai Science and Technology Innovation Action Plan Program, China (Grant No. 17511106200).
Abstract
This paper reports the sensitive effect of photoluminescence peak intensity and transmittance affected by B, Al, and N dopants in fluorescent 4H-SiC single crystals. The crystalline type, doping concentration, photoluminescence spectra, and transmission spectra were characterized at room temperature. It is found that the doped 4H-SiC single crystal emits a warm white light covering a wide range from 460 nm to 720 nm, and the transmittance increases from ∼ 10% to ∼ 60% with the fluctuation of B, Al, and N ternary dopants. With a parameter of CD−A, defined by B, Al, and N concentration, the photoluminescence and transmittance properties can be adjusted by optimal doping regulation.
1. Introduction
In recent years, fluorescent silicon carbide (f-SiC) has attracted intense interest for it can be used as a wavelength converter and was expected to substitute the phosphor layers in white light-emitting diodes.[1–3] Previous researchers reported that f-SiC had excellent properties compared to that of red–green–blue three colors phosphor, such as higher thermal conductivity, more easily controlled dopant, higher luminescence efficiency, and smaller lattice mismatch for nitride epitaxy.[4] In Refs. [5] and [6], researchers suggested a promising conceptual structure which combined with a gallium nitride layer, a nitrogen and boron (N and B) codoped SiC layer, and a N and aluminum (Al) codoped SiC layer to assemble into a new white light-emitting diode. In this structure, the N and B codoped SiC emits orange–yellow light while the N and Al codoped SiC emits green–blue light when they are excited by the gallium nitride ultraviolet light source. A warm white light emission with a color rendering index of 94[7] can be obtained. For these reasons, the f-SiC is regarded as a promising fluorescent material.
As far as we know, the photoluminescence properties of Al, Ga, or B acceptor and N donor doped SiC layer have been studied by Ikeda et al.[8] in 1979. However, this pioneer f-SiC compound displayed an extremely inefficient luminescence property. For its indirect band gap property, a chief worry in the study of f-SiC is that the quantum efficiency may be very small, estimated to be about 10−5%, which will obstruct its application in LED devices. A breakthrough work was reported by Kamiyama et al.[9] based on donor-to-acceptor pairs (DAPs) recombination mechanism in 2006. In their work, the authors observed a high-efficiency visible light emission (estimated to be about ∼95% at 250 K) in B and N codoped 6H-SiC epilayers. This result greatly encouraged the research activities on f-SiC material. After that, Jokubavicius et al.[10] studied the effects of source material on epitaxial growth of N and B codoped SiC layers grown by using a fast sublimation growth process method. They demonstrated that high quality N and B codoped SiC layers are suitable to be used as light converter and emission warm white light with a peak located at about 580 nm. Manolis et al.[11] studied the non-radiative decay of majority electrons under a wide temperature range using a time-resolved free-carrier absorption technique. They found that the recombination channel seems to compete with the deep acceptor to donor pair on visible light emission at and below 300 K in N and B codoped 6H-SiC. Besides B and N co-doping, another kind of donor–acceptor co-doping pair, like Al and N codoped SiC, was also been explored. Canassel et al.[12] prepared N and Al codoped 4H-SiC single crystals by using their home-made physical vapor transport reactor. An exciting photoluminescence spectra different to that of a seed with a broad peak located at around 520 nm was found in their work.
Although photoluminescence properties of f-SiC regulated by Al–N or B–N binary dopants codoping have been widely studied, few research work has focused on the photoluminescence of f-SiC with ternary dopants of B–Al–N. Besides, the influence of dopants on the photoluminescence and transmittance properties is still not clear,[13] especially for the multi-elements codoped SiC. Furthermore, SiC single crystal is an indirect band gap semiconductor, and has more than 200 crystalline structures, such as 3C-SiC, 4H-SiC, 6H-SiC, and 15R-SiC. For example, the band gaps of 3C-SiC, 4H-SiC, 6H-SiC, and 15R-SiC are 2.41 eV, 3.29 eV, 3.05 eV, and 3.01 eV, respectively. This makes the electron–hole pair recombination quite complicated when introducing deep or shallow donor–acceptor impurity energy levels in the band gap.[14] Therefore, it is necessary to study the factors which affect the luminescence properties of f-SiC before this material is widely used in future.
In this paper, high quality B, Al, and N codoped 4H-SiC single crystals were grown by using the physical vapour transport (PVT) method. The Raman spectroscopy, photoluminescence properties, doping concentrations, and transmission spectra were measured. The relationship between doping concentrations and optical properties of the doped SiC crystal was studied. The purpose is to explore a suitable approach to adjust the luminescence and transmittance of f-SiC by B, Al, and N ternary elements co-doping.
2. Experiment
B, Al, and N ternary elements codoped 4H-SiC single crystals were grown by the PVT method. Detailed preparation processes have been described in a previous report.[15] In this article, the B dopant was introduced and controlled by adjusting the precise weight ratio of boron carbide and SiC powders. The Al dopant was introduced and controlled by adjusting the precise weight ratio of aluminum and SiC powders. The N dopant was introduced and controlled by adjusting the mass flow ratio of N2 and Ar in the growth atmosphere. For convenience, the samples herein with different proportions of B, Al, and N dopants were labeled as SiC-I, SiC-II, SiC-III, and SiC-IV in the following parts.
The crystalline type of SiC-I to SiC-IV was characterized by Raman spectroscopy excited by a 514 nm laser. The photoluminescence images/spectra of as-grown samples were characterized by using fluorescence spectrometer (Edinburgh FLS980, Edinburgh Instruments Ltd.) excited by a 325 nm laser source at room temperature. In particular, the photoluminescence image of sample SiC-IV, as a representative image, was collected by using 325 nm exciting laser source with a power of 5 mJ. When the sample SiC-IV was exposed to a violet light with a spot diameter of 10 mm, the fluorescence image was captured by a digital camera (G15, Canon digital camera) from opposite direction of the laser. The doping concentrations of B, Al, and N in 4H-SiC crystals were detected by secondary ion mass spectra (SIMS, EAG Laboratories) system. The transmission spectra (Carry 5000 UV-Vis-Nir spectroscopy, Agilent Technologies Inc.) were measured in a wavelength range from 200 nm to 800 nm at room temperature.
3. Results and discussion
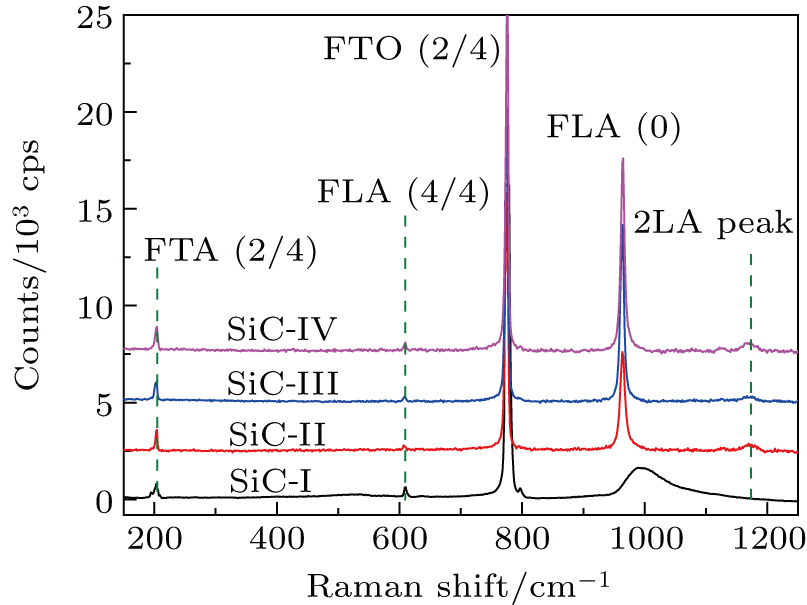
SiC has more than 200 crystalline structures, and each of them has different physical properties, such as lattice constant, band gap, and sublimation temperature. For this reason, it is important to clarify the crystalline type of acquired SiC crystals before studying their photoluminescence properties. Raman spectroscopy is a molecular vibrational spectroscopic technique that can easily identify the crystalline type of SiC. Figure
 | Fig. 1. Raman spectra of samples SiC-I, SiC-II, SiC-III, and SiC-IV excited by a 514 nm laser at room temperature. |
Photoluminescence spectra of B, Al, and N codoped 4H-SiC single crystals were measured at room temperature under a 325 nm exciting laser, as shown in Fig.
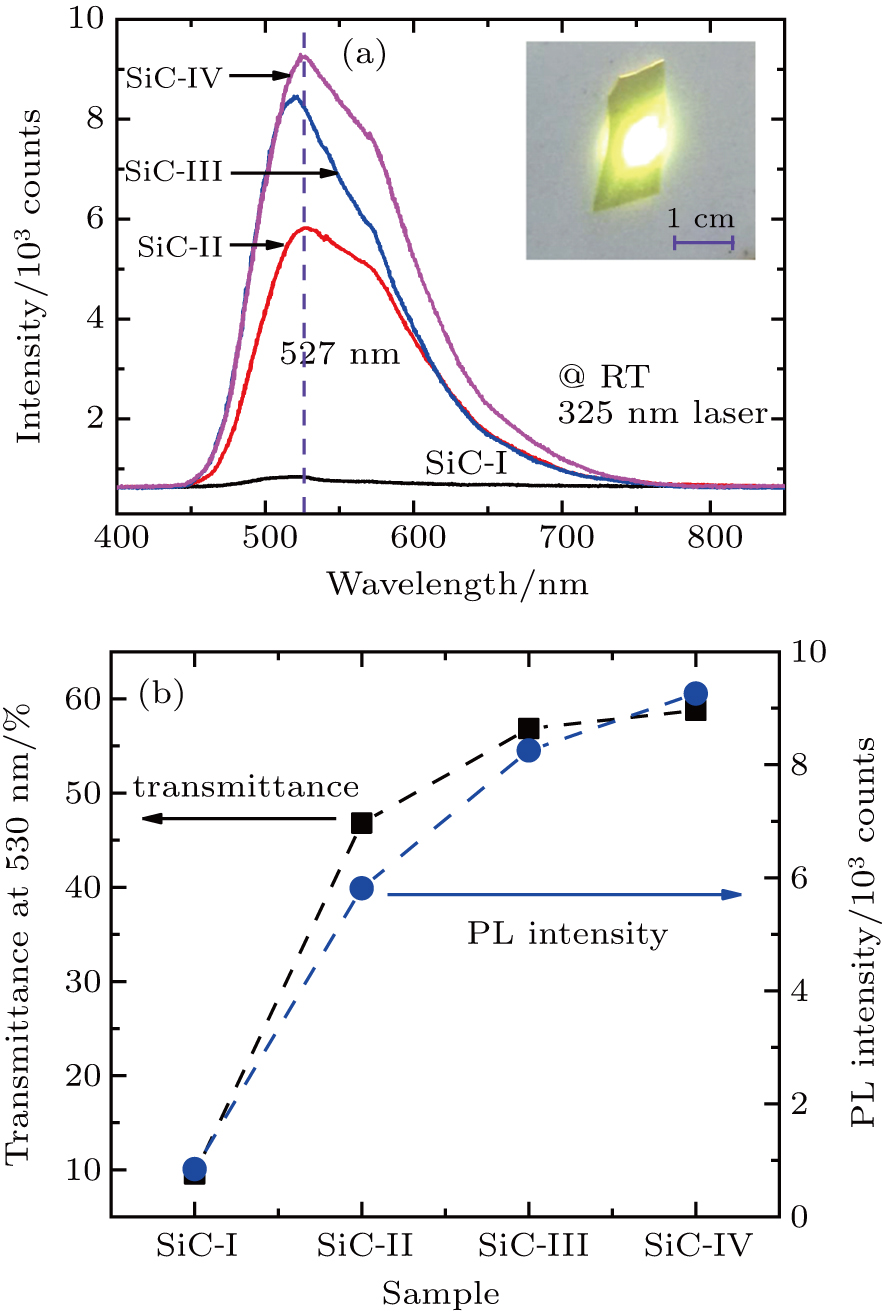 | Fig. 2. Photoluminescence spectra and the peak intensity for samples SiC-I, SiC-II, SiC-III, and SiC-IV. (a) Photoluminescence spectra of sample SiC-I to sample SiC-IV excited by a 325 nm laser at room temperature. The inset on the upper right corner is the luminescence of sample SiC-III acquired by digital camera. (b) Peak intensity and FWHM as a function of sample SiC-I to sample SiC-IV. The peak intensity was extracted from the photoluminescence spectra at about 527 nm. |
Figure
It has been pointed out that the dopants and their concentration play a key role in the luminescence properties of f-SiC. Until now, a well-known explanation for the luminescence in f-SiC is a donor–acceptor recombination mechanism. In this mechanism, electrons are excited by external ultraviolet light from valence band to conduction band for doped SiC. Thereafter, some of the free electrons and holes occupy the donor states and acceptor states, respectively. These electrons from donor states recombine with the holes from the acceptor states, and release their partial energy as light (other partial energy as phonon for the indirect band gap property of 4H-SiC) in the visible region as seen in the photoluminescence measurement in Fig.
In order to further analyze the relationship between dopants and the photoluminescence property, the B, Al, and N doping concentration (defined as CB, CAl, and CN, respectively) was measured by SIMS under a high precision analysis protocol. The result is listed in Table
| Table 1. SIMS measurement results of B, Al, and N concentrations in samples SiC-I, SiC-II, SiC-III, and SiC-IV. In the measurement, the precision is better than ±3%. The B, Al, and N concentrations are defined as CB, CAl, and CN, respectively. The parameter CD−A is calculated by a function of CB − (CAl − CN) and listed in the last column. . |
In Ref. [19], Syväjärvi et al. calculated the concentration difference between N and B dopants, defined as CN − CB, in their N and B codoped 6H-SiC epilayer. When the integrated photoluminescence peak intensities were normalized to the strongest sample, they found a relationship between CN − CB and the photoluminescence spectra measured at room temperature. The strongest emission was observed in an n-type sample with the largest concentration difference of CN − CB = 4.6 × 1018 cm−3. Ou et al.[20] also found that N and B concentrations larger than 1018 cm−3 was required to achieve intense DAPs emission. The concentration difference should be larger than 4.6 × 1018 cm−3 in the N and B codoped f-SiC. However, the concentration difference between donor and acceptor cannot describe the changes in photoluminescence properties thoroughly in the B, Al, and N ternary elements doping f-SiC. In our previous report,[21] a new parameter of CD−A, defined by a function of ln CB – (ln CAl − ln CN), was used to describe the strong correlation between B–Al–N doping concentration fluctuation and photoluminescence properties of 4H-SiC. The parameter CD−A was also calculated and shown in this work, and the result is listed in the last column of the Table
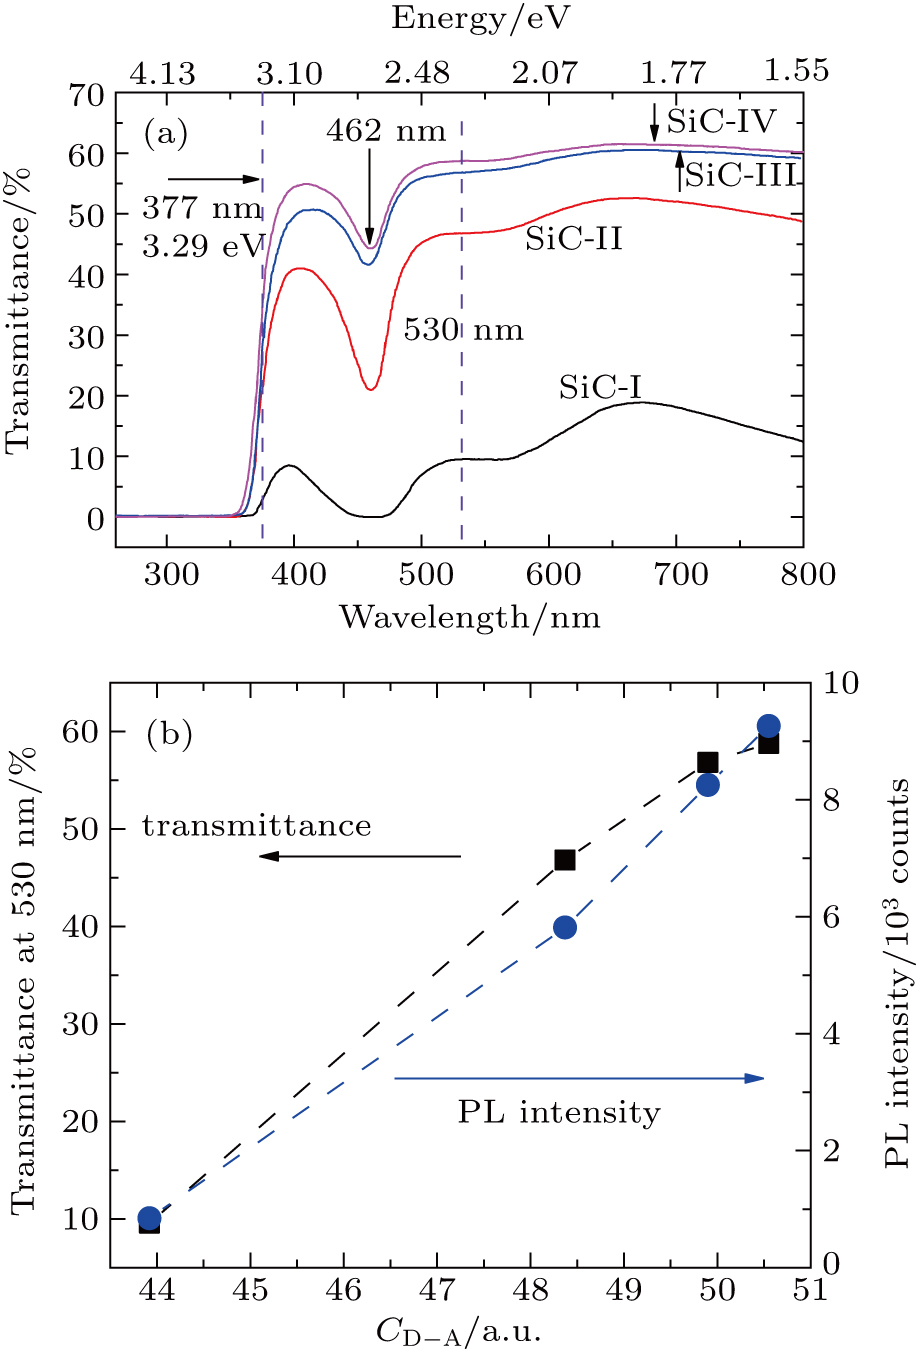
Besides photoluminescence, transmittance is another optical property that will be affected by B, Al, and N doping in 4H-SiC single crystals. As shown in Fig.
 | Fig. 3. (a) Transmission spectra of samples SiC-I, SiC-II, SiC-III, and SiC-IV. (b) The transmittance at 530 nm and the photoluminescence peak intensity as function of parameter CD−A. The parameter CD−A is calculated by a function of CB − (CAl − CN) and acquired from Table |
Due to the similar trend in photoluminescence intensity, parameter CD−A, and transmittance spectra for sample SiC-I to sample SiC-IV, the phenomenon prompts us to consider the association between these three parameters. Following this approach, the functions between CD−A and photoluminescence peak intensity (or transmittance) are constructed and shown in Fig.
In Ref. [25], Sun et al. explained the influence of N and B dopants concentration difference on photoluminescence peak intensity in doped 6H-SiC epilayers. They found that the photoluminescence intensity was enhanced with the increase in the difference (CN − CB), and would gradually saturate when CN − CB > 2CB. In this paper, with the introduction of ternary-element doping, the photoluminescence emission spectra are enhanced. As shown in Fig.
4. Conclusion
In this paper, the photoluminescence and transmittance properties of B, Al, and N codoped fluorescent 4H-SiC single crystal prepared by the PVT method were studied. The crystalline type of the obtained crystals was characterized by Raman spectroscopy first. Then the doping concentration, photoluminescence spectra, and transmission spectra were measured at room temperature. It was implied that with the fluctuation in B, Al, and N triple dopants the doped 4H-SiC emitted a warm white light covering a wide range from 460 nm to 720 nm when excited by a 325 nm laser, while the transmittance increased from ∼10% to ∼ 60%. It was experimentally proved that the photoluminescence and transmittance properties could be adjusted by carefully regulating the B, Al, and N doping.
Reference
| [1] | |
| [2] | |
| [3] | |
| [4] | |
| [5] | |
| [6] | |
| [7] | |
| [8] | |
| [9] | |
| [10] | |
| [11] | |
| [12] | |
| [13] | |
| [14] | |
| [15] | |
| [16] | |
| [17] | |
| [18] | |
| [19] | |
| [20] | |
| [21] | |
| [22] | |
| [23] | |
| [24] | |
| [25] |