Project supported by the National Natural Science Foundation of China (Grant No. 11874191) and the Natural Science Foundation of Shandong Province, China (Grant No. ZR2016FM38).
Project supported by the National Natural Science Foundation of China (Grant No. 11874191) and the Natural Science Foundation of Shandong Province, China (Grant No. ZR2016FM38).
† Corresponding author. E-mail:
Project supported by the National Natural Science Foundation of China (Grant No. 11874191) and the Natural Science Foundation of Shandong Province, China (Grant No. ZR2016FM38).
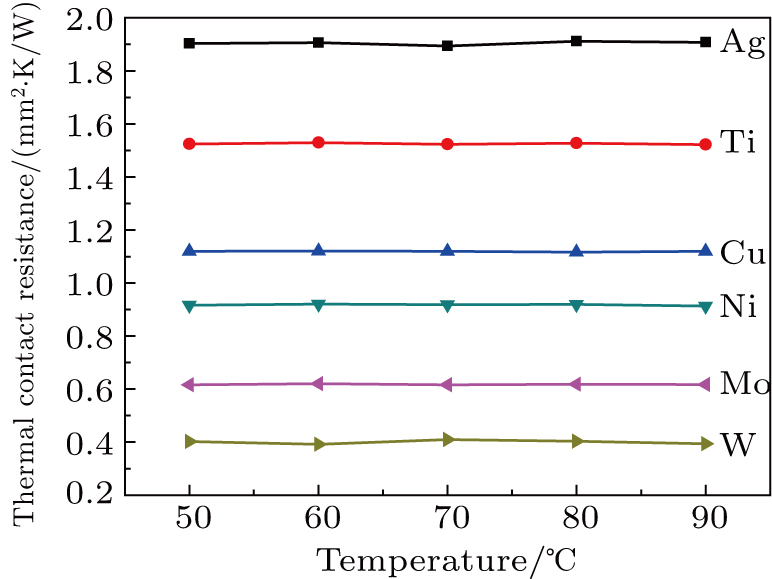
Liquid metal alloys (LMAs) are the potential candidates of thermal interface materials (TIMs) for electronics cooling. In the present work, buffer layers of Ag, Ti, Cu, Ni, Mo, and W were deposited on polished Cu plates by DC magnetron sputtering, the contact angles of de-ionized water and diiodomethane on the buffer layers were measured by an easy drop shape analyzer and the surface free energies (SFEs) of the buffer layers were calculated by the Owens–Wendt–Kaelble equation. Samples were prepared by sandwiching the filmed Cu plates and LMAs. The thermal properties of the samples were measured by laser flash analysis method. The SFE of the buffer layer has a strong influence on the interface heat transfer, whereas the measurement temperature has no obvious effect on the thermal properties of the samples. As the SFE of the buffer layer increases, the wettability, thermal diffusivity, and thermal conductivity are enhanced, and the thermal contact resistance is decreased.
In recent years, the continuous increase of extraordinary large amount of heat and especially the high heat flux generated in electronic chips made the thermal management a major serious concern throughout the world.[1,2] Therefore, it is critical to choose an efficient heat dissipation path to cool the electronic chip.[3] However, the cooling efficiency depends on the thermal contact quality of the interfaces. It is well known that when two solid surfaces are in contact, air pockets are created between the two solids at the interface due to asperities on each of the surfaces, low thermal conductivity air gaps result in thermal contact resistance (TCR). Thermal interface materials (TIMs) are needed to fill the air gaps to reduce the TCR between the interfaces.[4,5]
Commercial TIM is typically composed of a polymer matrix and conductive fillers. Metal oxide particles (MgO, Al2O3, etc.),[6] ceramics (SiC, BN, etc.),[7] and metals (Ag, Cu, Al, Ni, etc.)[8] have been widely adopted as fillers for conventional TIMs. Epoxy resin, rubber, and silicone are typical polymer matrices.[9] However, traditional TIMs exhibit low thermal conductivity even at high loading fractions. Carbon based TIMs have draw much attention in recent years. The axial thermal conductivity is 3000 W/mK for individual multiwalled carbon nanotubes (CNT).[10] However, the reported thermal conductivity of the CNT composites is rather unsatisfying.[11] Vertically aligned carbon nanotube (VACNT) films provide high conductivity in the axis and effectively transfer heat energy from a heat source to a heat sink, so VACNT films can be used as an attractive TIM in microelectronic packaging. Because of the poor bonding quality and high thermal resistance between VACNT tips and opposing surface, VACNTs are difficult to be used in high efficiency heat dissipation systems. As a two-dimensional material, the graphene has attracted a lot of attention due to its ultra high in-plane thermal conductivity in the range of 2000–5000 W/mK,[12] and is regarded as a promising filler to improve the thermal performance of the TIMs. However, the thermal conductivities of the graphene-based composites are still much lower than the expected value due to the interlayer thermal contact resistance.[13]
The liquid metal alloy (LMA) is a compound of gallium, indium, and tin, which is in liquid state below the operating temperature of the electronic component.[14,15] LMAs possess high thermal conductivity, and therefore are good candidates for the next generation TIMs.[16,17] However, the low wettability of LMAs on the heat sink may restrict its potential value in reducing cost and expanding use. In this study, the surface property of the Cu plate has been modified by coating films with different surface free energies (SFEs), and the heat transfer performance of LMAs on different SFE surfaces was investigated.
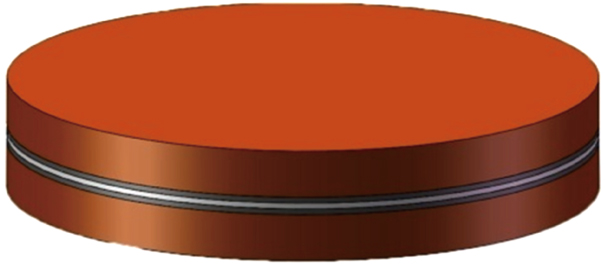
The polished oxygen-free Cu plates in 12.6 mm diameter were cleaned with acetone, ethanol, and hydrochloric acid solution (5% HCl & 95% water), and then rinsed in de-ionized water. Buffer layers of Ag, Ti, Ni, Cu, Mo, and W were deposited at room temperature on the Cu plates by DC magnetron sputtering. The sputtering chamber was first evacuated to a base pressure of 5 × 10⁻⁴ Pa, the sputtering was carried out under a pressure of 0.45 Pa in high purity argon flow of 20 sccm with a target-to-substrate distance of 65 mm. The sputtering power was fixed at 32 W, a continuous and homogeneous buffer layer with 60 nm thickness was formed on the Cu plate by controlling the sputtering time. LMA of Ga62.5In21.5Sn16, which was purchased from Indium Corporation with melting point of 10.7 °C, was used as TIM. It was scrubbed on the surface of the filmed plate using a small brush, then two plates were stacked up and pressed to form a sandwiched structure sample, as shown in Fig.
The nominal film thickness as well as the deposition rate were monitored with a quartz crystal thickness monitor. The film thicknesses were checked using a surface profilometer, and good agreement was obtained. The drop shape analyzer (KRUSS GmbH) was used for measuring the contact angles of de-ionized water and diiodomethane on the filmed Cu plates, in which the contact angles of droplets with volume of 4 μl were measured and calculated using the sessile drop method and Young–Laplace fitting after the steady state was reached.
The laser flash analyzer (LFA 457, NETZSCH) was used to investigate the thermal properties of the samples. The detailed specification of LFA 457 can be found elsewhere.[18] The thermal conductivity (k) of the sample was calculated from the specific heat capability Cp, thermal diffusivity α, and sample density ρ using the relation k = α ρ Cp. The thermal diffusivity of the sample was obtained by fitting the temperature risen curve. The sample density was calculated by measuring its volume and weight. The specific heat capacity could be obtained by a comparative method wherein two samples were measured at the same time: a sample prepared in this paper, and a reference sample with previously determined properties. The TCR could be obtained from the thermal conductivity and physical parameters of the samples.
De-ionized water and diiodomethane are selected as a probe for the SFE calculations because they have a well-known value of surface tension, polar component and dispersion component. Values presented in Table
| Table 1. Surface tension parameters of deionized water and diiodomethane. . |
For calculating SFE, the geometric mean approach was used to combine the dispersion and polar components by the method of Owens, Wendt, Rabel, and Kaelble. It is assumed that the total SFE of solid and liquid is merely a sum of both polar and dispersion components in this model.[20] Based upon the above data, the SFE of the buffer layer deposited on Cu plate was calculated using the Owens–Wendt–Kaelble equation, which is followed by ASME D7490-13, as follows:
 |


| Table 2. Surface free energy (in mN·m−1) of buffer layer deposited on Cu plate. . |
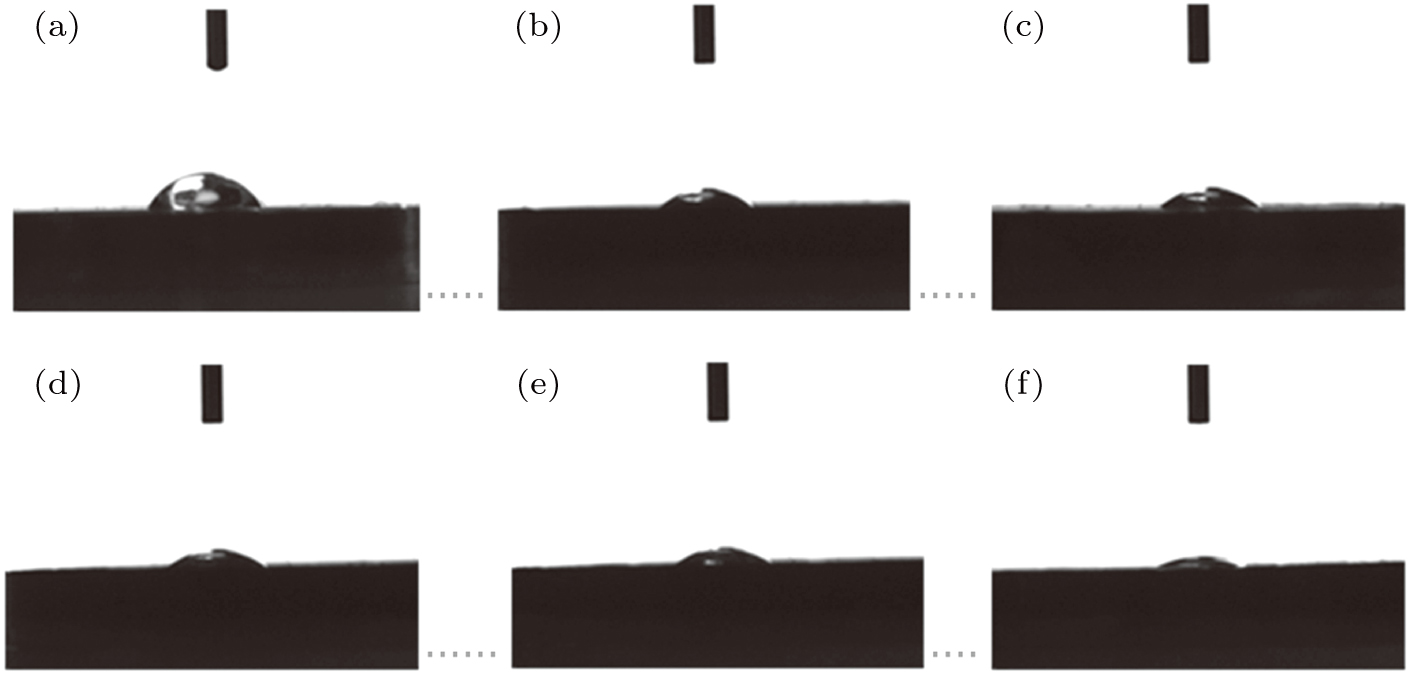
Figure
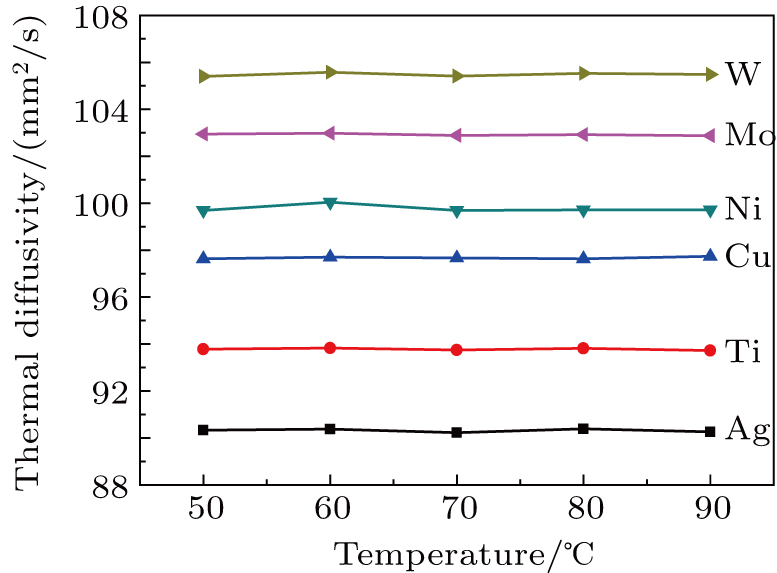
Figure
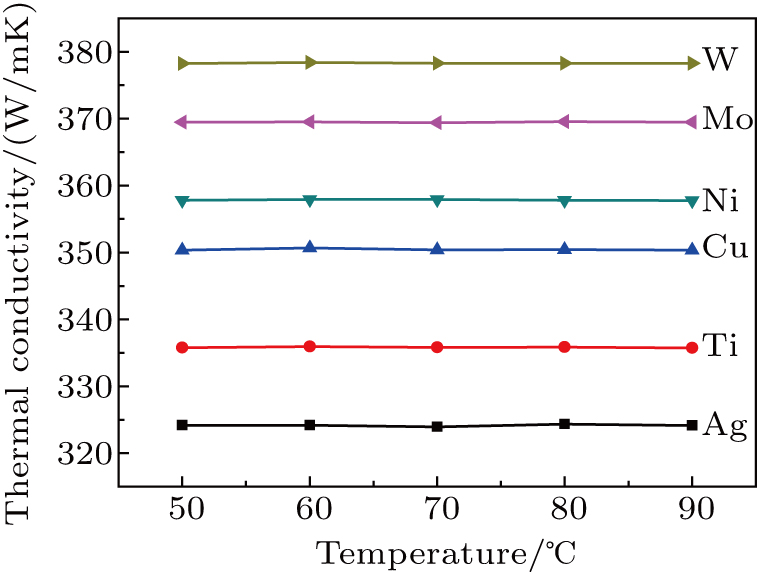
Figure
As we know, electrons dominate the thermal conduction in LMA/buffer layer, so energy transfer must occur between electrons in LMA and electrons in buffer layer. During the wetting procedure, high SFE buffer layer could promote LMA wettability,[21] which can improve the necessary electron–electron collision in the interfacial regions and heat transport pathways. This directly reduces the two interfacial thermal resistances, facilitating the achievement of low TCR. As expected, a buffer layer influences the wettability of LMA on the plate surface and interfacial thermal resistance, high SFE buffer layer can enhance the thermal transfer and facilitate the achievement of low interfacial thermal resistance.
Buffer layers of Ag, Ti, Cu, Ni, Mo, and W were deposited on polished Cu plates to investigate interfacial heat transfer. The buffer layer influences the LMA wettability, thermal diffusivity, thermal conductivity, and TCR of the samples. The thermal diffusivity, thermal conductivity, and TCR of the samples have no significant change with the measurement temperature. The wettability, thermal diffusivity, and thermal conductivity are enhanced with increasing the SFE of the buffer layer, the TCR is decreased monotonically by increasing the SFE of the buffer layer. High SFE buffer layer could promote LMA wettability, which can improve the necessary electron–electron collision in the interfacial regions and heat transport pathways. High SFE buffer layer can enhance the thermal transfer and facilitate the achievement of low interfacial thermal resistance.
| [1] | |
| [2] | |
| [3] | |
| [4] | |
| [5] | |
| [6] | |
| [7] | |
| [8] | |
| [9] | |
| [10] | |
| [11] | |
| [12] | |
| [13] | |
| [14] | |
| [15] | |
| [16] | |
| [17] | |
| [18] | |
| [19] | |
| [20] | |
| [21] |


