† Corresponding author. E-mail:
Project supported by the Science Fund from the Key Laboratory of Cryogenics, Technical Institute of Physics and Chemistry, Chinese Academy of Sciences (TIPC, CAS) (Grant Nos. CRYOQN201501 and CRYO201218) and the National Natural Science Foundation of China (Grant Nos. 51577185, 51377156, and 51408586).
The NiTi shape memory alloy exhibits excellent superelastic property and elastocaloric effect. The large temperature change (

Due to the large latent heat associated with the martensitic phase transformation, shape memory alloys are interesting candidates for solid state refrigeration.[1] Compared with the magnetocaloric[2–4] and electrocaloric cooling,[5,6] the elastocaloric cooling (whose caloric effect is driven by the uniaxial stress)[7–11] and barocaloric cooling (whose caloric effect is driven by the hydrostatic pressure)[12,13] have attracted much more attention in recent years. A giant barocaloric effect has been reported in the NiMnIn magnetic shape memory alloy in the past several years,[12] which was comparable to the magnetocaloric effect. What is more, the elastocaloric cooling technique has been assessed as being the most promising non-vapor compression mechanical refrigeration system because of its high coefficient of performance (COP) and moderate cost by the US Department of Energy[14] and opened the way to solid-state refrigeration.
Elastocaloric cooling is based on the diffusionless first order phase transformation of the shape memory alloy. The stress-induced martensite transformation leads to the heating of the material. After releasing the stress, the temperature of the material decreases due to the reverse martensite transformation. So, the elastocaloric effect can be regarded as the entropy change under isothermal condition (


Compared with other shape memory alloys (FePd,[17] CuZnAl,[18,19] NiFe- and NiMn-based SMAs[11,12,20–25]), the NiTi-based shape memory alloys[7,10,15,26,27] show wonderful potential due to their good elastocaloric effect. In poly-crystalline NiTi wires, Cui et al. reported a large temperature change (


Because the great majority of applications require a large quantity of materials, it would therefore be desirable to study bulk elastocaloric materials. Here in this paper, we study the elastocaloric effect of the poly-crystalline NiTi bulks. Some key parameters (
The starting materials were the poly-crystalline NiTi shape memory alloys (Ni49.8Ti50.2). The diameters of the tensile testing samples were all 2 mm. They were annealed above the austenite finish temperature (Af = 283 K). The gauge length of the specimen between the two grips was 60 mm. The uniaxial tensile tests were conducted on a testing machine (20KN, SUNS). The material testing system was equipped with a cryogenic furnace. The stress–strain curves at different temperatures were recorded at a low strain rate of 1 × 10⁻⁴ s−1 to ensure the isothermal condition. For the elastocaloric cooling measurement, the sample was loaded at a much higher strain rate of 5 × 10³ s−1 (the maximum loading/unloading rate of the testing machine in the strain control mode) to approximately approach to the adiabatic condition, and then held for several minutes to make sure that the specimen temperature returned back to the environmental temperature. Then, the sample was unloaded quickly. The temperature changes in the loading, holding, and unloading process were monitored by a platinum resistance thermometer attached at the middle position of the sample. To improve thermal contact, the platinum resistance thermometer was attached by using silver paint and then was firmly kept in place by means of Teflon tape. The output of the platinum resistance thermometer was read by the Keithley-2000 multimeter at a frequency of 2 Hz. The strain was measured by an electronic extensometer (YYU-10/50, Central Iron and Steel Research Institute at room temperature, and 3542-025M-050-LT, Epsilon at cryogenic temperature). It is worth noting that the quicker unloading rate did not result in a larger temperature drop in our previous work,[31] so the unloading rate of 5 × 10³ s−1 was regarded as a reasonable value in this paper.
Figure 


Figure
In order to measure the adiabatic temperature change, an increased strain rate of 5 × 10⁻³ s−1 is used in the tensile test (Fig. 

The 


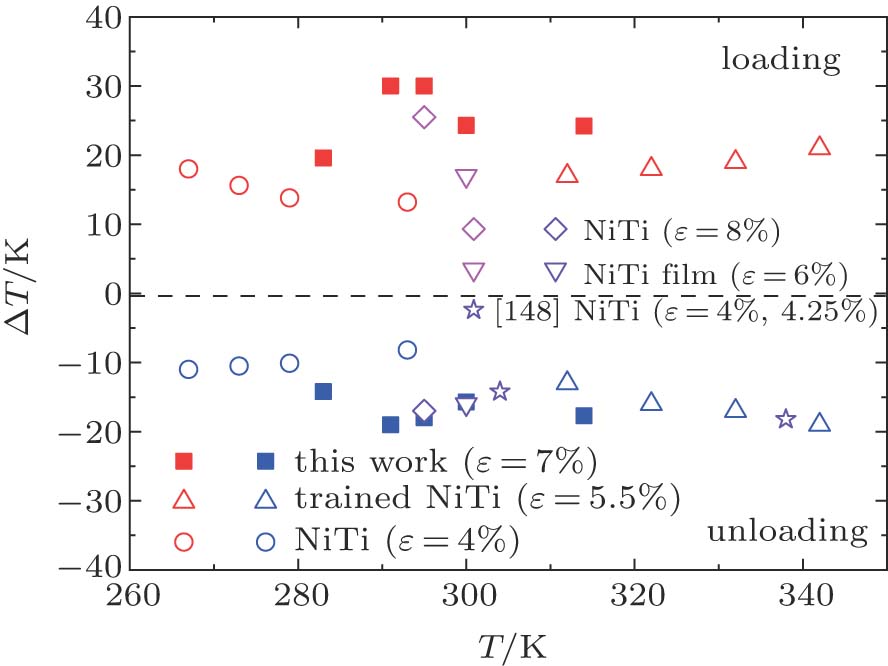
Figure 
 | Fig. 3. (color online) Measured temperature changes of NiTi alloys in the loading and unloading process with an applied strain of 7%. The open triangles correspond to the measured      |
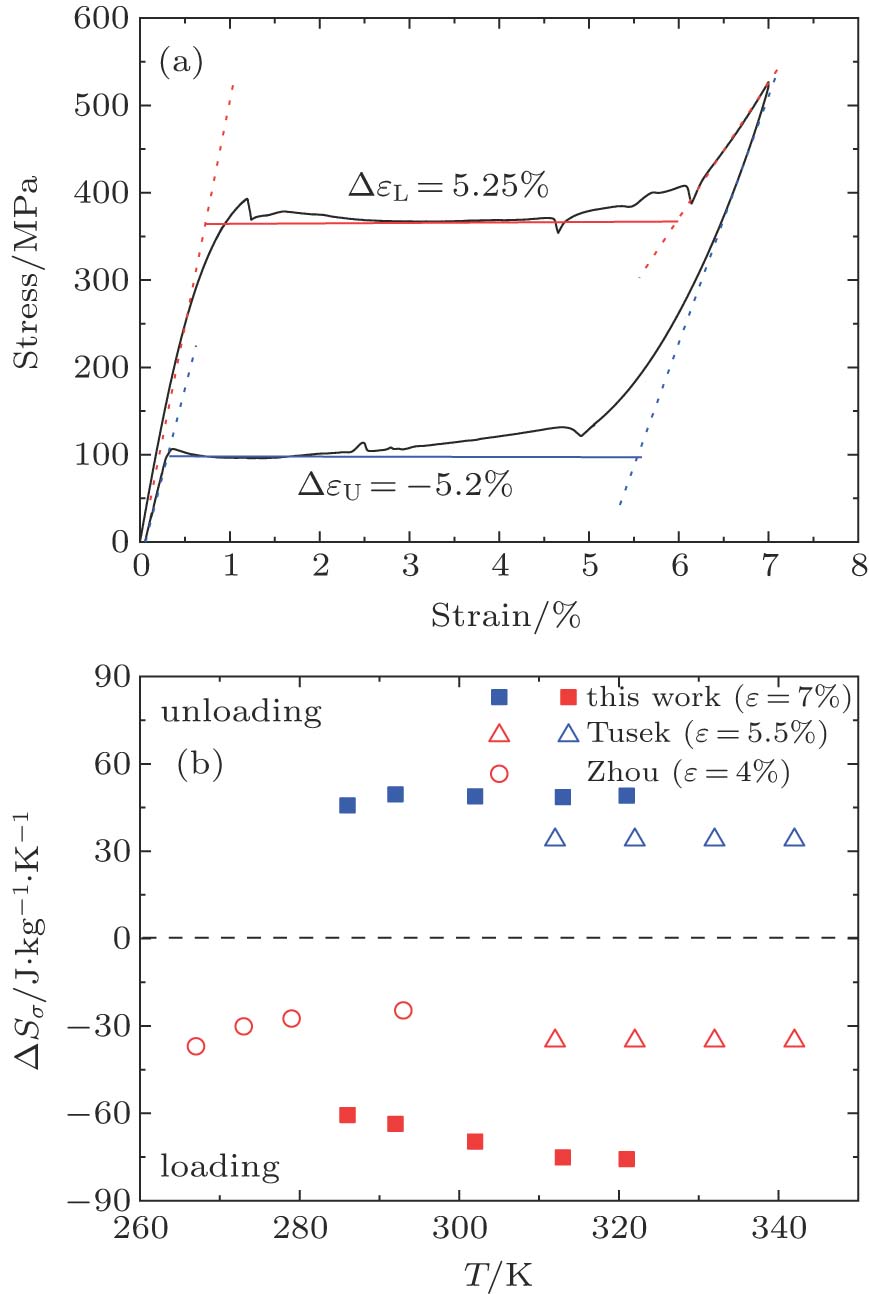
Based on the Clausius–Clapeyron equation, the stress-induced entropy change (


 | Fig. 4. (color online) (a) Transformation strain (Δ ε) values during stress-induced MT and the reverse MT at room temperature. (b) Stress-induced entropy change ( |
As mentioned above, the COPmater is expressed as the ratio of cooling power (Q) to input work (W) (


 | Fig. 5. The COPmater values of the NiTi alloys at different strain levels (ε = 1%–7%) in the unloading process. |
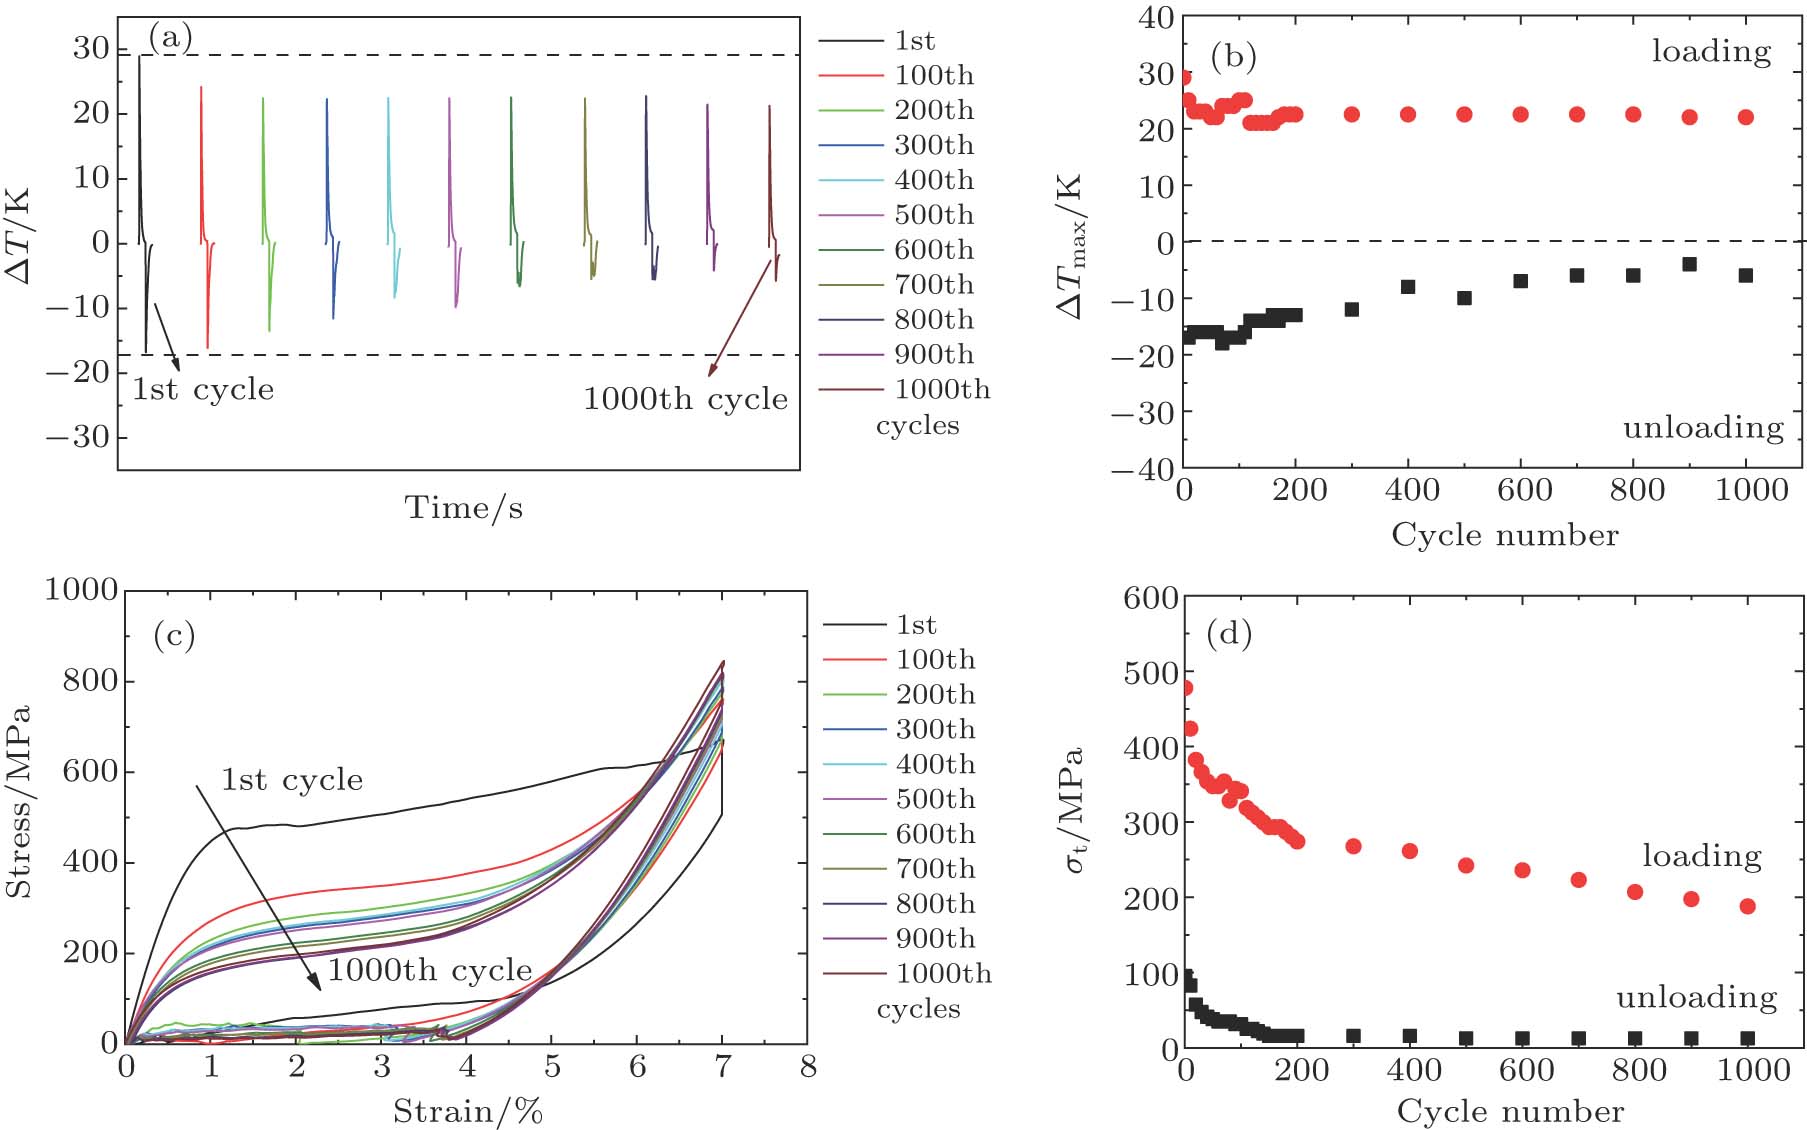
The tensile cycling test is performed 1000 times with a high strain rate (5 × 10⁻³ s−1) at 300 K. The 


In summary, the present NiTi alloys not only exhibit an excellent shape memory effect and superelasticity but also show a giant elastocaloric effect. Large temperature changes of 19 K∼30 K upon loading and −13 K∼−19 K upon unloading were measured, respectively, in a temperature range of 35 K (286 K–321 K). The maximum 


| [1] | |
| [2] | |
| [3] | |
| [4] | |
| [5] | |
| [6] | |
| [7] | |
| [8] | |
| [9] | |
| [10] | |
| [11] | |
| [12] | |
| [13] | |
| [14] | |
| [15] | |
| [16] | |
| [17] | |
| [18] | |
| [19] | |
| [20] | |
| [21] | |
| [22] | |
| [23] | |
| [24] | |
| [25] | |
| [26] | |
| [27] | |
| [28] | |
| [29] | |
| [30] | |
| [31] | |
| [32] | |
| [33] | |
| [34] | |
| [35] | |
| [36] |


