† Corresponding author. E-mail:
Supported by the China Seismo-Electromagnetic Satellite Mission Ground-Based Verification Project of the Administration of Science, Technology, and Industry for National Defense and Asia-Pacific Space Cooperation Organization Project (APSCO-SP/PM-EARTHQUAKE).
Enhancement of the electron fluxes in the inner radiation belt, which is induced by the powerful North West Cape (NWC) very-low-frequency (VLF) transmitter, have been observed and analyzed by several research groups. However, all of the previous publications have focused on NWC-induced > 100-keV electrons only, based on observations from the Detection of Electro-Magnetic Emissions Transmitted from Earthquake Regions (DEMETER) and the Geostationary Operational Environmental Satellite (GOES) satellites. Here, we present flux enhancements with 30–100-keV electrons related to NWC transmitter for the first time, which were observed by the GOES satellite at night. Similar to the 100–300-keV precipitated-electron behavior, the low energy 30–100-keV electron precipitation is primarily located east of the transmitter. However, the latter does not drift eastward to the same extent as the former, possibly because of the lower electron velocity. The 30–100-keV electrons are distributed in the L = 1.8–2.1 L-shell range, in contrast to the 100–300-keV electrons which are at L = 1.67–1.9. This is consistent with the perspective that the energy of the VLF-wave-induced electron flux enhancement decreases with higher L-shell values. We expand upon the rationality of the simultaneous enhancement of the 30–100- and 100–300-keV electron fluxes through comparison with the cyclotron resonance theory for the quasi-linear wave-particle interaction. In addition, we interpret the asymmetry characteristics of NWC electric power distribution in north and south hemisphere by ray tracing model. Finally, we present considerable discussion and show that good agreement exists between the observation of satellites and theory.
There are many factors that cause high-energy particle acceleration, precipitation, and short-term, sharp increases in particle count rates in radiation belts, including the influence of ground-based VLF electromagentic (EM) transmitters, lightning and thunderstorms, and ground nuclear testing. The primary mechanism of ground-based VLF EM transmission is that the emitted EM wave is transmitted across the atmosphere, expands into the ionosphere, and interacts with the energetic particles in the radiation belt. This interaction accelerates the particles by changing their momentum or scattering their pitch angle, which causes them to enter the bounce or drift loss cones LCdrift. As a result, a mass of energetic particles accumulates within a certain L-shell and yields particle-flux enhancement, which can be observed by the onboard particle detectors of satellites.[1–6]
Numerous experimental observations and theoretical interpretations of the electron-flux enhancement induced in the inner radiation belt by VLF ground-based transmitters have been reported.
For example, Kimura et al. have found strong correlations between the 0.3–6.9-keV electron fluxes observed by the EXOS-B satellite and the 0.3–9-kHz VLF wave emitted by the ground-based transmitter at SIPLE.[7] The observed instantaneous correlation between the VLF signal and the electron fluxes has been studied[8] and interpreted using wave–particle interaction theory,[9] which was applied to a test-particle model of a gyroresonant wave–particle interaction in order to calculate the precipitation characteristics of the particle flux induced by a VLF transmitter. Hence, it was found that the particle precipitation is controlled by the α distribution near the edge of the loss cone.
The Lualualei (NPM) VLF transmitter has been studied by Inan et al.,[10] who have suggested that the energetic electrons induced by this transmitter, which are scattered at the NPM longitude, continue to precipitate into the atmosphere as they drift toward the South Atlantic Anomaly. Further, Graf et al. have compared the precipitating fluxes with predictions based on ray-tracing analysis of the wave propagation and test-particle modeling of the wave-particle interaction.[11] Their results indicate that the precipitated flux of the > 100-keV electrons induced by the NPM transmitter peak at L≃1.9. They have also indicated that the detection rate is related to the orientation of the Detection of Electro–Magnetic Emissions Transmitted from Earthquake Regions (DEMETER)[12,13] particle detector, obtaining agreement between their observations and theory.
Several studies of the electron-precipitation belts induced by the North West Cape (NWC) VLF ground-based transmitter have also been conducted, and the events related to this transmitter are the focus of this paper. Based on readings from the DEMETER satellite, Sauvaud et al. have observed NWC-transmitter-induced enhancements in the 100–600-keV LCdrift electron fluxes at L values of 1.4–1.7.[14] These researchers have calculated the variation in the energy of the enhanced electron fluxes in response to changes in L using the first-order cyclotron resonance theory of wave–particle interaction; hence, they have obtained results consistent with observation. Further, Li et al. have analyzed the energy spectra of the NWC electron belts precisely using an on–off method, and explained the α range by considering the quasi-linear diffusion equation of wave-particle theory.[15] Independently of the DEMETER detection of the NWC-transmitter-induced electron enhancement of LCdrift, Gamble et al. have also examined the data for > 100-keV quasi-trapped electron fluxes and reported similar enhanced electron counts from the 90° electron telescopes on the National Oceanic and Atmospheric Administration (NOAA) 15, 16, 17, and 18 Polar-orbiting Operational Environmental Satellite (POES), for the time period in which the NWC transmitter was broadcasting.[16]
In the early work by Kennel et al. on the pitch angle scattering of radiation-belt particles, the gyroresonant wave–particle interactions were thought to play a crucial role in the magnetosphere physics.[17] Further, scattering by chorus waves was studied as the dominant cause of diffuse auroral precipitation.[6] One of the theoretical models for numerically calculating the precession of waves inducing energetic particle precipitation is the quasi-linear diffusion equation. In particular, Summers et al. have developed a precise formula of quasi-linear diffusion coefficient corresponding to R- or L-mode EM waves which have a Gaussian spectral density and propagate in a hydrogen plasma.[18] These researchers have expanded the collisionless Vlasov equation for the particle-flux differential function to the second-order perturbation and obtained the diffusion equation form. In the inner radiation belt, the particle velocities are generally significantly larger than the typical phase velocities of the waves; therefore, pitch angle diffusion plays a dominant role in the wave–particle interaction.
In addition, many electron-belt effects induced by man-made VLF ground-based transmitters can be described using the theoretical model of wave–particle interaction. For example, Horne et al. have studied the mechanism behind the wave-induced electron acceleration in the outer radiation belt.[4] These researchers have shown that the electrons can be accelerated by EM waves at frequencies of a few kHz, which can also increase the electron flux by more than three orders of magnitude over an observation timescale of 1–2 d.
However, all of the previous analyses of the NWC-transmitter-induced particle precipitation have focused on particles with energies above 100 keV only. In this paper, we present a more comprehensive survey of energetic particles for a wider energy spectrum, including particles with energies below 100 keV. We will then simulate the wave–particle interaction process for NWC-induced electron precipitation using quasi-linear diffusion theory, which considers the α scattering and energy diffusion for different L values. We compare the simulation results to the observations from the DEMETER and NOAA satellites. Finally, we discuss the limitations of the theory.
The NWC ground station is located in the northwest corner of Australia with geographical coordinates of (21.82°S, 114.15°E), and geomagnetic coordinates of (−31.96°, 186.4°), which emits electromagnetic waves with frequency of 19.8 kHz, a very narrow bandwidth and a large emission power of 1 MW.[15]
The DEMETER satellite was launched in June 2004 and is a low-altitude satellite with onboard detectors to measure local electric and magnetic fields and energetic particle populations.[12,13] This satellite, having a quasi-Sun-synchronous orbit, travels downward (from north to south) during local daytime and upward (from south to north) during local nighttime. The orbital period is 102.86 min.
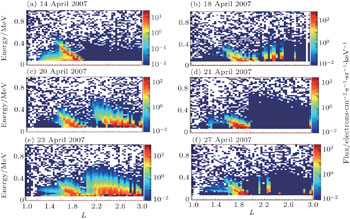
Data on the NWC-induced electron belts have been obtained using DEMETER and analyzed.[15] These data indicate the presence of obvious wisp structures, which correspond to a spectrogram of NWC electrons distributed in five different L-value regions (see Fig. 10 in Ref. [9] for details). Thus, it has been confirmed that the electron precipitation belts are caused by EM waves emitted from the NWC transmitter. The L values for the NWC electron belts range from 1.5 to 2.2. The local pitch angle α for the NWC electron belts measured by the DEMETER detector is approximately 60°–110°, which corresponds to an equatorial pitch angle αeq of 23.5°–25° at a latitude of 37° in the southern hemisphere.
The NOAA satellites are positioned in a polar orbit (inclination angle: 99°) at altitudes of 807–854 km. The constituent particle detectors (Space Environment Monitor; SEM-2), which monitor the proton and electron fluxes at the satellite altitudes, consist of total energy detectors (TEDs) and medium energy proton and electron detector (MEPEDs). An MEPED is composed of eight solid-state detectors.
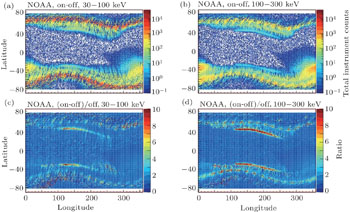
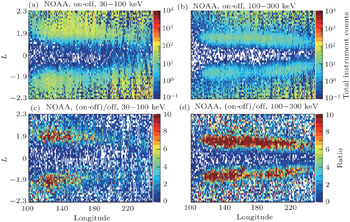
In addition to the wisp structure of the NWC-induced electron precipitation observed by the DEMETER satellite, we have investigated the observed data for the inner-radiation-belt electrons using data recorded in 2007 by NOAA satellites. Following the approach described in Ref. [16], we also present NWC-induced electron belts obtained from NOAA data in Fig.
Note that waves from the NWC primarily propagate through the ionosphere at night.[19] Thus, we combined all the 16-s electron integral flux observations provided by the NOAA National Geophysical Data Center by summing the observation data obtained by the NOAA 15, 16, 17, and 18 POES at night (2200–0600 UT).
In contrast to Ref. [16], we exhibit the NWC electron belts in the lower-energy region (30–100 keV) in Figs.
Examples of NWC wisp structures observed by the DEMETER satellite are exhibited in Fig.
Originating from the Fokker–Planck equation, the quasi-linear diffusion equation has been developed as a practical and convenient form.[20–23,45] Similar to the dipole field case, the diffusion equation used in this paper, which includes both pitch angle and momentum diffusion, is expressed as


The wave-frequency spectrum density is assumed to obey a Gaussian distribution. Assuming the field-aligned electromagnetic wave, the closed analytical form of the local pitch-angle diffusion coefficient of the wave–particle interaction is derived as follows (see Ref. [18], Eqs. (33)–(35)):
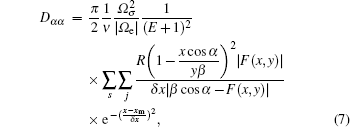
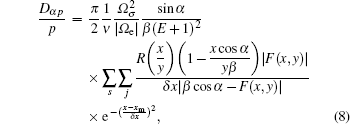


We solve the bounce-averaged Fokker–Planck equation numerically on (αeq, p) plane at different L. The domain of our simulation corresponds to [0,π/2] in αeq, [0 MeV, 1.5 MeV] in Ek, and [1,3] in L. The grid points are chosen to be 200×200×100 for equatorial pitch angle, momentum, and L-shell, respectively. These grid points are distributed uniformly in our simulation domain. Our time step in this simulation is 100 s.
Since mixed partial derivatives appear in our diffusion equation, we choose fully implicit finite difference method to keep our simulation stable (similar to Ref. [22]). Schematically, our equation takes the form


In order to resolve the wave–particle interaction equations with mixed derivative term, many numerical simulation methods have been introduced.[28,45] Here our simulation time is only several hours, with the time step 100 s, so a conventional fully implicit finite difference method is enough in this work.
In the numerical simulation of the quasi-linear diffusion to the NWC electron belts, the initial diffusion function f0 satisfies the empirical formula

In our simulation, we apply Dirichlet boundary condition at Ek = 0 MeV, and Neumann boundary condition on other boundaries. For αeq


In order to simulate the NWC electron belts induced by whistlerwaves in the ionosphere, the following parameters are chosen for use in the quasi-linear wave–particle coupling model: a Gaussian wave spectrum center frequency ω/(2π) = 19.8 kHz; a wave amplitude δb = 200 pT, which is consistent with the calculated result obtained via the NWC EM wave propagation described by full-wave model analysis,[29,30] a semi-bandwidth of 500 Hz, which is approximately consistent with the observed values obtained from the electric-field instruments on board the DEMETER satellite, and an equatorial magnetic field B = 3.11×10⁻⁵/L3 T, which is determined by a dipole model.
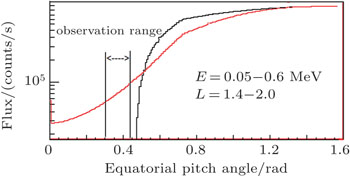
We still consider the effect of the bounce loss cone and drift loss cone in the numerical simulation on the NWC electron precipitation belts. The bounce loss cone LCbounce depends on the L-shell according to the expression

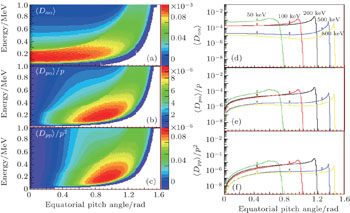
The bounce-averaged diffusion coefficients are exhibited in Fig.
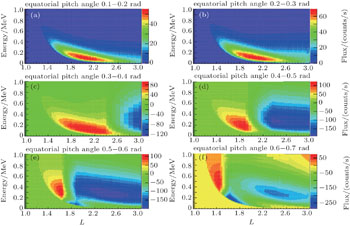
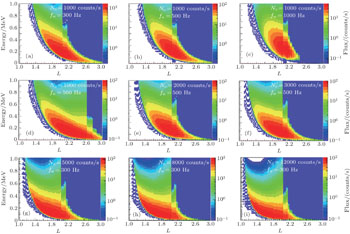
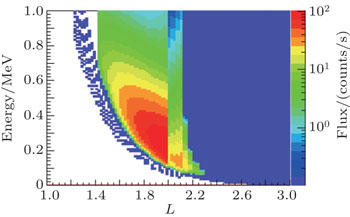
By following the above numerical simulation method in Section 3.2, simulated results for 4-h evolution were obtained and are presented in Fig.
Figure
Figure
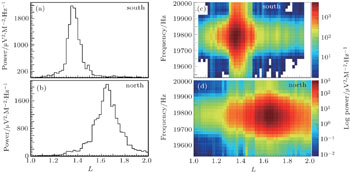
The NWC electric field power distribution for the entirety of January 2007, as detected by the DEMETER satellite, is shown in Fig.
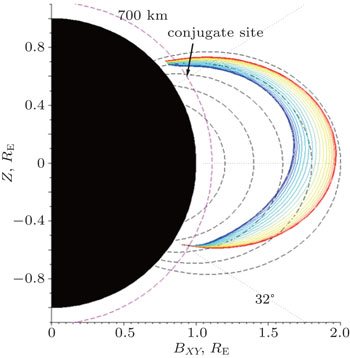
In order to explain this phenomenon, we use ray tracing model in a cold plasma in dipole magnetic field,[46–49] to simulate the NWC wave propagation path in magnetosphere. Electromagnetic waves with 19.8 kHz are launched at L = 1.35 close to NWC site on southern hemisphere, over a cone of 5 degrees with respect to the vertical direction of Earth’s surface. The launch position is at geographic coordinate (21.82°S, 114.15°E) and geomagnetic coordinate (−31.96°, 186.4°). Figure
In this work, in addition to the previously reported electron precipitation with 100–600-keV energy detected by the DEMETER satellite, we have still reported enhancement of the 30–100-keV electron flux observed by the NOAA satellites at night, when the powerful NWC VLF transmitter is broadcasting. We then performed a validity check using a theoretical model, i.e., the quasi-linear diffusion equation, and demonstrated approximate agreement with the satellite observation results.
Many factors influence the simulation results obtained using the quasi-linear diffusion equation, including the adopted wave semi-bandwidth, electron density. In Fig.
Thus, these results indicate that the quasi-linear wave particle interaction model can describe an NWC electron precipitation wisp structure approximately, and can also explain the coupling characteristics of wave–particle interaction in a general sense. In particular, below the 0.1-MeV electron energy, the theoretical simulation results demonstrate agreement with the NOAA satellite observations shown in Fig.
Electron precipitation or accumulation in the ionosphere may also be caused by both energy diffusion and radial diffusion in the L-shell.[32,33] However, in the inner radiation belt, the effect of radial diffusion on the L-shell can be omitted, especially at the satellite altitudes of hundreds of kilometers. The radial diffusion plays a large role in the wave–particle interaction only in the outer radiation belt.[5] In addition, when the theoretical simulation time is sufficiently long, e.g., having a duration of approximately 1 yr,[34] the radial diffusion in the L-shell evolution must be considered in the wave–particle interaction analysis in the inner radiation belt. Thus, significant attention is not paid to the effect of radial diffusion on the NWC electron belts in the analysis of the wave–particle interaction simulation conducted in this study.
However, we must note that the quasi-linear theory is thought to describe interactions between charged particles and small-amplitude broadband waves.[35] When the wave amplitude increases or the band becomes narrower, nonlinear effects such as phase trapping and bunching are more likely to become dominant, calling the use of quasi-linear theory into question.[36] Inan et al. have studied the nonlinear pitch angle scattering of energetic electrons by coherent VLF waves in the magnetosphere and compared their observations with linear theory.[37] They have also defined a quantity ρ, the ratio of the maximum absolute values of the wave and inhomogeneity terms, so as to differentiate between the linear and nonlinear interactions. Furthermore, Tao et al. have reported that the nonlinear interactions may be important near the equatorial plane, even for a moderate wave amplitude, and have shown that phase trapping is likely to occur when the wave-induced motion dominates the adiabatic motion.[38] These researchers subsequently used a test-particle code to confirm that the effect of the amplitude modulations should be considered in the quantitative treatment of nonlinear interactions between electrons and chorus waves.[39,40] There are other related works about dynamics of high-energy electrons interacting with whistler mode chorus emissions studied by test particle simulations.[41,42] Su et al. pointed out that the nonlinear physical processes, including boundary reflection effect, phase bunching and phase trapping, start to occur as the amplitude increases by studying the interaction between electrons and parallel-propagating monochromatic EMIC waves.[43] He then further presented that the nonlinear processes depend on the electron initial latitude and decrease or increase the loss rate predicted by the quasi-linear theory.[44] In addition, the azimuthal advection may play an important role in the radiation belt electron dynamics,[45] in the next work, we will study this effect and attempt to incorporate it into the theory model for research of ground-based induced electron precipitation belts.
Therefore, in our next work, we will attempt to adopt a non-linear theory model to further study this wave–particle interaction event, focusing on the quantitative calculation.
Also considering the real NWC electric-field power distributions in the L-shell for the south and north hemispheres observed by the DEMETER satellite, shown in Fig.
From the simulation results shown in Fig.
In addition, we believe that analysis of the effects of the NWC VLF wave propagation and electron precipitation, along with the development of a comprehensive theoretical model, will facilitate the study of ground-based waves propagating into the ionosphere and interacting with high-energy particles in radiation belts. Based on wave–particle interaction theory, investigation of the EM disturbance in the ionosphere induced by seismic electromagnetic signals will be particularly useful, supposing that it is possible for seismic electromagnetic signals to propagate into ionosphere. As regarding to the influence of the EM waves emitted by seismic activities in wider space, a large number of works have also been published on this topic, including studies based on satellite observation[50] and theoretical exploration research.[51–53]
| 1 | |
| 2 | |
| 3 | |
| 4 | |
| 5 | |
| 6 | |
| 7 | |
| 8 | |
| 9 | |
| 10 | |
| 11 | |
| 12 | |
| 13 | |
| 14 | |
| 15 | |
| 16 | |
| 17 | |
| 18 | |
| 19 | |
| 20 | |
| 21 | |
| 22 | |
| 23 | |
| 24 | |
| 25 | |
| 26 | |
| 27 | |
| 28 | |
| 29 | |
| 30 | |
| 31 | |
| 32 | |
| 33 | |
| 34 | |
| 35 | |
| 36 | |
| 37 | |
| 38 | |
| 39 | |
| 40 | |
| 41 | |
| 42 | |
| 43 | |
| 44 | |
| 45 | |
| 46 | |
| 47 | |
| 48 | |
| 49 | |
| 50 | |
| 51 | |
| 52 | |
| 53 |


