Experimental research on spectrum and imaging of continuous-wave terahertz radiation based on interferometry
Lu Tie-Lin1, Yuan Hui1, Kong Ling-Qin2, Zhao Yue-Jin1, †, , Zhang Liang-Liang2, Zhang Cun-Lin2
Beijing Key Laboratory for Precision Optoelectronic Measurement Instrument and Technology, School of Optoelectronics, Beijing Institute of Technology, Beijing 100081, China
Department of Physics, Capital Normal University, Beijing 100048, China


† Corresponding author. E-mail: yjzhao@bit.edu.cn

Project supported by the National Natural Science Foundation of China (Grant Nos. 61377109 and 11374007).

Abstract
Abstract

A system for measuring terahertz spectrum is proposed based on optical interferometer theory, and is experimentally demonstrated by using a backward-wave oscillator as the terahertz source. A high-resolution, high-precision interferometer is constructed by using a pyroelectric detector and a chopper. The results show that the spectral resolution is better than 1 GHz and the relative error of frequency is less than 3%. The terahertz energy density distribution is calculated by an inverse Fourier transform and tested to verify the feasibility of the interferometric approach. Two kinds of carbon-fiber composites are imaged. The results confirm that the interferometer is useful for transmission imaging of materials with different thickness values.

1. Introduction

Terahertz waves are those waves whose frequencies are in the frequency range of 0.1 THz–10 THz, the portion between the infrared band and the millimeter wave in the electromagnetic spectrum.[1,2] Terahertz waves can penetrate paper, leather, foamed plastic, and other materials. Furthermore, they are safe for the human body and for other organisms.[3] In addition, terahertz waves have special applications in transmitting information for broadband wireless communications.[4] With the advent of various terahertz sources, such as the Gunn oscillator, terahertz quantum cascade lasers, and the backward-wave oscillator (BWO), the need for precise frequency spectrum measurements in various noisy environments has increased. However, recent research suggests that there are only a few precise, effective methods of detecting terahertz waves over their full frequency range.

In order to quantify the physical properties of a terahertz wave, two main methods for spectrum detection have been proposed so far: heterodyne and interferometric techniques. Of these, the heterodyne method is always used by electronic and electro-optic sampling.[510] However, the electronic heterodyne method can only characterize a narrow band of frequencies within the terahertz spectrum in the course of a single measurement, and precise measurements of high frequencies are difficult to obtain; electro-optic sampling of the heterodyne method is used to detect the spectra of pulse terahertz wave sources, but the signal-to-noise ratio is usually poor. Furthermore, the existing heterodyne measure system often requires an extra mock-locked laser source on the gap of the photoconductive antenna (PCA) in the detecting units, which increases the cost and the complexity of the experiment. The interferometric method, which has typically been used for detecting laser beam spectra, has emerged as a modern method for terahertz wave metrology.[1113] The interferometric method enables the real-time detection of single-frequency continuous terahertz sources within 6 GHz,[14] while the optical interference systems can extend the measurable frequency range of the terahertz source by using interference principles. Optical interference systems are real-time, quantitative, and cost-effective; and they have been used to measure broadband pulsed terahertz waves.[15] In the present paper, we discuss an optical interference measurement system that can detect the full frequency range and energy density of continuous terahertz waves. Previous research on pulsed terahertz waves,[16] suggests that this method has the potential for covering the entire terahertz band; however, the BWO source that we used is limited to relatively low output frequencies ranging from 160 GHz to 260 GHz. The experimental results show that the spectral resolution is better than 1 GHz and the relative error of frequency is less than 3%. In the recent research,[1721] the energy density of a terahertz wave can be tested with the interferometric system, which can be measured in frequency-multiplied broadband terahertz sources and the necessary information to create images of the measured object can be obtained by two-dimensional (2D) scanning.

2. Experimental setup

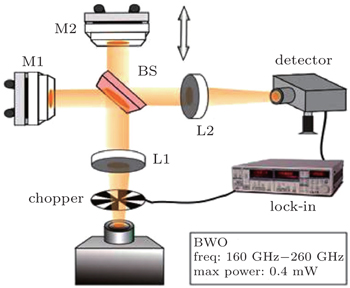
The terahertz interferometer system used in the study is shown in Fig. 1. A BWO with an output frequency in the 160 GHz–260 GHz range is used as a terahertz source. It offers an output that is extremely coherent, polarized, and monochromatic (ν/ν ≈ 10−5), with an output power of at least 0.4 mW.

The terahertz wave produced by the BWO is modulated by a chopper and collimated with lens L1 (a teflon lens with a diameter of 100 mm and a focal length of 100 mm). The parallel light beam from L1 is divided into two parts by a high-resistivity silicon wafer acting as a beam splitter (BS); this wafer is 0.5-mm thick. One of the split beams, which is reflected by the fixed mirror, acts as a reference beam, while the other beam, which is reflected by the movable mirror, serves as a measurement beam. The reference beam and the measurement beam are re-combined in the same direction after passing through the BS the second time. The combined beam is focused onto the detector by lens L2 (the focus lens has a diameter of 50 mm and a focal length of 50 mm).

Fig. 1. Schematic of the terahertz interferometer system.

Because of the pyroelectric effect, the pyroelectric detector generates a voltage signal proportional to the intensity of the incident interference beam. A lock-in amplifier analyzes the signals generated by the detector through using the chopper frequency as a reference. With 10-Hz modulation of the chopper and 10-ms lock-in time, the minimum detectable power (Imin) from the BWO is 0.4 μW. According to the formula: DR = 20lg(Imax/Imin) along with the fact that the maximum output power (Imax) of the BWO is 0.4 mW, the dynamic range of the system is calculated to be 60 dB.

3. Mathematical model

Our terahertz spectrum analyzer is based on the Michelson interferometer optical system. According to interferometer theory, the interference intensity (I) can be expressed as

where I1 is the intensity of the measurement beam; I2 is the intensity of the reference beam (both I1 and I2 are derived from the incident light); and Δϕ is the phase difference between the measurement and reference beams. When the optical path difference between the measurement beam and the reference beam is x, the corresponding phase difference is Δϕ = 2π x/c, where f is the frequency of the terahertz wave and c is the velocity of light. When x changes linearly, the alternating component (AC) of the interference intensity (IAC), with respect to the measurement and the reference beams, also changes linearly according to the cosine law. The spectrum distribution F(ν) of IAC can be obtained by a Fourier transform of the AC component.[17] The ideal formula for F(ν) is as follows:

Since F(ν) in Eq. (2) is related to the frequency of the incident light f, we can obtain the spectral distribution formula from the interference intensity.

In addition to acquiring the terahertz spectrum, we can also obtain the energy density of the incident beam by inverse Fourier transformation of the interference intensity. The theory can be expressed as follows.

If the spectral radiation energy density of the terahertz source is S′(x), and the intensities of the detection and reference beams are equal, then the interference intensity can be expressed as

where K is a constant and x is a location coordinate. Considering the fact that the refractive index of air is 1, and ignoring the additional phase difference introduced by the BS, the alternating current (AC) component of the interference intensity can be expressed as

Thus, the energy density of light source S′(x) can be obtained by inverse Fourier transforming the AC component of the interference intensity as

The chopper signal is a square wave signal, hence, the modulated intensity of the terahertz wave can be expressed as follows:

Using the voltage signal received by a pyroelectric detector as the input for the lock-in amplifier, and the chopper output as reference, the output of the lock-in amplifier can be expressed as

where A is a modulus, which is related to the conversion efficiency of the pyroelectric detector and the amplification factor of the lock-in amplifier.

Equation (7) is proportional to Eq. (1), so with this method we can acquire the same results. When the mirror M2 moves linearly, the interference intensity (I) is recorded, and the spectral distribution and energy density distribution of the terahertz source can then be acquired by a Fourier transform and an inverse Fourier transform of the interference intensity respectively.

4. Results and discussion
4.1. Measurements of the frequency

The output frequency of the BWO is controlled by its input voltage. In this study, selected frequencies in the range from 160 GHz to 260 GHz (corresponding to input voltages between 1.0 kV and 3.7 kV) are used as the test frequencies. The range of travel of the stage is 152 mm and the corresponding spectral resolution is 0.9872 GHz. Figure 2 shows the measured interference intensity and the results of fitting the measured data to a sine wave, corresponding to the 260-GHz output frequency.
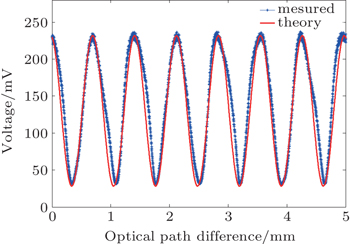
Fig. 2. 260-GHz measurement result. The solid line denotes the measured interference intensity; the dotted line gives the result of fitting to a sinusoidal waveform.

Figure 2 shows that the measured interference intensity agrees well with the standard interference intensity of the measured frequency. The experimentally measured curve coincides well with the sine function curve, indicating that the chopper and lock-in amplifier used are very effective in reducing the background noise of the system. This confirms that the interference properties of the system are consistent with the theoretically expected values.

The output frequency of the BWO is a function of the input voltage; their relationship can be approximated by the following formula:

where f0 = 101.982658 GHz, f1 = − 0.418425 GHz, f2 = 0.094269 GHz, and f3 = − 0.000739 GHz according to the manufacturer’s instruction manual for the BWO. In the experimental work, we use the voltages in Table 1 as inputs to obtain the respective output frequencies.

Table 1.

Input voltages and output frequencies.

.

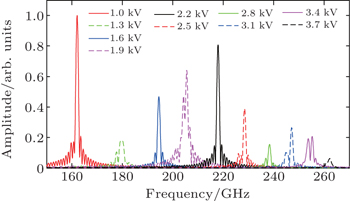
The frequency test results (Fig. 3) can be obtained by applying a Fourier transform to the respective interference intensities obtained experimentally. The colored lines correspond to the output frequencies in Table 1.

Fig. 3. Frequency spectra of the experimental results.

Using the frequencies specified by the manufacturer’s instruction manual for the BWO, the standard frequency curve can be obtained as shown by the black solid line in Fig. 4. Transforming the center-frequency results from Fig. 3 into a curve, we obtain the red dotted line in Fig. 4.
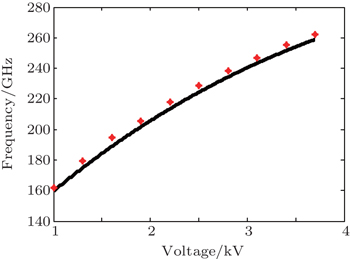
Fig. 4. Curve of the calculated frequency (black line) compared with the experimentally measured results (red dots).

Figure 4 shows that the frequency measured by this terahertz interferometer is close to the calculated value within an error of less than 3%.

4.2. Energy density distribution measurement results

According to the communication principle, the resolution σ of the system is proportional to the maximum optical path difference, or the scan range of the stage. When the scanning range of the system is L, the maximum delay time is 2L/c. The corresponding minimum frequency resolution is inversely proportional to the maximum delay time; accordingly, the resolution of the system can be expressed as

In this system, L = 152 mm. From Eq. (9), the resolution of the system is calculated to be 0.9868 GHz.

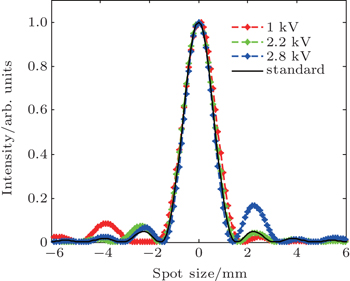
Equation (9) indicates that a higher resolution will be obtained by increasing the scan range. The energy density distribution of the terahertz source can be acquired by inverse Fourier transformation of the measured interference intensity. If the light source is an ideal point source, then the corresponding one-dimensional energy density curve, according to Fraunhofer diffraction formula, is equal to sinc2[Dx/()] at the focal plane,[22] for D is the diameter, f is the focal length of L2, x is the location coordinate and D/f of the system is equal to relative aperture of L2, when λ = 1.408 mm (the theoretical BWO wavelength corresponds to an input of 2.2 kV). In this case, the theoretical energy density for a monochromatic light source with L = 152 mm can be extracted as indicated by the black solid line in Fig. 5.

Fig. 5. Energy density distribution curves of the terahertz source. The blue, red, and green dotted lines denote the measured results when the frequency was 160 GHz, 200 GHz, and 233 GHz, respectively.

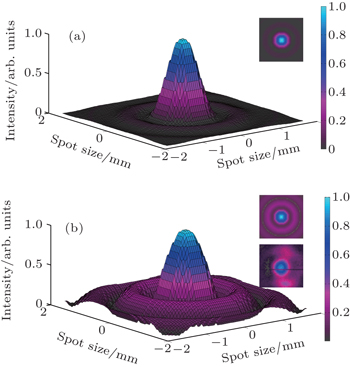
The 2D distribution of the test result is shown in Fig. 6. The inset in Fig. 6(a) and the upper inset in Fig. 6(b) display the plane views of the results acquired using our system, while the lower inset in Fig. 6(b) shows the measured result acquired using a 2D terahertz camera (Ophir-Spiricon, America).

The main peaks of the measured curves in Fig. 5 coincide well with each other, and with that of the theoretical curve as well. The secondary peaks of the experimental results show that the side lobes are not symmetrical, and that the energy density distributions differ slightly with varying frequencies. In addition, the central spot of the 2D result acquired by this optical system [up inset in Fig. 6(b)] agrees well with the result obtained by the terahertz image camera. However, in the case of the third or fourth rings, the terahertz camera image could not clearly distinguish between the rings and the background as shown in the lower inset in Fig. 6(b), but with the method proposed in this paper, the rings can be clearly reconstructed as shown in the upper inset in Fig. 6(b). Both figures 5 and 6 indicate excellent consistency of the measured energy density at different frequencies, and show that the measured results fit well with the theoretical values.

Fig. 6. 2D energy density distributions of (a) theoretical and (b) measured terahertz waves.
4.3. Transmission imaging results

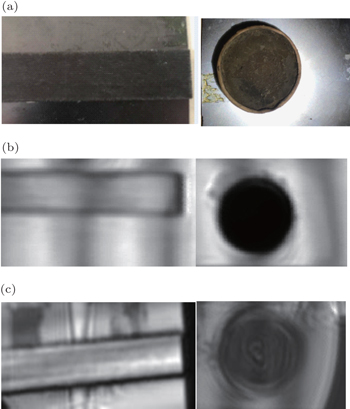
To demonstrate an important interference imaging application, two different composite materials, composed of carbon fiber and reinforced plastic, are pasted on M1 and used for transmission-type imaging at 206 GHz, which is the maximum frequency at which the BWO can produce sufficient output power. M1 is mounted on a computer-controlled XY stage in steps of 0.5 mm, and placed at the focal point of a new focusing lens (not shown in Fig. 1) that is inserted in the measurement beam in front of M1. The position of M1 in the XY plane (i.e., the plane that is perpendicular to the beam axis) is adjusted so that the reference beam passes through different parts of the material, and is then reflected back from M1 collinearly. The reference beam and the measurement beam are both focused onto the detector by a focusing lens (L2) to accomplish data acquisition. After data processing, 2D images of the composite materials are obtained with an image resolution of approximately 1 mm, which can be explained as follows. If the numerical aperture (NA) of L2 is 1, the theoretical focal spot diameter at 206 GHz is δ = 2λ/(π NA) = 0.93 mm, and the Rayleigh criterion specifies a spatial resolution of Δδ = 0.61λ/NA = 0.89 mm. Figure 7(a) shows a photograph of the sample, figure 7(b) shows the image results of the conventional transmission imaging method at the same wavelength. Figure 7(c) shows the images that are reconstructed from the measurements of the THz waves. Compared with the conventional transmission imaging results, the latter image not only presents the profiles of the material surface but also brings out the interior characteristics of the sample without destroying the surface; hence, this technique can be used as a non-destructive means for examining various carbon-fiber composites.

Fig. 7. Measurement results of two carbon-fiber-reinforced composite materials. Panel (a) shows an optical photograph of the sample, panel (b) displays an image produced by the conventional transmission, and panel (c) exhibits a reconstructed transmitted interference image of the sample.
5. Conclusions

In this work, a measurement system for terahertz spectra and energy densities is proposed based on an optical interferometer. The spectra can be tested precisely by varying the scanning length of the reflection mirror. Within the frequency range from 160 GHz to 260 GHz of the BWO used as a terahertz wave source, the experimental results show a relative error of frequency less than 3% and a spectral resolution better than 1 GHz. Furthermore, the system also has imaging ability. In this study, two kinds of carbon-fiber composites are imaged. The imaging results show that the resolution of the system is approximately 1 mm. Consequently, this type of optical system can be used in transmission materials for terahertz wave imaging. The method can be considered as a coherent imaging tool that can reveal the interior characteristics of the sample, and has widespread applications in terahertz imaging and sensing.

Reference
1Peiponen K EZeitler AKuwata-Gonokami M2012Terahertz Spectroscopy and Imaging2nd edn.New YorkSpringer294029–40
2Lu T LYuan HZhang J SZhang L LZhang C LZhao Y J2015Proceedings of International Optical Instruments and Technology April 17–19, 2015 Beijing, China962506
3Yang Z GZhao B QLiu J SWang K J2013Physics42708(in Chinese)
4Yang Y PYang Y HGrischkowsky D R2013Physics42712(in Chinese)
5Capasso FPaiella RMartini RColombelli RGmachl CMyers T LTaubman M SWilliams R MBethea C GUnterrainer KHwang H YSivco D LCho A YSergent A MLiu H CWhittaker E A 2002 IEEE J. Quantum Electron. 38 511
6Yokoyama SNakamura RNose MAraki TYasui T 2008 Opt. Express 16 13052
7Yasui TNakamura RKawamoto KIhara AFujimoto YYokoyama SInaba HMinoshima KNagatsuma TAraki T 2009 Opt. Express 17 17034
8Gaal PRaschke M BReimann KWoerner M 2007 Nat. Photon. 1 577
9Yasui TKabetani YSaneyoshi EYokoyama SAraki T 2006 Appl. Phys. Lett. 88 241104
10Morikawa OTani MFujita MHangyo M 2007 Jpn. J. Appl. Phys. 46 951
11Kokkonen KKaivola M 2008 Appl. Phys. Lett. 92 063502
12Deninger A JGöbel TSchönherr DKinder TRoggenbuck AKöberle MLison FMüller-Wirts TMeissner P 2008 Rev. Sci. Instrum. 79 044702
13Johnson J LDorney T DMittleman D M2000Appl. Phys. Lett.78835
14Naftaly MDean PMiles R EFletcher JMalcoci A 2008 IEEE J. Quantum Electron. 14 443
15Zhao JZhang L LLuo Y MWu TZhang C LZhao Y J 2014 Chin. Phys. 23 127201
16Zhang L LMu K JZhou Y SWang HZhang C LZhang X C 2015 Sci. Rep. 5 12536
17Hils BThomson M DLöffler TSpiegel WWeg CRoskos HMaagt PDoyle DGeckeler R 2008 Opt. Express 16 11289
18Wang XHou LZhang Y 2010 Appl. Opt. 49 5095
19Wang YZhao ZChen ZZhang LKang KDeng J 2011 Appl. Opt. 50 6452
20Sun WWang XZhang Y 2013 Optik-International Journal for Light and Electron Optics 124 5533
21Wichmann MStein MRahimi-Iman AKoch S WKoch M 2014 Journal of Infrared, Millimeter and Terahertz Waves 35 503
22Hecht EZajac A2002Optics4nd edn.San FranciscoAddison-Wesley519556519–56