Experimental research on spectrum and imaging of continuous-wave terahertz radiation based on interferometry
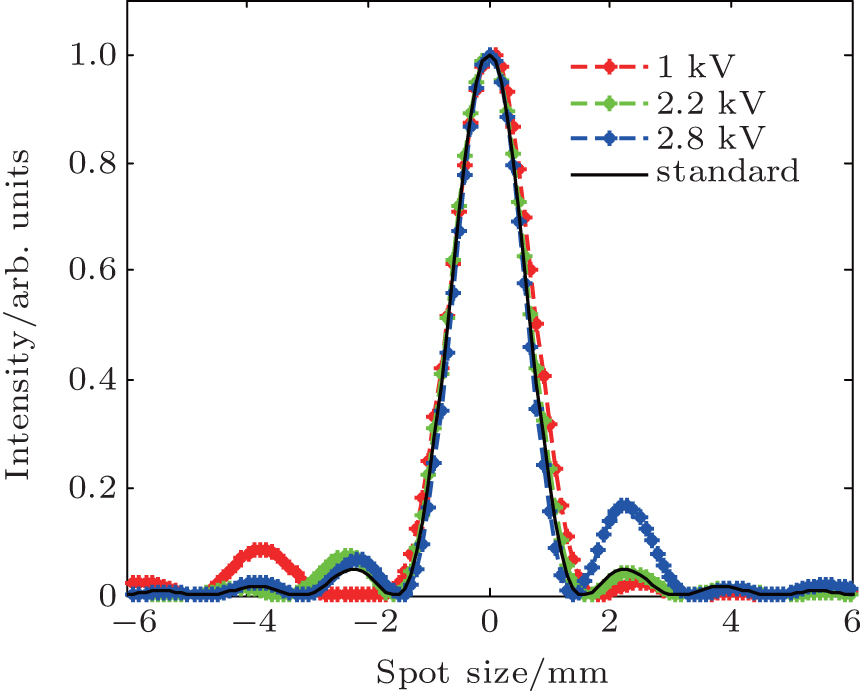
Energy density distribution curves of the terahertz source. The blue, red, and green dotted lines denote the measured results when the frequency was 160 GHz, 200 GHz, and 233 GHz, respectively.

