Experimental research on spectrum and imaging of continuous-wave terahertz radiation based on interferometry
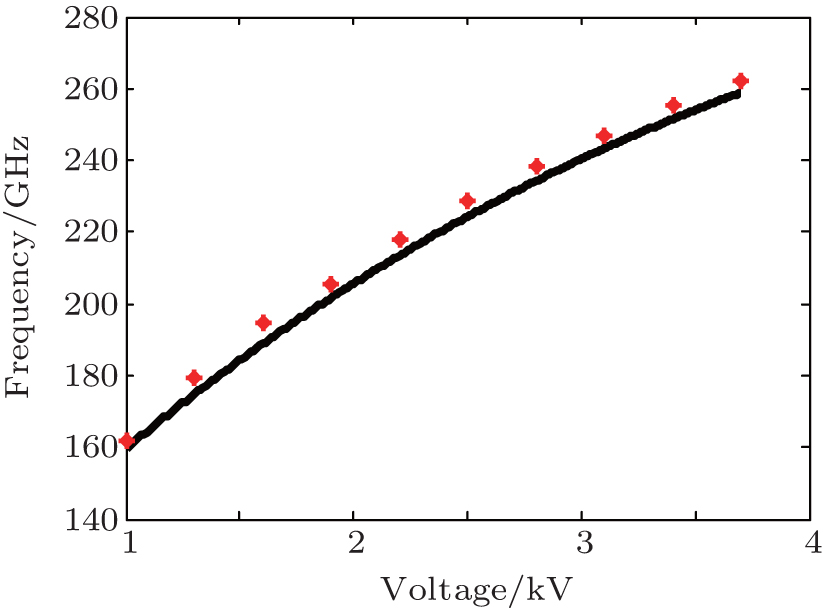
Curve of the calculated frequency (black line) compared with the experimentally measured results (red dots).

Experimental research on spectrum and imaging of continuous-wave terahertz radiation based on interferometry |
Curve of the calculated frequency (black line) compared with the experimentally measured results (red dots). |
 |