


Simulation of nanoparticle coagulation in radio-frequency C2H2/Ar microdischarges
[Liu Xiang-Mei†,  , Li Qi-Nan, Li Rui]
, Li Qi-Nan, Li Rui]
|
|


† Corresponding author. E-mail:
Project supported by the Natural Science Foundation of Heilongjiang Province, China (Grant Nos. A2015011 and A2015010), the Postdoctoral Scientific Research Development Fund of Heilongjiang Province, China (Grant No. LBH-Q14159), the Program for Young Teachers Scientific Research in Qiqihar University (Grant No. 2014k-Z11), the National Natural Science Foundation of China (Grant No. 11404180), and the University Nursing Program for Yong Scholars with Creative Talents in Heilongjiang Province, China (Grant No. UNPYSCT-2015095).
The nanoparticle coagulation is investigated by using a couple of fluid models and aerosol dynamics model in argon with a 5% molecular acetylene admixture rf microdischarges, with the total input gas flow rate of 400 sccm. It co-exists with a homogeneous, secondary electron-dominated low temperature γ-mode glow discharges. The heat transfer equation and flow equation for neutral gas are taken into account. We mainly focused on investigations of the nanoparticle properties in atmospheric pressure microdischarges, and discussed the influences of pressure, electrode spacing, and applied voltage on the plasma density and nanoparticle density profiles. The results show that the characteristics of microdischarges are quite different from those of low pressure radio-frequency discharges. First, the nanoparticle density in the bulk plasma in microdischarges is much larger than that of low pressure discharges. Second, the nanoparticle density of 10 nm experiences an exponential increase as soon as the applied voltage increases, especially in the presheath. Finally, as the electrode spacing increases, the nanoparticle density decreased instead of increasing.
Microdischarges (MDs) have become the subject of considerable research due to their wide range of possible applications in materials treatment and modification, plasma display panels, radiation sources, microsatellite propellers, and in biomedical and environmental applications.[1,2] Among those applications, the microdischarges showed unique properties, such as highly energetic electrons, non-equilibrium, and different discharge structure characteristics. A stable non-equilibrium plasma at length scales ranging from μm to mm is the most remarkable advantage of MDs, where the plasma quenching effects usually exist. In order to overcome plasma quenching effects, MDs rely on high gas pressure ranging from 100 Torr (1 Torr = 1.33322 × 10² Pa) to 1 atm (1 atm = 1.01325 × 10⁵ Pa), thus the low breakdown or sustained voltages of a few hundred volts is achieved.[3] Due to the various technological implications of MDs, high-pressure small-scale plasmas become increasingly important. To this effect, a fundamental understanding of the characteristics of atmospheric pressure plasmas and microplasmas is obviously crucial. By experimental measurements and computer simulations,[4–8] several attempts have been made to describe the microplasmas in atmospheric capacitively rf discharges. Babayan et al.[4–6] investigated the atmospheric pressure helium rf microdischarges, which are operated at gas temperatures below 100 °C. The results showed that a high density of reactive species is generated and a stable capacitive discharge is produced, which are suitable for the downstream processing of substrates. Iza et al.[7,8] demonstrated non-equilibrium characteristics and the highly energetic electrons effects in rf microdischarges. By using DC discharge model, Economou and Radjenovic et al.[9,10] investigated the breakdown voltage versus pd scaling, and observed that the cathode layer (sheath) classical scaling law does not apply. Lee et al.[11,12] presented two operating modes, α and γ, in atmospheric pressure capacitive discharges, which depends on the dominant ionization process. In γ discharge, the plasma is sustained by secondary electron emission, while in the α discharge, it is sustained by bulk ionization. They showed that the changes of input power and ultra-high frequency are the major causes for the α–γ mode transition.
The behaviors of inert gases, such as Ar and He, are relatively well understood in MDs, but the reactive gases discharge characteristics, such as the C2H2/Ar, SiH4/Ar, and C2H2/Ar/H2 discharge properties are still elusive so far. First, reactive gases discharges can yield highly polymerized ions, and these hydrocarbon–gas mixtures tend to produce dust particles, which will cause structural voids, dislocations, and film delamination which ultimately lead to malfunctioning devices.[13,14] Second, reactive gases discharges are widely used in microelectronics manufacturing and photovoltaic cells.[15,16] Therefore, a detailed investigation of the microplasma species densities, such as electrons, ions, molecules, radicals as well as nanoparticles, together with a comprehensive understanding of their behavior in reactive gases discharge are very necessary. In MDs, with micrometer and submillimeter gaps, the gas pressure is usually very high, thus the secondary electron plays an important role in sustaining the discharge, which is quite different from the low-pressure discharge. Furthermore, the simple parallel-plate configuration instead of the special microhollow electrodes or pin electrodes configurations is found to be sufficient to produce plasma.[17] In this study, we focus our interest on the influence of pressure, power, and gas flow on the nanoparticle formation and growth mechanisms in a C2H2/Ar microplasma, where Ar accounts for the vast majority to generate a stable non-equilibrium plasma. In capacitively coupled MDs, the plasma density can be very high and the large-aperture uniform plasma can be obtained, which can be useful in processing.
The structure of this article is as follows. A description of the fluid model and the aerosol physics model are briefly surveyed in Section 2, and the formation, transport, and growth mechanism for nanoparticles are also elaborated. In Section 3, the MDs parameters effects on the plasma and nanoparticles characteristics are carefully discussed. Finally, a short conclusion is described in Section 4.
In the discharge we considered here, 57 different species and hundreds of chemical reactions must be introduced. Moreover, the nanoparticles are formed by coagulation, thus the particles are relatively small in comparison with the particles formation by other means, for example by introducing externally. Therefore, the fluid model is used to describe the particle formation and growth by nucleation to further growth by agglomeration via a coupling to the aerosol dynamics model.[18,19] In this one-dimensional (1D) fluid model, the continuity balances equations are taken into account to describe the electrons, ions, radicals, and molecules mass density, the momentum equations for electrons, ions, and radicals can be estimated by the drift-diffusion approximation. However, ions’ masses are much larger than the electrons’, hence the effective electric field is introduced to follow the inertia effects. For neutral gases, the momentum balance equation for axial mass-averaged velocity is introduced to describe the neutral reacting flow. The electrons and neutral gases energy balance equations are introduced to solve the electron temperature and neutral gas temperature. No energy balance equation is included for ions, since the ion pressure plays only a minor role in the momentum equation, the ion temperature is assumed to be a constant. Finally, the Poisson equation is coupled to the particle’s balance equations, making the model fully self-consistent.
For every electron-neutral collision the electron mobility and diffusion coefficients, as well as the reaction rate coefficients as a function of the average electron energy, are obtained from the electron energy distribution function (EEDF). However, the EEDF is computed from the Boltzmann equation in a two-term approximation. Table
| Table 1. Electron impact collisions reactions and the corresponding threshold energies. . |
The growth of small gas molecule species to larger molecules which consist of hundreds of atoms are mainly dealt with by the nucleation module.[14] The starting point of nanometer-sized dust grains’ formation in acetylene-based plasmas appears to be C12H− and 


The larger anions C12H− and

Nanoparticles immersed in a plasma affected by five different forces, including neutral drag force


In the coagulation phase, the particles’ size generally increases in time from several nanometers to tens of nanometers, and the particles’ density sharply decreased.[7] To this effect, aerosol physics is considered as a good technique for the investigation of coagulation and an excellent assumption for the conditions of interest is used. In this model, the nanoparticle density n(v) in a volume range (v, v + dv) is investigated by the general dynamic equation
In this article, to investigate the behaviors of a nanoparticle in MDs, a 13.56-MHz radio-frequency source with the peak voltage of 100 V is applied to the upper showerhead electrode, and the lower electrode is grounded. In this rf MDs, the plasma is sustained by the secondary electron emission (SEE), where the secondary electron emission coefficient depends on the state of the electrode surface, the kind of particle, the particle energy which impacts on the electrode, and the electrode material. We investigated the effects of different secondary electron emission coefficients on the plasma parameters, and observed that SEE coefficients almost have no special effects on the absolute values of the results. Thus, the SEE coefficient is assumed to be γse = 0.1. We set the total input flow rate at Ftot = 400 sccm, with 5% mole fraction of acetylene at 20 sccm. The gas pressure ratio of Ar: C2H2=19:1. The ion temperature Tion = 400 K and the initial electron temperature Te = 3 eV. The gas distance between two parallel plate electrodes varies from 100 μm to 1000 μm. The gas pressure is in the range of 100 Torr–760 Torr, while the voltage varies from 100 V to 300 V. In this model, the time-step of an RF (13.56 MHz) cycle is set to be 7.4 × 10⁻¹³, and the space-step is 5 × 10⁻⁶ m. To speed up the calculation, the time-step for describing the neutral–neutral chemistry is 100 times larger than the RF cycle, while the dust particles’ time-step is equal to 7.4 × 10⁻⁹.
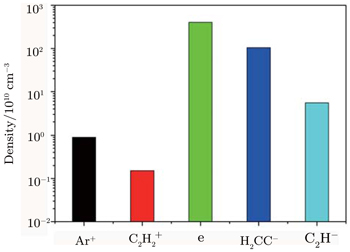
Figure Based on Moravej,[20] the ionization coefficient for argon is Acetylene is reactive gas, which will generate a great number of positive ions, around 17 positive ions are taken into account in this paper.


 | Fig. 1. The positive ions, negative ions and electron density obtained from our simulation, with V = 100 V, P = 600 Torr, L = 1000 μm. |
In acetylene discharges, 
The spatial profiles of the electron temperature (Te), the ionization coefficient (kr) for Ar, and the dissociative ionization coefficient (kdi) for C2H2 are displayed in Fig. 

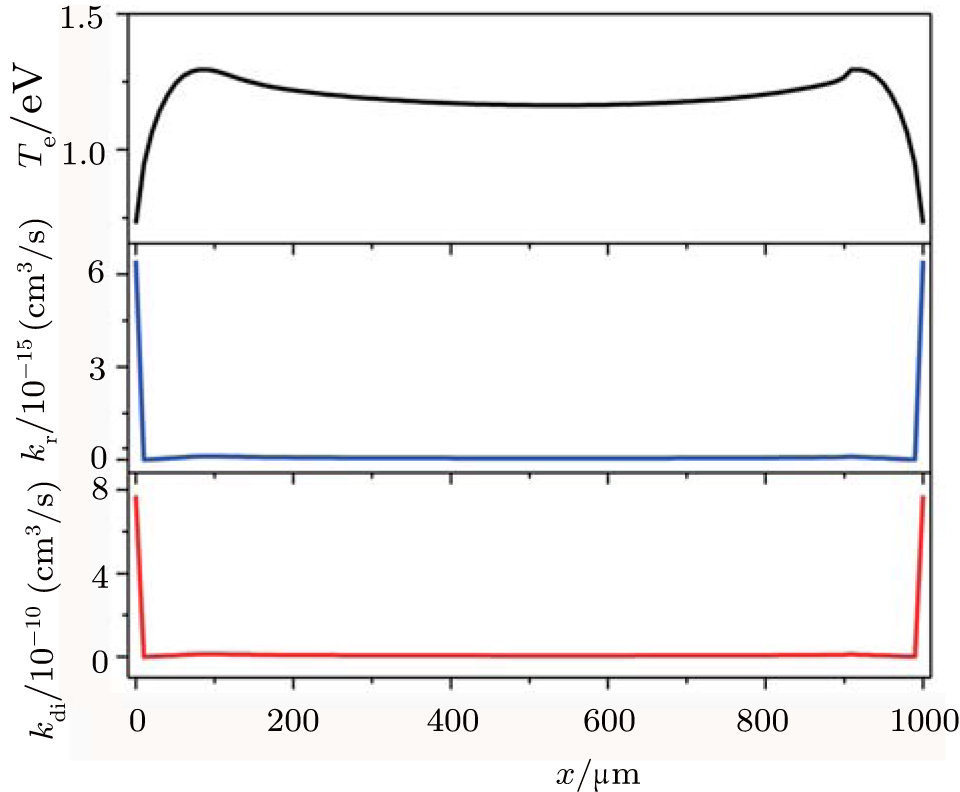 | Fig. 2. The spatial variation profiles of the electron temperature (Te) and the ionization coefficient (kr) for Ar, as well as the dissociative ionization coefficient (kdi) for C2H2, with the settings the same as those in Fig. |
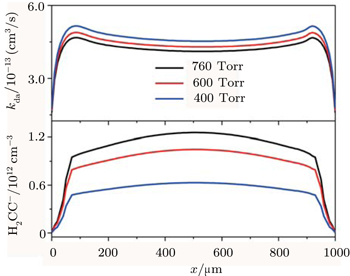
Figure
 | Fig. 3. The spatial variation profiles of the negative ion (H2CC−) and the corresponding attachment coefficient kda at different gas pressure, with P = 400, 600, and 760 Torr. |
The effect of gas pressure on the nanoparticles’ density nd is plotted in Fig.
 | Fig. 4. The spatial variation profiles of the nanoparticle number density nd at different gas pressure, with the settings the same as those in Fig. |
Figure
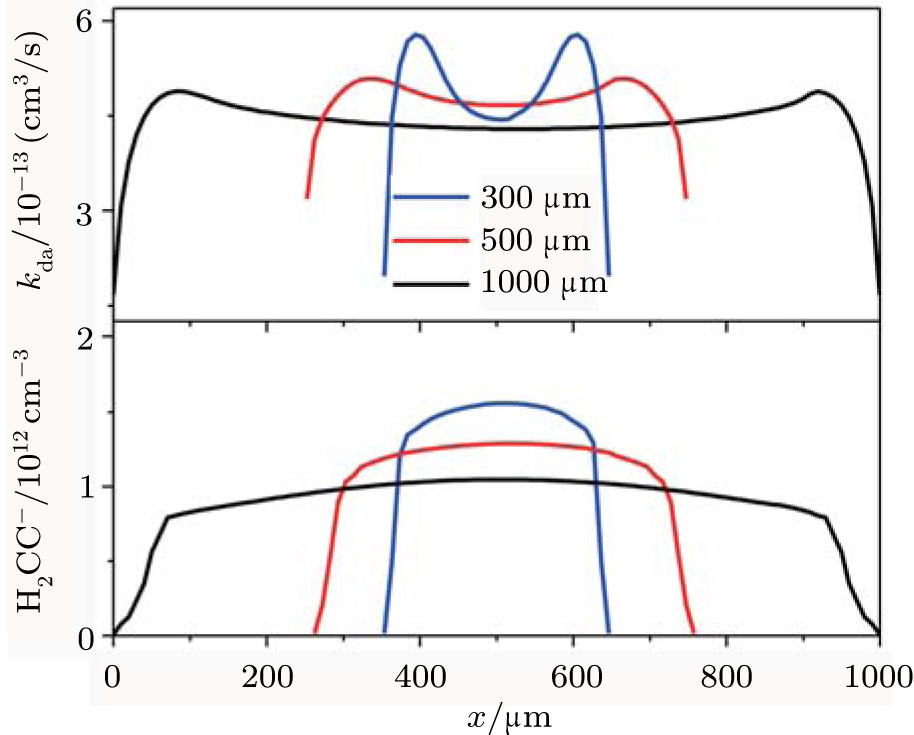 | Fig. 5. The spatial variation profiles of the negative ion (H2CC−) and the corresponding attachment coefficient kda at different electrode spacing, with L = 300, 500, and 1000 μm. |
Figure
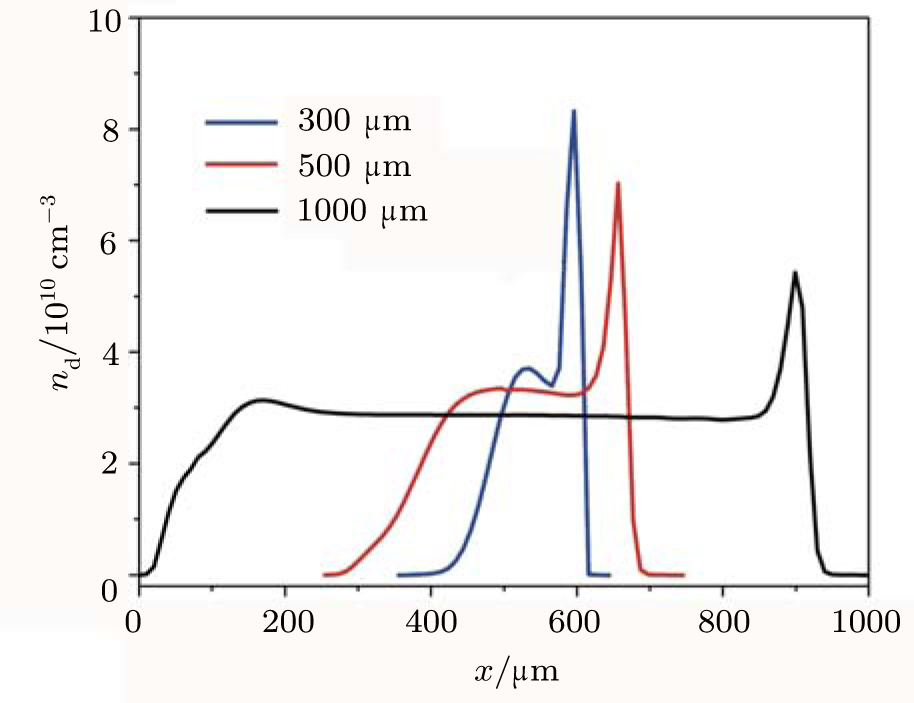 | Fig. 6. The spatial variation profiles of the nanoparticle number density nd at different electrode spacing, with the settings the same as those in Fig. |
Figure
 | Fig. 7. The spatial variation profiles of the negative ion (H2CC−) and the corresponding attachment coefficient kda at different applied voltage, with V = 100, 200, and 300 V. |
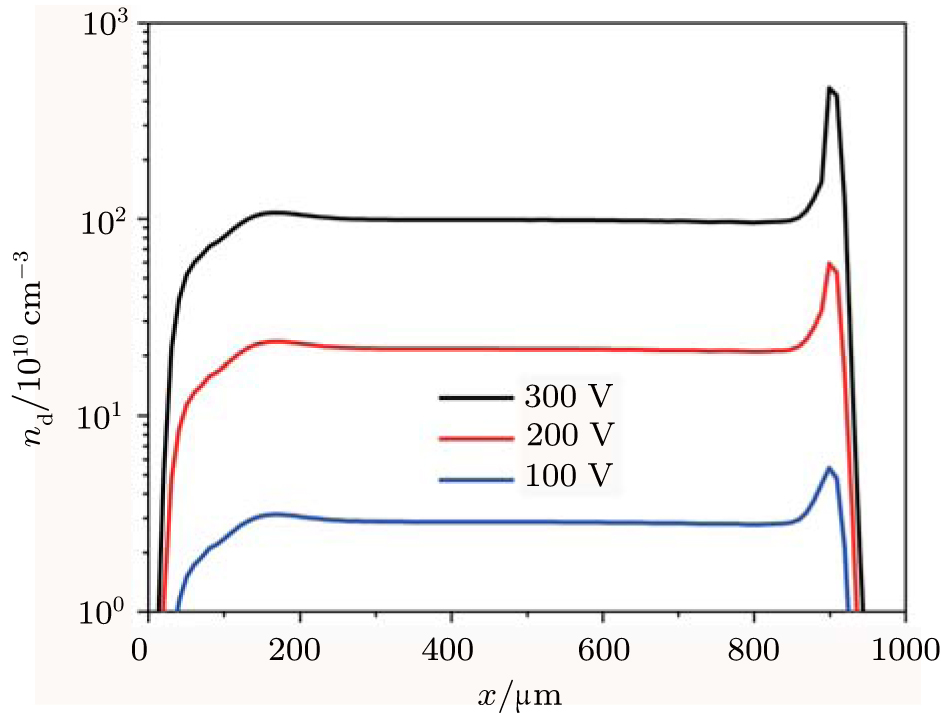 | Fig. 8. The spatial variation profiles of the nanoparticle number density nd at different applied voltage, with the settings the same as those in Fig. |
The behavior of nanoparticles in atmosphere microdischarges is carefully investigated by using a self-consistent coupling between an aerosol dynamics model and one-dimensional hydrodynamic model. In these MDs, the neutral flow cannot be ignored since the thermophoresis force has a great impact on the distribution of nanoparticle density. Thus, the flow equation and heat transfer equation for neutral gas are carefully investigated. From the standard model, it was found that the secondary electron emissions play a leading role in sustaining discharge.
In this article, the effects of pressure, electrode spacing, and applied voltage on the plasma density and nanoparticle density were studied. We noticed that increasing the electrode spacing, the H2CC− density and nanoparticle density decreased instead of increasing, under the influences of secondary electron emissions. However, the pressure has a relatively smaller impact on the nanoparticle density. We have, in particular, discussed the role of applied voltage on the nanoparticle density, particle size of 10 nm. By varying the applied voltage between 100 V and 300 V, the nanoparticle density increased nearly two orders of magnitude. Hence, the applied voltage can be a very important parameter that can strongly influence the nanoparticle properties, even at moderate voltage differences of 100 V or more.
| 1 | |
| 2 | |
| 3 | |
| 4 | |
| 5 | |
| 6 | |
| 7 | |
| 8 | |
| 9 | |
| 10 | |
| 11 | |
| 12 | |
| 13 | |
| 14 | |
| 15 | |
| 16 | |
| 17 | |
| 18 | |
| 19 | |
| 20 |