†Corresponding author. E-mail: mengjun@iphy.ac.cn
‡Corresponding author. E-mail: chenxs@itp.ac.cn
*Project supported by the Major Projects of the China National Social Science Fund (Grant No. 11 & ZD154).
The concept of smart city gives an excellent resolution to construct and develop modern cities, and also demands infrastructure construction. How to build a safe, stable, and highly efficient public transportation system becomes an important topic in the process of city construction. In this work, we study the structural and robustness properties of transportation networks and their sub-networks. We introduce a complementary network model to study the relevance and complementarity between bus network and subway network. Our numerical results show that the mutual supplement of networks can improve the network robustness. This conclusion provides a theoretical basis for the construction of public traffic networks, and it also supports reasonable operation of managing smart cities.
Complex networks have become a standard framework in the study of complex systems over the last decades.[1– 4] The macroscopic properties of complex networks emerge from the interactions among individual constituents. Many systems of interest to scientists can be regarded as networks, for example, Internet, World Wide Web, and neural networks. Understanding and modeling the behavior of real-world networked systems is the essence of network sciences. Observational data are the starting point for essentially all the developments of this field. A network, also called a graph in the mathematical literature, is a collection of vertices joined by edges. Vertices and edges are also called nodes and links in computer sciences, and sites and bonds in physics. There are some basic theoretical tools used to describe and analyze networks, most of which come from the graph theory. Degree distribution, path, and components are the most fundamental quantitative foundations of the network studies.
The provision of good public transportation network (PTN) is necessary for the development of politics and economy, culture and education, science and technology in a city, and it also plays an important role in the construction of cities. A mature traffic network is an efficient solution to the problem of heavy traffic in many cities. In this work, we use network theory to study the structural and robustness properties of PTN. We introduce a complementary network model to investigate the relevance and complementarity between the bus network and subway network.
There are three types of networks in our model: the single bus-line network, single subway-line network, and the interdependent network. Most of the networks have at most a single edge between any pair of nodes. However, in some rare cases, there can be more than one edges between one pair of vertices, and we refer to those edges collectively as a multi-edge. Edges that connect vertices to themselves are called self-edges or self-loops. A network with multi-edges is called a multigraph (Fig. 1). The interdependent network of PTN is similar to the interdependent networks introduced by Buldyrev et al.[5] Moreover, in addition to interdependence, the two subnetworks (bus-line and subway-line networks) of PTN also have complementary properties, which will be discussed in the following paragraph.
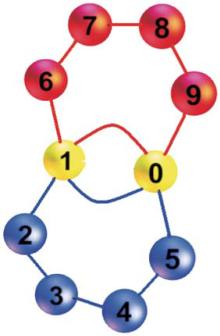 | Fig. 1. Sketches of multigraph. There are two connected edges between nodes 0 and 1. If one edge is attacked, the other one can still work. |
To consider the complementarity of an interdependent network, we name for simplicity its two sub-networks: A and B, whose node numbers are, respectively, NA and NB. Figure 2 shows the removing-nodes process of a complementary PTN network. Every node in the two sets represents a station in a city, and if two nodes in different sets are geographically close to each other, they are then connected by dashed lines in Fig. 2. If network A is attacked, then some nodes in A can not be reached from each other; however, owing to the complementarity between the two networks, network B serves a supplement to A, and those nodes in A can be reached to each other through B. The effectiveness of the traffic system is thus greatly improved.
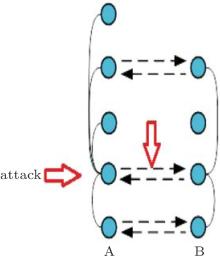 | Fig. 2. Illustration of a complementary network. Links between subnetworks are shown as horizontal straight dashed lines with arrowhead. A-links and B-links are shown as arcs. |
There are a number of mathematical parameters to describe a network. Here, we mainly focus on the size of the largest component S and the average shortest path l. Technically, a component is a subset of the vertices of a network such that there exists at least one path from each member of that subset to each other member. An interesting characteristic of the network ensemble is that many of its properties have a related threshold function, such that the property exists in the “ thermodynamic limit” . This phenomenon is the same as the physical concept of a percolation phase transition. An example of such a property is the existence of a giant component, i.e., a set of connected nodes, in the sense that a path exists between any two of them, whose size is proportional to system size. The words “ giant component” have a specific meaning in the network theory and are not precisely synonymous with “ largest component” . Here, we define S as the size of the largest component.
A path in a network is a sequence of vertices such that every consecutive pair of vertices in the sequence is connected by an edge in the network. The distance between two nodes in the network is defined as the number of edges in the shortest path between them. Consider a graph G with the set of vertices V. Let d(v1, v2) denote the shortest distance between v1 and v2. Assume that d(v1, v2) = 0 if v2 cannot be reached from v1. Then, the average path length l is

where n is the number of nodes in G.
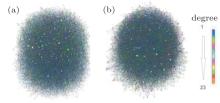
We proceed to study the complementary PTN networks of Beijing city and Guangzhou city, which have 6704 stations and 1337 traffic lines, and 6654 stations and 1450 lines, respectively, as shown in Fig. 3. We will investigate how their S and l change as nodes/edges are removed.
There are two strategies to destroy a network. One is to remove the nodes (stations), the other is to remove edges (lines). For each strategy, there are two ways to remove the nodes/edges, removing randomly or by deliberate attack; and the corresponding robustness of the network is named as error tolerance and attack tolerance, respectively.
To address the error and attack tolerance of the networks, we study the changes of l and S for every node or edge removed. Firstly, we simulate the node removing process of subway network, the data are obtained from Beijing city and Guangzhou city. When nodes are removed from a network, the components of nodes whose links to the system disappear may be cut off (fragmented) from the main component. In the following, we investigate this fragmentation process and give the simulation results.
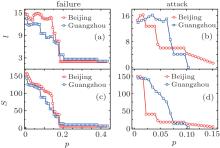
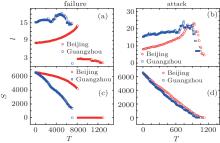
Figure 4 shows the fragmentation of the Beijing and Guangzhou subway networks under random failures and (deliberate) attacks of nodes. For the random failures of node process, We find that l and S decrease with the increase of p, and undergo sudden changes at the “ phase transition point” p ≈ 0.2. However, for the attack process, we observe a drastically different behavior: the network collapses after several steps. To simulate an attack, we first rank all nodes by their degrees and then preferentially target the most connected nodes one by one; we find that, when the most connected nodes are eliminated, l and S decrease rapidly. This vulnerability to attacks is rooted in the sparseness of connectivity distribution.[9]
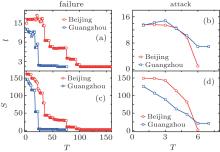
Figure 5 shows subway network fragmentation under random failures and attacks of edges(subway lines) of Beijing and Guangzhou. Compared to the node removing processes, here, time steps T is used instead of p. In the random failure process, at each time step, one edge is randomly selected and removed. However, in the attack process, we rank the subway lines by the number of stations they have and then attack the whole line with the highest ranking rather than one edge. Therefore, for every attack, usually more than one edges are removed. We can see from Fig. 5 that l and S decrease with the increase of T.
We can see from Figs. 4 and 5 that the stability of the subway networks is weaker in the attack process for both the node and edge removing cases. And we find that the random failure process leads to a percolation phase transition, which seems to be a “ second-order” phase transition, because in the phase diagrams (Figs. 4 and 5) the order parameter S is approximately continuous.
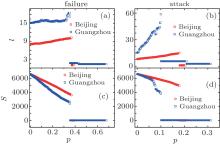
Next, we investigate the dynamical structure and the robustness of the transportation network consisting of both subway and bus networks.[10– 15] In particular, we are interested in when the associated percolation may occur and whether it is continuous or discontinuous.[16] As previously described, we study the changes of l and S for every node or edge removed on the transportation networks. Figure 6 shows the transportation network fragmentation under random failures and the attacks of nodes of Beijing and Guangzhou; and figure 7 shows the case of fragmentation under random failures and attacks of edges. It is worthy to mention again that one edge is randomly selected and removed for the failure process of edges and that in the attack process a whole traffic line is removed according to the rank of the number of stations it has.
From Figs. 6 and 7, we find that l usually increases with p and T. This phenomenon is quite different from what is seen in the subway network. The reason of the difference is as follows. The interconnectedness of a network is described by its diameter l, defined as the average length of the shortest paths between any two nodes in the network. The diameter characterizes the ability of two nodes to communicate with each other: the smaller l is, the shorter the expected path between them is. For a dense network, when some nodes or edges are removed, the distance l between any two nodes could increase, because some paths may be destroyed.
We now discuss the changes of S in the transportation network. We can see from Figs. 6 and 7 that except for the attacking-edges process S decreases with p and T and has a sharp discontinuous gap at some point. Namely, the size S exhibits a first-order phase transition. For the attacking-edges process, S is a continuous function and decays algebraically with T.
Networks are in almost all aspects of our life. Based on the network theory, we study the structural and robustness properties of the transportation network, which is one of the most important infrastructure construction in our cities. Apart from the single layer network, to model our real world, a complementary network model is introduced. Using the empirical data, four strategies are adopted to simulate the stability, efficiency, and robustness of our model. Based on the studies on the average path length l and the largest component S of the networks, we find that there exist continuous phase transition in singe network model (subway network) and discontinuous phase transition in our complementary network model (the transportation network). Our results is helpful to the construction of a safe, stable, and highly efficient smart-city transportation system.
We thank Ou-Yang Zhong-Can, Zhou Xin, Meng Fan-Long, Zhang Xue-Jun, and Lu Yu-Kun for helpful discussion.
| 1 |
|
| 2 |
|
| 3 |
|
| 4 |
|
| 5 |
|
| 6 |
|
| 7 |
|
| 8 |
|
| 9 |
|
| 10 |
|
| 11 |
|
| 12 |
|
| 13 |
|
| 14 |
|
| 15 |
|
| 16 |
|
| 17 |
|
| 18 |
|
| 19 |
|
| 20 |
|
| 21 |
|
| 22 |
|


