Re effects in model Ni-based superalloys investigated with first-principles calculations and atom probe tomography
Wang Dianwu1, Wang Chongyu1, 2, †, Yu Tao1, Liu Wenqing3
Central Iron and Steel Research Institute, Beijing 100081, China
Department of Physics, Tsinghua University, Beijing 100084, China
Key Laboratory for Microstructures, Shanghai University, Shanghai 200444, China


† Corresponding author. E-mail: cywang@mail.tsinghua.edu.cn

Project supported by the National Key Research and Development Program of China (Grant No. 2017YFB0701503).

Abstract

The phase partition and site preference of Re atoms in a ternary Ni–Al–Re model alloy, including the electronic structure of different Re configurations, are investigated with first-principles calculations and atom probe tomography. The Re distribution of single, nearest neighbor (NN), next-nearest neighbor (NNN), and cluster configurations are respectively designed in the models with γ and γ′ phases. The results show that the Re atoms tend to entering γ′ phase and the Re atoms prefer to occupy the Al sites in γ′ phase. The Re cluster with a combination of NN and NNN Re–Re pair configuration is not preferred than the isolated Re atom in the Ni-based superalloys, and the configuration with isolated Re atom is more preferred in the system. Especially, the electronic states are analyzed and the energetic parameters are calculated. The electronic structure analyses show there exists strong Ni–Re electronic interaction and it is mainly contributed by the d–d hybridization. The characteristic features of the electronic states of the Re doping effects are also given. It is also found that Re atoms prefer the Al sites in γ′ side at the interface. The density of states at or near the Fermi level and the d–d hybridizations of NN Ni–Re are found to be important in the systems.

1. Introduction

Ni-based superalloys are widely used as high-temperature materials in aircraft and land-based engine turbines due to their excellent material properties, such as thermal and mechanical properties.[1] The Ni-based superalloys comprises the face centered cubic (FCC) solid solution γ-Ni matrix phase and the L12-ordered γ′-Ni3Al phase. The high temperature strength of single crystal Ni-based superalloys can largely be attributed to γ and γ′ phase properties along with the properties of γ/γ′ interfaces.[2,3] Many alloying elements, such as Re, W, Ta, Ru, Mo, Cr, Co, Hf, are added into Ni-based superalloys to improve creep rupture life, strength, phase stability, oxygen resistance and so forth. Among the alloying elements, Re is a potent strengthener in Ni-based superalloys and plays an important role in improving the mechanical properties.[4,5] The so-called “rhenium-effect”, which was first discovered by Giamei and Anton,[6] means that the mechanical properties of Ni-based superalloys becomes better with a proper amount of Re addition. The effect of Re on improving mechanical properties can be explained from many aspects. It is found that Re can lower γ′ phase coarsening rate as well as resulting in a negative γ/γ′ misfit.[6,7] The synergistic effect of Re with other elements contributes to the strength of Ni-based superalloys.[810] Liu and Wang[11] studied the dislocation-doping complex in γ phase of Ni-based superalloys using lattice Green-function multiscale method. According to their study, the strengthening effect of Re can be attributed to the partitioning of Re in γ phase and its strong chemical interactions with dislocation.

In 1980 s, Blavette et al.[5] observed Re segregation to γ matrix and found Re-enriched region in the Ni-based superalloy using an atom probe field ion microscopy (FIM). Their results confirmed short range order of Re atoms in γ matrix phase. The observed Re clusters can act as obstacles for dislocation motion and can improve the creep strength. Wanderka and Glatzel[12] analyzed the second generation Ni-based superalloy CMSX-4 using atom probe field ion microscopy, and they found that Re atoms mainly form in γ phase and have a tendency to form clusters. They proposed that Re is likely to form cluster with roughly 5 atoms. Rüsing[13] studied the Re cluster using three-dimensional atom probe method and concluded that Re can form clusters with the size of approximately 1 nm. The molecular dynamics simulation and first-principles calculation results of Zhu et al.[14] showed that Re atoms tend to form clusters in both γ′ phase and γ phase, and the smallest Re cluster has a radius of 12.2 Å. Mottura et al.[15] found that Re–Re nearest neighbor pair has strong repulsion and Re atoms do not form clusters in γ phase by first-principles calculations. They also concluded that the so-called “rhenium-effect” cannot be the result of Re clustering and proposed that single Re atom is responsible for the strengthening effect. Lu et al.[16] calculated the binding energy of Re–Re pairs, and the study showed that the second nearest neighbor Re–Re pair in γ-Ni phase is more stable under 0 K. Ding et al.[17] studied the origin of Re effect on improving the mechanical properties of Ni-based superalloys. They demonstrated that the Re atoms tend to form Cottrell atmosphere at the interfacial dislocation core and stabilize the interfacial dislocation networks. The Re effect is the result of interaction between the local strain caused by Re and the strain caused by dislocations.

Until now, there is no commonly accepted view in whether the Re atoms form cluster or not in the Ni-based superalloys. What is more, the previous studies only considered the model of γ phase or γ′ phase in studying the Re distribution behaviors. The Ni-based superalloys contain two phases, and a model that can incorporate both γ and γ′ phases would be more realistic in studying the Re distribution. In this paper, we study different kinds of Re atom configurations across the γ/γ′ interface and analyze their energetics and electronic structures.

2. Computational models and experimental details
2.1. The models for the calculation of electronic structures

The γ′-Ni3Al separate out from the Ni-matrix and the usual precipitate directions are 〈001〉 directions. The interface structure and composition had been studied by several authors. The previous studies of Zhu and Wang et al.[14,18] indicate in general the γ/γ′ interface comprises a coherent interface region and a misfit dislocation region after sufficient relaxations. The interface width of Ni-based single crystal superalloys is found to be about 1 nm–3 nm from the experiment.[1921] The order–disorder transition width is smaller than the chemical element transition width.[19] We adopt the coherent γ/γ′ interface in the calculations. The model adopted in this work is shown in Fig. 1. The lattice orientations are [110], [], [001] in x, y, and z directions, respectively and the γ/γ′ interface lies in (001) plane. The model contains 7 layers of L12-Ni3Al and 7 layers of FCC-Ni along the [001] direction. A 12-Å vacuum layer is added in [001] direction. For electronic structure calculations, the model is periodic in x, y, and z directions and contains 392 atoms. The outermost one layer of atoms closest to the vacuum is restricted to move in the [001] direction during the atomic relaxation. The region enclosed in the dashed line denotes the interface region.

Fig. 1. Model with γ/γ′ interface. Black atoms are Al atoms, and gray atoms are Ni atoms.

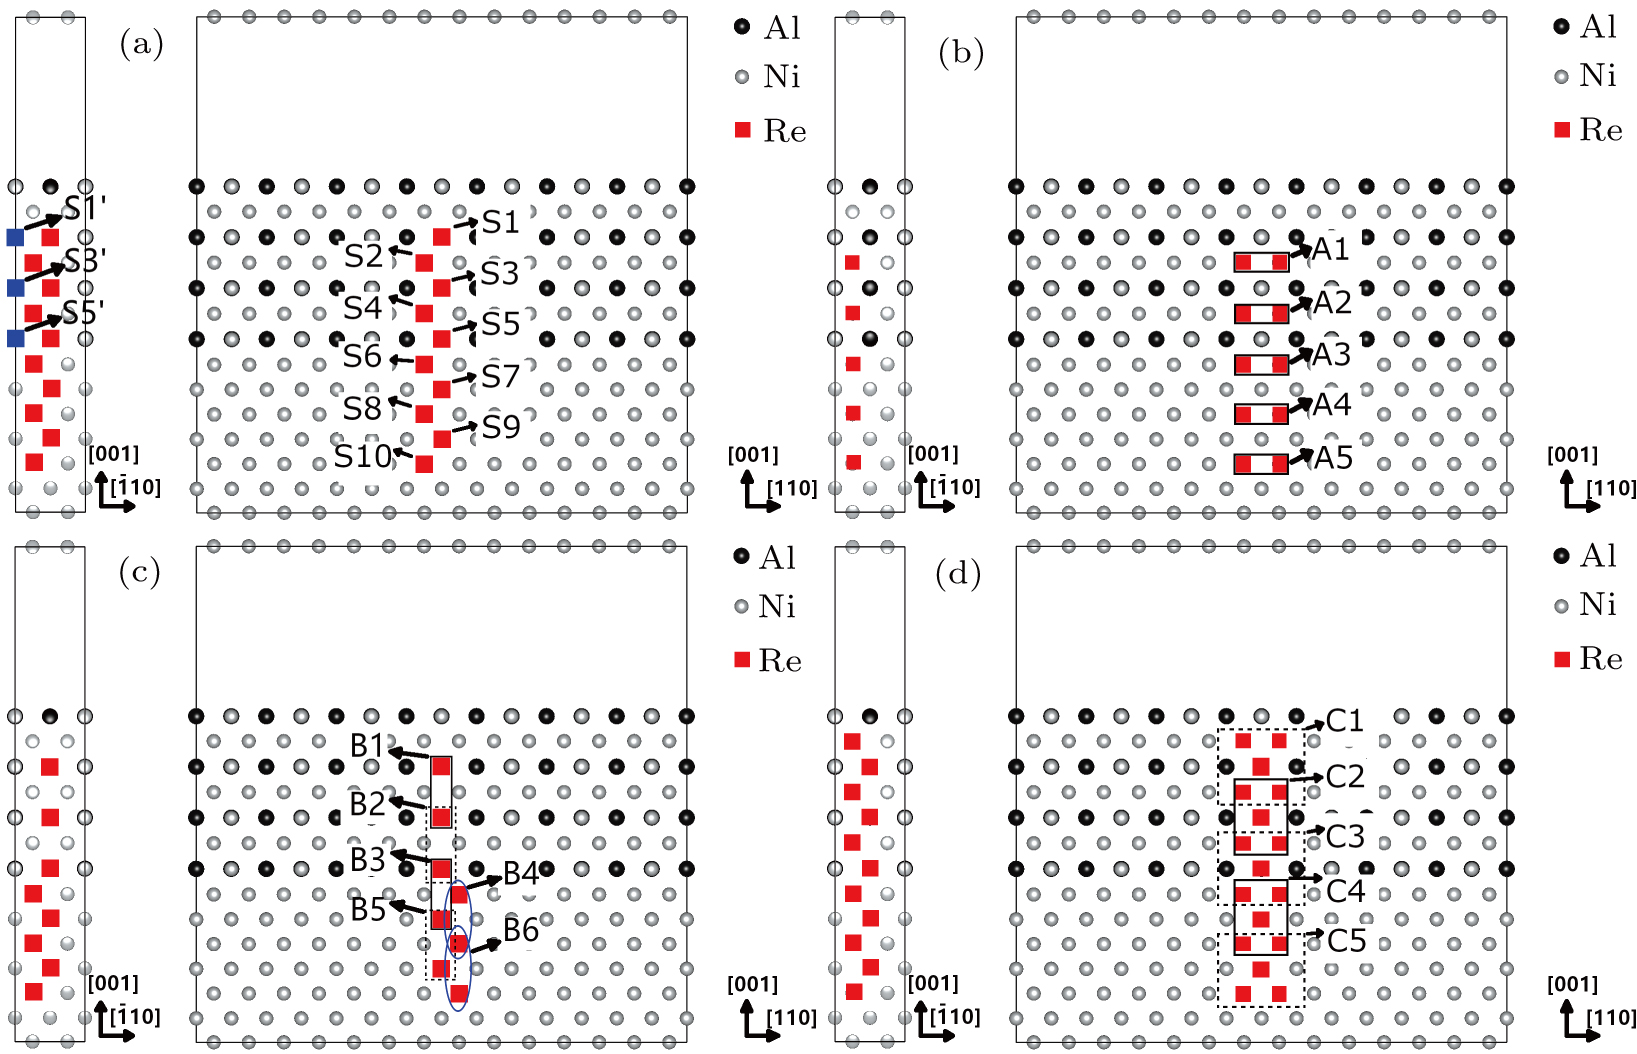
For the purpose of studying the Re distribution in γ and γ′ phases, the different Re atom configurations are designed to occupy the sites of Ni and Al atoms in the systems (cf., Fig. 2). We consider the case of doping Re atoms into the system with single Re atom, nearest neighbor (NN) Re atoms, next nearest neighbor (NNN) Re atoms, and Re clusters. The system with Re cluster has 5 Re atoms and is the combination of NN and NNN Re atom configurations (cf., Fig. 2(d)). The systems with 5 Re atoms, which correspond to a Re concentration of ∼ 1 at.%, are used to represent the Re clusters across the γ/γ′ interface. Four of the Re atoms are in the same () plane and they possess the face center positions in both γ′-Ni3Al and γ-Ni phases, the remaining one Re atom possesses the corner position in both γ′-Ni3Al and γ-Ni phases and it is the nearest neighbor of the other four Re atoms.

Fig. 2. Models with Re atoms: (a) single Re configurations; (b) NN Re–Re configurations; (c) NNN Re–Re configurations; (d) Re cluster configurations. S1–S10 denotes ten different single Re atom systems, each system contains one Re atom. The S1′, S3′, and S5′ models are the Re atoms occupying the Ni sites in γ′ phase; A1–A5 denote five different NN Re–Re pair systems, each system contains two Re atoms; B1–B6 denote six different NNN Re–Re pair systems, each system contains two Re atoms; C1–C5 denote five different Re cluster systems, each system contains five Re atoms.

For all the models in current research, ionic relaxation and self-consistent electronic structure relaxation are performed using the Vienna ab-initio simulation package (VASP) code,[22] which is based on density functional theory (DFT).[23,24] The ion–electron interaction is described by projector augmented wave (PAW),[25,26] and the generalized gradient approximation of Perdew–Burke–Ernzerhof (PBE)[27] exchange–correlation functional is used. The plane-wave cutoff energy is set to 350 eV. The convergence criterions for electronic and ionic step in the self-consistent calculations are 10−6 eV and 0.02 eV/Å, respectively. Spin-polarized calculations are not used. The integration over the Brillouin zone is performed using the 1 × 7 × 1 Monkhorst–Pack k-point mesh.[28]

2.2. Atom probe experiment

Based on the ternary alloy designed by our group, the Ni–Al–Re model alloy is prepared to investigate the partitioning behavior of Re atom in γ and γ′ phases. The alloy is melted with the vacuum induction technique and is then directionally solidified to produce the 〈001〉-oriented single crystal. After the single crystal sample is prepared, it will perform the systematic heat treatment to obtain a near-equilibrium state alloy with γ and γ′ phases. The chemical analysis result of the ternary model alloy is Ni-7.95Al-4.94Re (wt%).

Atom probe tomography (APT) experiment is conducted to analyze the Re concentration in the model alloy. The APT specimen is wire-electrode cut from the heat-treated specimen into the dimension of 0.5 mm ×0.5 mm × 15 mm and is subjected to a standard two-step electro-polishing procedures.[29] The specimen temperature is ∼ 50 K. Proximity histogram (proxigram) methodology[30] is adopted to determine the concentration information.

3. Results and discussions
3.1. Energetic parameters of systems

The substitution formation energy (Esubst) is defined as follows:[8]

where and denote the total energies of the systems with and without doping atoms, respectively. M denotes the atoms being substituted (Ni or Al atoms), ni and nX denote the number of M atoms and number of X (X = Re) atoms, respectively. μi and μX denote chemical potentials of M atom (Ni or Al atom) and X (X = Re) atom, respectively. The chemical potential of Al atom is calculated as μAl = μNi3Al – 3μNi.

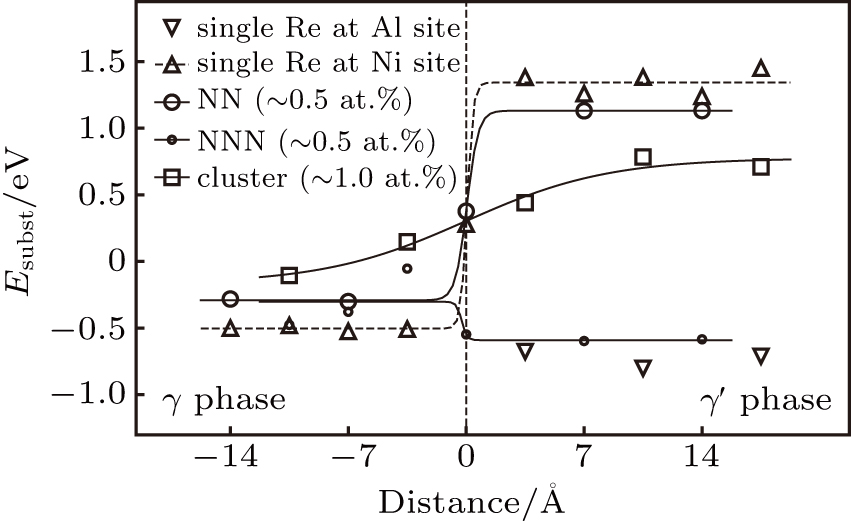
The calculated substitution formation energies are shown in Fig. 3. From the results of Esubst, we can see that the systems with single Re atom at Al site in γ′ phase have lower Esubst than the other systems in γ phase and in γ′ phase. This indicates that Re atom prefers to partition to γ′ phase in the Ni–Al–Re system. In γ′ phase of the alloy, the models with isolated Re atoms in Al sites have lower Esubst than the isolated Re atoms in the Ni sites. This implies that the isolated Re atoms tend to occupy Al sites in γ′ phase for energetic reasons. This is consistent with the previous first-principles calculation results.[31]

Fig. 3. The substitution formation energies of systems with Re atoms as a function of the distance from γ/γ′ interface. The zero point of the interface is taken as (001) pure Ni layer in the interface region that is in contact with Ni–Al layer as shown in Fig. 1.

In γ′ phase, the systems with single Re atoms at Al sites (models S1, S3, and S5 in Fig. 2(a)) are energetically favored over the systems with single Re atoms at Ni sites (models S1′, S3′, S5′, S2, and S4 in Fig. 2(a)), the systems with NN Re–Re atoms (models A1 and A2 in Fig. 2(b)), the systems with NNN Re–Re atoms (models B1 and B2 in Fig. 2(c)), or the systems with Re atom clusters (models C1 and C2 in Fig. 2(d)). The single Re atoms at Al sites (models S1, S3, and S5 in Fig. 2(a)) in γ′ phase are also energetically favored over the other systems with Re atoms in γ phase. In γ phase, the system with single Re atom at Ni site is more stable than NN Re–Re, the NNN Re–Re, and Re cluster systems. In this case, Re atom clusters are relatively not preferred. From this point of view, the systems with isolated Re atoms in γ phase are also energetically favored. In the work of Sun et al.,[32] they observed a certain amount of Re pairs in the Ni–Al–Re ternary model alloy by aberration-corrected high-angle annular dark-field scanning transmission electron microscopy (HAADF-STEM). This may be related with the small difference of Esubst for the NNN Re–Re pair system and the single Re atom system.

Comparing the Esubst of Re atoms at γ′/γ interface (model S5, S5′, S6), it can been seen that Esubst (model S5 single Re) < Esubst (model S6 single Re) < Esubst (model S5′ single Re). This indicates the fact that the Re atom at the interface prefer to occupy the Al site at γ′ side of the interface.

3.2. Partition behavior of Re atoms from the experiment

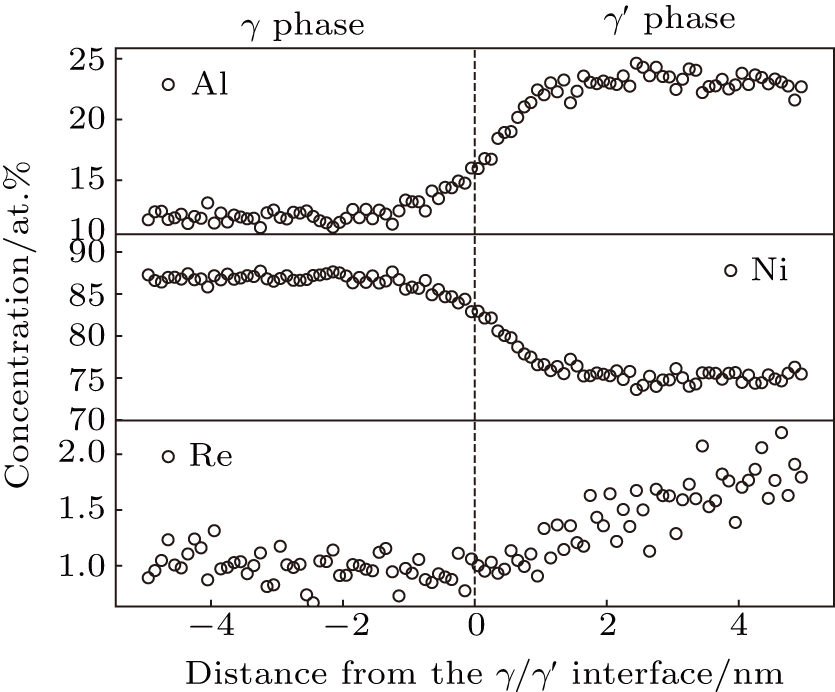
The concentration profile of Re in ternary alloy (Ni–Al–Re) is shown in Fig. 4. The result shows that Re prefers to partition to γ′ phase. The sum of the concentration for Al and Re in γ′ phase is approximately 25 at.%, which indicates that the Re prefers to occupy Al site in γ′ phase.

Fig. 4. Concentration profile determined from APT experiment (Ni–Al–Re ternary model alloy).

Thus, the simulation results of the Re atom occupying Al site is reasonable in our research. The calculated partition behavior and site preference of Re are consistent with the results of APT experiment.

3.3. Interatomic energy and electronic structure analysis

To better understand electronic mechanism of Re atoms in the systems at microscopic level and the bonding characters of atoms, the interatomic energy,[3335] the charge density difference (CDD), and the density of states (DOS) are studied. The electronic states and the interaction of atoms in the system can be expressed by the local density of states (LDOS) and the partial density of states (PDOS), which can give useful and detailed information of the underlying electronic mechanisms. The selected atoms in Fig. 5 are used to analyze electronic structures of the systems. All the DOS curves are smoothed using a Lorentzian broadening scheme with a broadening width of 0.05 eV.
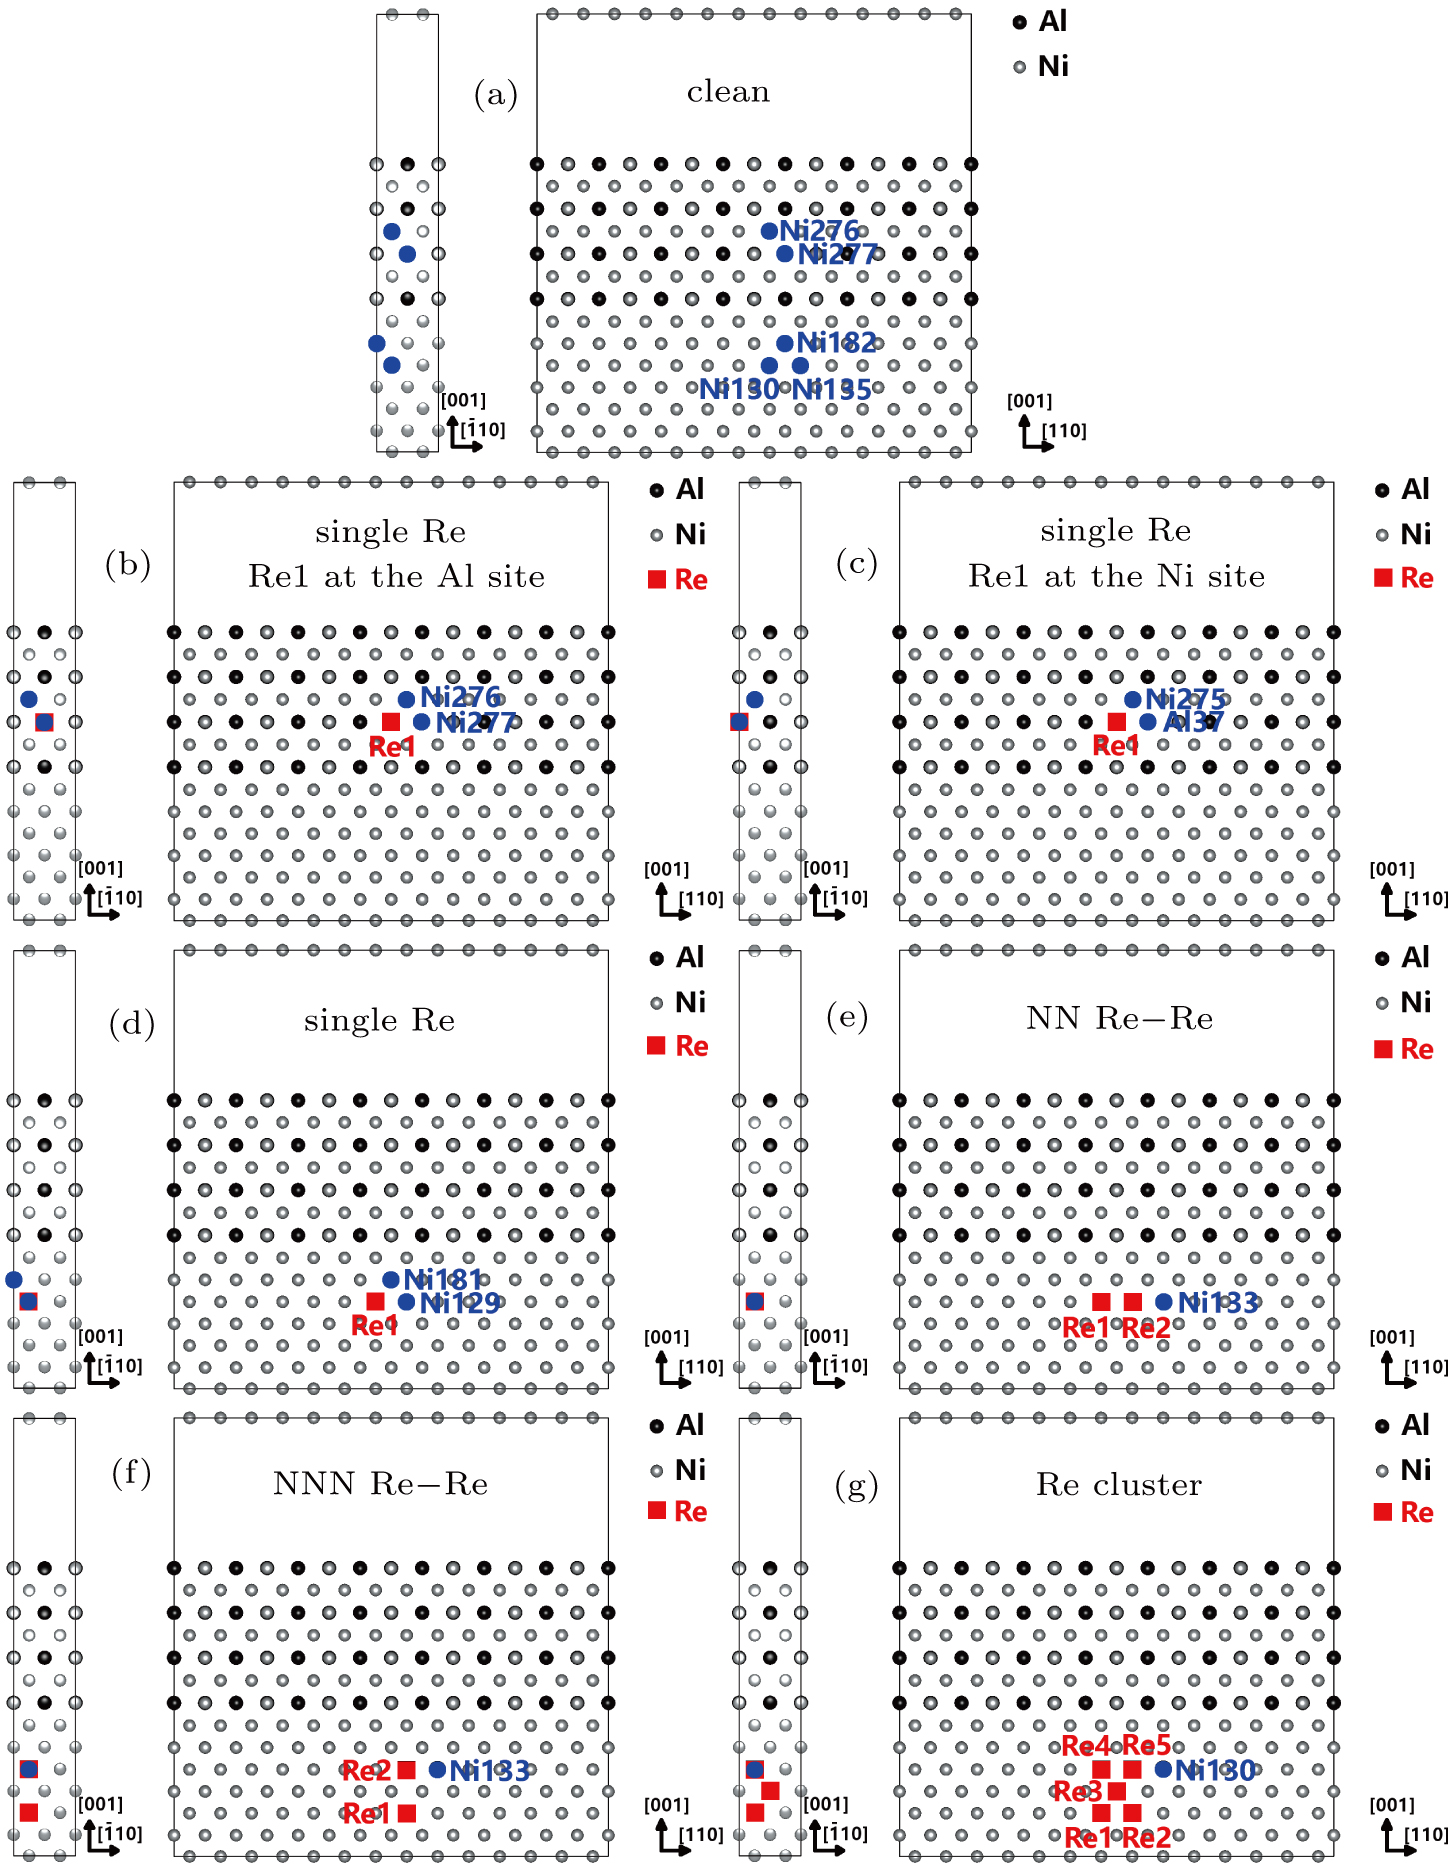
Fig. 5. The Re atoms and their NN Ni atoms or NN Al atoms in the models with different Re atom distributions.
3.3.1. The charge density difference analysis

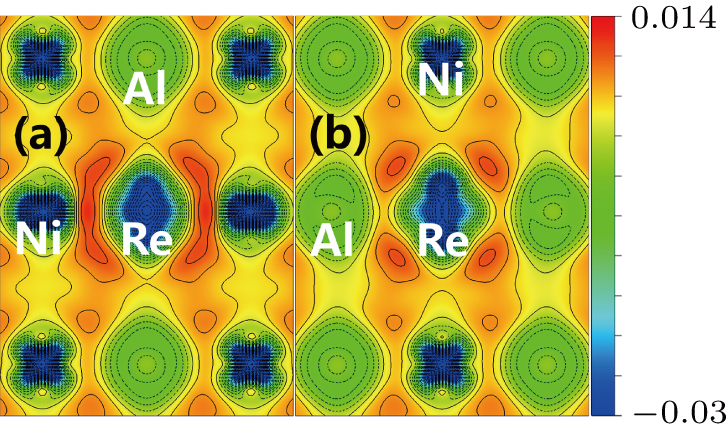
The site preference of the Re atom in γ′ phase can be explained from the charge density difference. It is seen from Fig. 6 that the charge accumulation between Ni and Re atoms is much larger than that between Ni and Al atom. The CDD between Ni and Re atoms has covalent-like features. The special feature of the CDD between Ni and Re is the presence of strong directional bonding. In γ′ phase the Al atom is surrounded by 12 Ni atoms, while Ni atom is surrounded by 8 Ni and 4 Al atoms. Therefore, the strong Ni–Re bonding plays an import role in stabilizing the system. From the above analysis, the bonding characters support the substitution of Re atom for Al site in γ′ phase.

Fig. 6. Charge density difference in () plane: (a) system with single Re atom at Al site in γ′ phase, which corresponds to model S3 in Fig. 2; (b) system with single Re atom at Ni site in γ′ phase, which corresponds to model S3′ in Fig. 2. The contour lines denote charge accumulation (solid line) and depletion (dashed line) and are plotted with an increment of 0.0027 e/a.u.3

To explain the atom distribution of atoms in ternary model Ni-based superalloy, the charge accumulation and depletion are studied for the system with Re atom(s) in γ phase. The single Re atom, NN Re–Re, NNN Re–Re, and Re cluster systems are compared (models S8, A4, B6, and C5 in Fig. 2) and the results are shown in Fig. 7. The CDD’s in Fig. 6 and Fig. 7 are visualized using the VESTA software.[36] The results show that charges flow from Re atom and Ni atom to covalent-like Re–Re and Ni–Re bond regions. There is a strong charge accumulation between NN Re–Re atoms and NN Ni–Re atoms. These indicate the strong electronic interaction of NN Re–Re and NN Ni–Re. As the number of NN Re–Re increases, the substitution formation energy of the systems with Re atoms in γ phase also increases. Considering that the more the NN Re–Re bonds in the system, the less the NN Ni–Re bonds in the system, we can see that the single influence of the strong electronic interaction of NN Re–Re does not necessarily results in an energetically stable system. The low substitution formation energy of the system containing Re atoms is related with the strong NN Ni–Re electronic interaction. Although the electronic interaction of NN Re–Re is strong, the NN Ni–Re electronic interaction is also strong and the number of NN Ni–Re bonds becomes larger with the decrease of the number of NN Re–Re bonds. The above analyses can, to some extent, explain the site preference of Re atom and atom distribution in the system.

Fig. 7. Charge density difference in () plane: (a) system with single Re in γ phase; (b) system with NN Re–Re system; (c) NNN Re–Re system; (d) Re cluster system. The four systems correspond to the four systems S8, A4, B6, C5 in Fig. 2. The contour lines denote charge accumulation (solid line) and depletion (dashed line) and are plotted with an increment of 0.0027 e/a.u.3
3.3.2. The interatomic energy

The interatomic energy (IE) is a useful quantity which can characterize the bonding strength between atoms and interatomic interactions between atoms. The IE has been successfully used to study the electronic structure and properties of metals and alloys. The discrete variational method (DVM)[37,38] is used to compute the interatomic energy. The IE is derived as follows:[3335]

where Nn is the occupation number for orbital Ψn, anαl = 〈φαl(r)|Ψn(r)〉, Hβlαl is the element of the Hamiltonian matrix which correlates the orbital β of atom l′ and the orbital α of atom l. The molecular orbital Ψn(r) can be expanded by the atomic orbital φαl(r) and is expressed by Ψn(r) = Σαl anαlφαl(r).

In Fig. 6 and 7, due to the fact that the electronic interactions of Re atoms are localized and the interactions of Re atoms with their surrounding atoms are mainly contributed by NN interactions. Moreover, the Ell′ can be used to quantize the strength and stability of the bonding. The stability of the systems can be characterized by the averaged interatomic energy of doping atoms (). The averaged interatomic energy of doping atoms is an average of interatomic energies of doping atoms with their NN atoms, and the is given by

where nX is the number of doping atoms in the system (X = Re), and nNN is the number of nearest neighbor atoms to X (X = Re) doping atom. In current research nNN = 12. Ell′ is the interatomic energy between l-site atom and l′-site atom. The l-site atoms are doping atoms and l′-site atoms are NN atoms to l-site doping atoms.

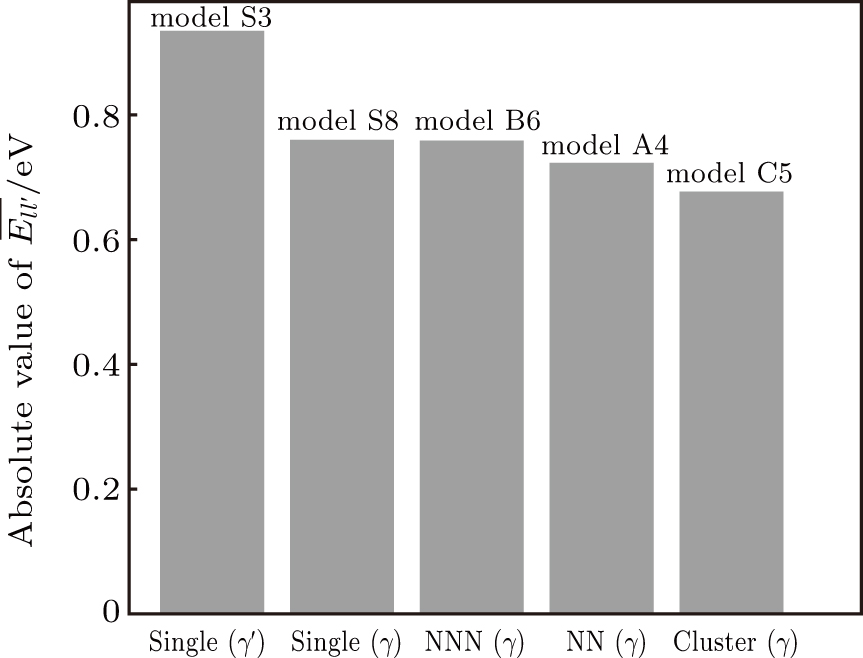
The interatomic energies of NN Re–Re and NN Ni–Re for the systems in Fig. 5 are shown in Table 1. The IE for NN Re1–Re2 is −1.55 eV and NN Ni133–Re2 is −0.76 eV in the NN Re–Re pair system. The IE for NN Ni133-Re2 is −0.84 eV in NNN Re–Re pair system. The IE’s for NN Ni130–Re5 and NN Re3–Re5 in Re cluster system are −0.66 eV and −1.19 eV, respectively. It is apparent that the NN Re–Re interaction is stronger than the NN Ni–Re interaction. From the result of Fig. 3, the Re cluster system has more NN Re–Re bonds and is less stable than the other systems. This indicates that the strong Ni–Re interaction plays an important role in the systems. This can be explained from the result of the averaged interatomic energies of doping atoms. The values of for Re atoms in each system and the absolute values of are shown in Table 2 and Fig. 8. From Fig. 8, it can be seen that of the systems follows the order: | (single, Re at Al site in γ′) > (single,γ) > . This explains that the isolated Re atoms in γ′ phase is preferred over other systems. In γ phase, the isolated Re atoms are more stable than other Re configurations. The results shown in Table 2 and Fig. 8 are consistent with the results in Fig. 2. From this respect, the favored configuration of single Re atoms in γ′ phase can be explained by the strong Ni–Re bonding in the systems.

Fig. 8. Absolute value of (in unit eV) for the single Re system, NN Re–Re system, NNN Re–Re system, and the Re cluster system. The γ′ and γ in the parentheses denotes that the Re atoms are in γ′ phase and γ phase, respectively. The S3, S8, A4, B6, and C5 represent the systems as shown in Fig. 2.
Table 1.

The interatomic energies (in units of eV) between atoms for different systems.

.
Table 2.

The averaged interatomic energies (in units of eV) of the doping elements for different systems.

.
3.3.3. Site preference of Re atoms in γ′ phase from electronic state analysis

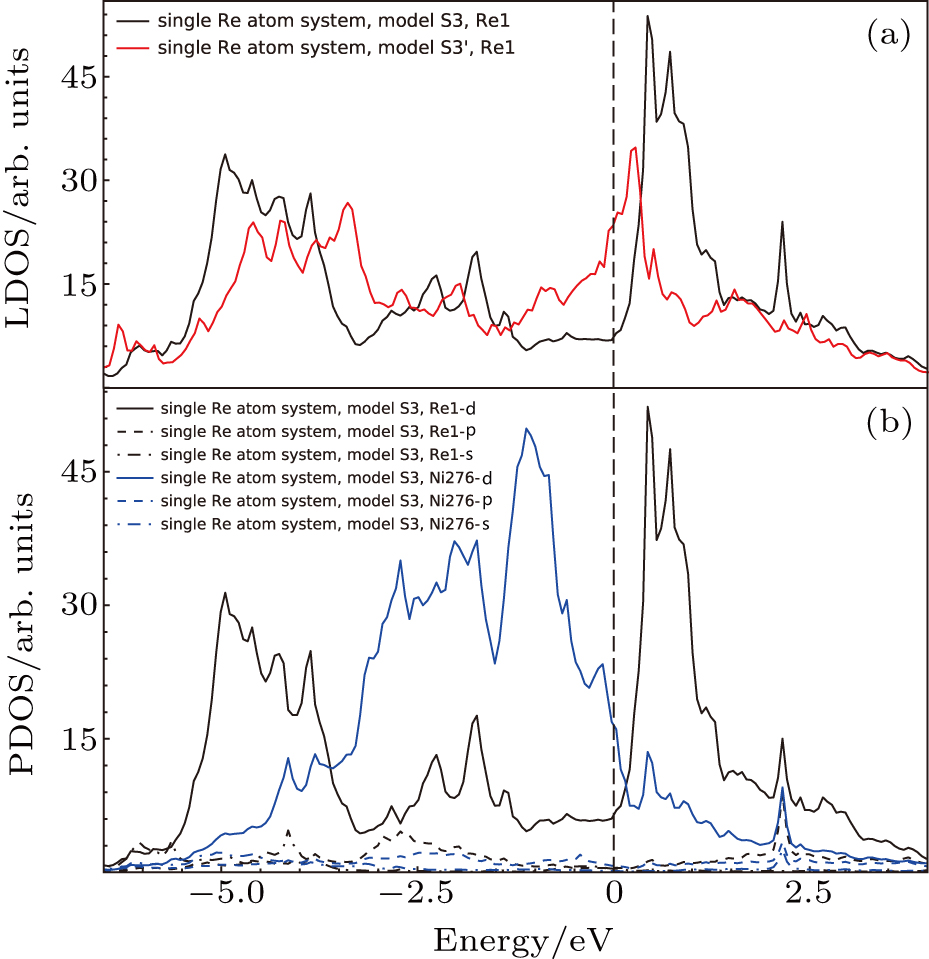
The LDOS’s of single Re atom occupying Al site (model S3 in Fig. 2) and occupying Ni site (model S3′ in Fig. 2) are compared in Fig. 9(a). We analyzed the DOS of atoms in the system with single Re atom occupying Al site in γ′ phase (this system has the lowest substitution formation energy as shown in Fig. 2), i.e., model S3. The model with Re atom occupying Ni site in γ′ phase (model S3′) is used to make the comparison. The LDOS’s of Re atom in these two systems are shown in Fig. 9(a). The Fermi energies of model S3 and model S3′ are −6.765 eV and −6.769 eV, respectively. The Fermi energies are shifted to zero in Fig. 9. Two prominent features exist when comparing the LDOS’s of single Re atoms in γ′ phase. First, the LDOS’s of Re atoms in the lower bound of the energy levels shift to deeper energy levels when Re atoms change from Ni site to Al site in γ′ phase; Second, the LDOS’s of Re atoms at or near the Fermi energy level significantly decrease after Re atoms change from Ni site to Al site.

Fig. 9. (a) Local density of states for atoms in model S3 (cf., Fig. 2) and model S3′ (cf., Fig. 2), respectively. Re1 atoms marked in the upper subplot corresponds to the Re atoms in Fig. 5. (b) Partial density of states for atoms in model S3 (cf., Fig. 2). Re1 and Ni276 atoms marked in the lower subplot correspond to Re and Ni atoms in Fig. 5. The Fermi energies are shifted to zero.

To analyze the contribution of each orbitals to the interaction between atoms, the PDOS’s of atoms in model S3 (cf., Fig. 2) are shown in Fig. 9(b). It can be seen that the p and s states of the Re1 and Ni276 are more extended and the d states are more localized. The density of states of Re and Ni are mainly contributed by the d electrons and this can also be validated from Fig. 10. It is also seen that there exist d–d hybridizations at −4.95, −4.61, −2.26, −1.74, and −0.60 eV between Re1 atom and Ni276 atom. Moreover, for model S3 with Re at Al site in γ′ phase, the bonding region and the anti-bonding region of the density of states is separated by a valley near the Fermi level,[39,40] which stabilizes the structure.
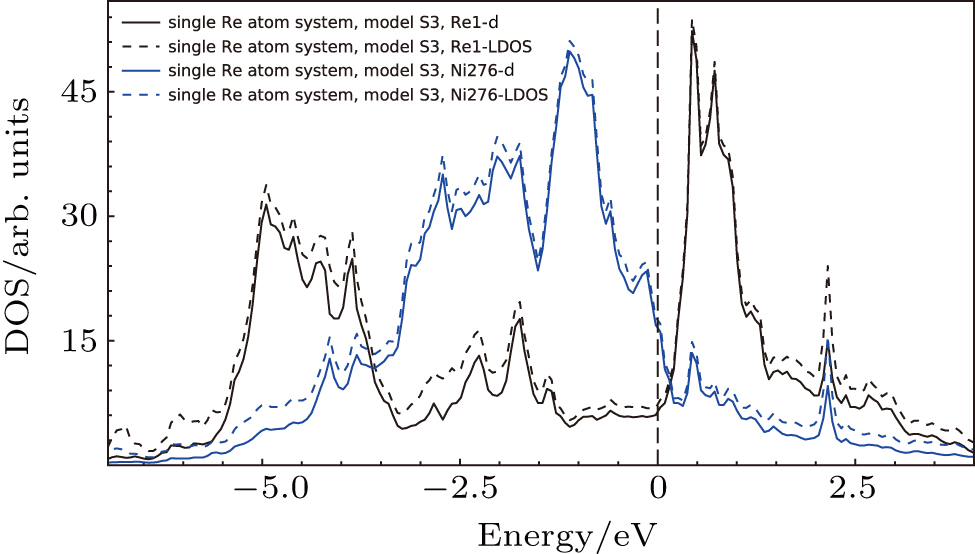
Fig. 10. Density of states for the atoms in model S3 (cf., Fig. 2). Re1, Ni276 marked in the plot correspond to Re and Ni atoms in Fig. 5, respectively. The Fermi energy is shifted to zero.

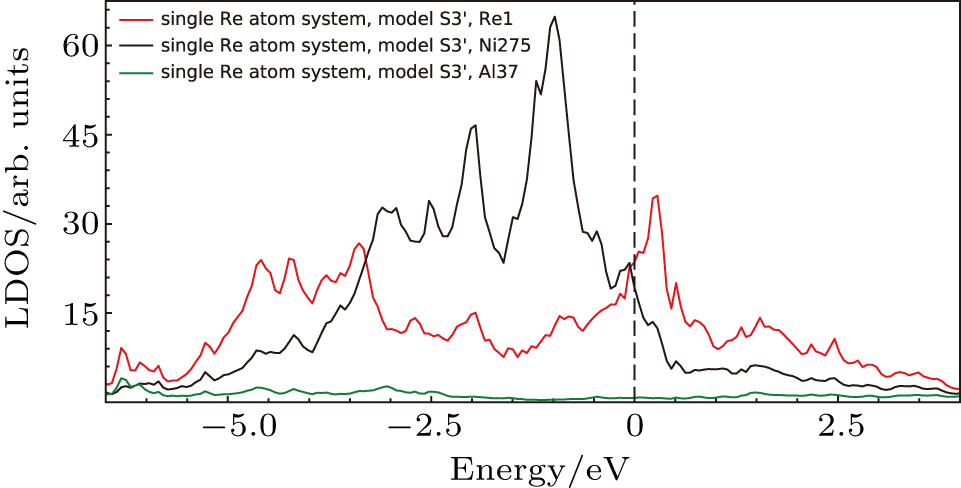
The LDOS’s of Re1, Ni275, Al37 in the system with single Re at Ni site in model S3′ (cf., Fig. 2) are compared and shown in Fig. 11. There exists hybridized density of states between Re1 atom and its NN Ni275 atom, and the hybridized states between the Re1 atom and its NN Al37 atom is less and weak in comparison with that between Re1 atom and its NN Ni275 atom. This implies that Re atom at Ni site in γ′ phase has strong interactions with neighboring Ni atoms, and the Al–Re interaction is weaker.

Fig. 11. Local density of states for atoms in model S3′ (cf., Fig. 2). Re1, Ni275, and Al37 marked in the plot correspond to Re, Ni, and Al atoms in Fig. 5, respectively. The Fermi energy is shifted to zero.

Based on the above features, it is found that the interaction of NN Ni–Re is stronger than NN Al–Re and the NN Ni–Re interaction is mainly contributed by the d–d hybridization. The density of states at or near the Fermi level and the NN Ni–Re d–d hybridization states play important roles in the system.

3.3.4. The interfacial electronic states

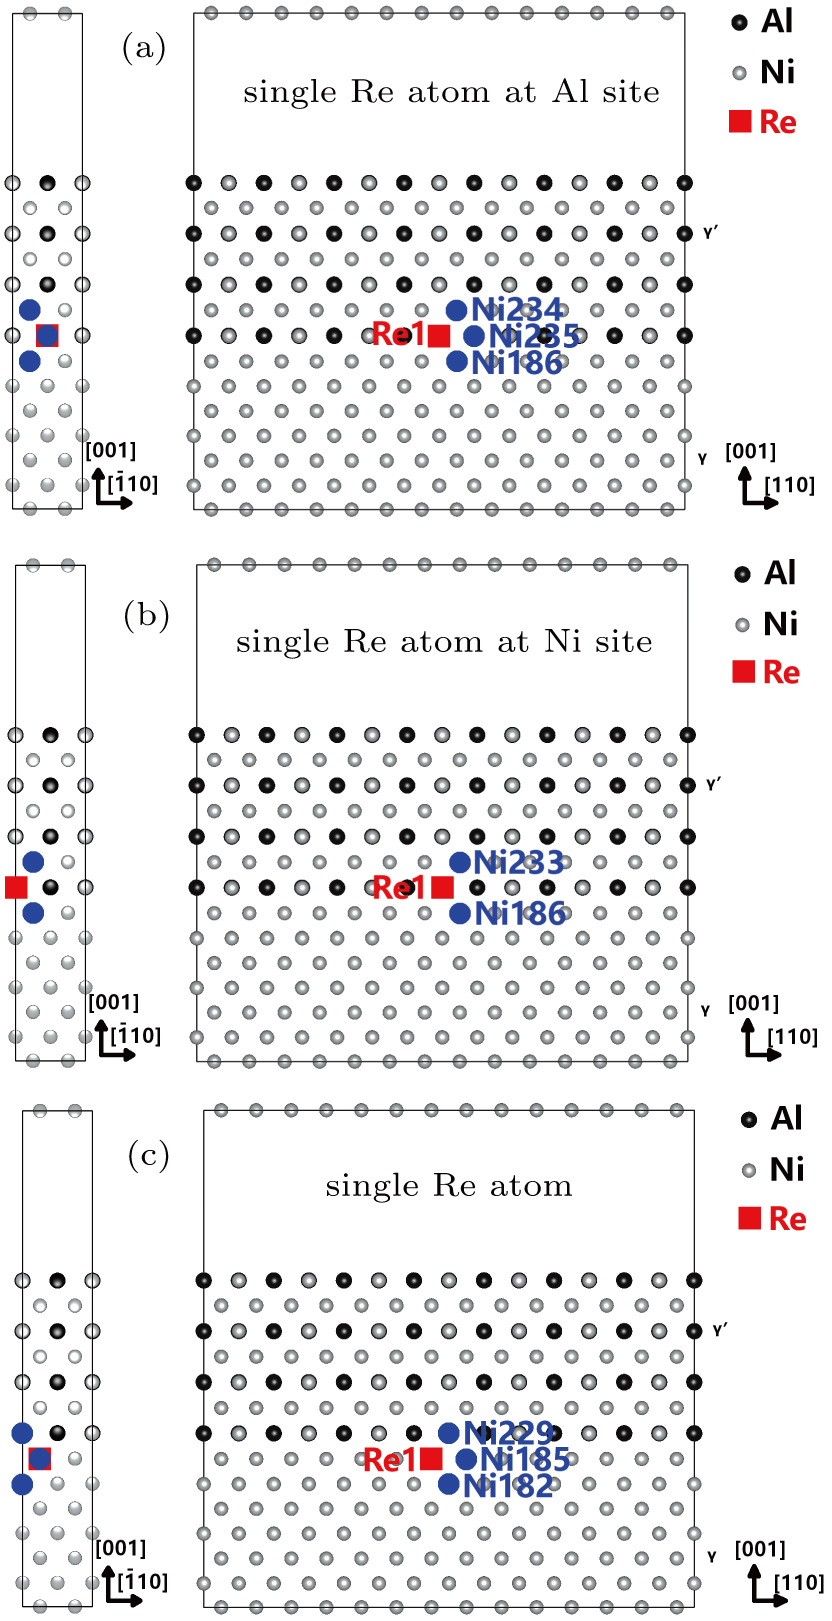
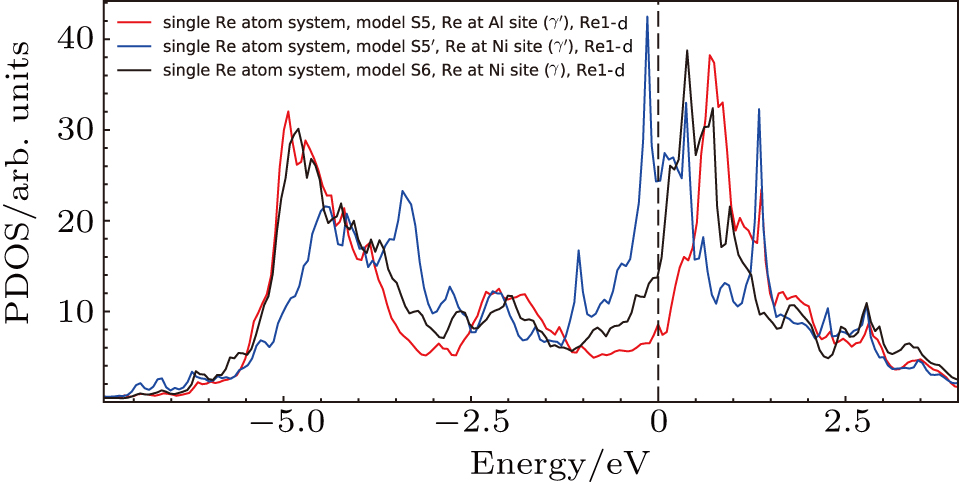
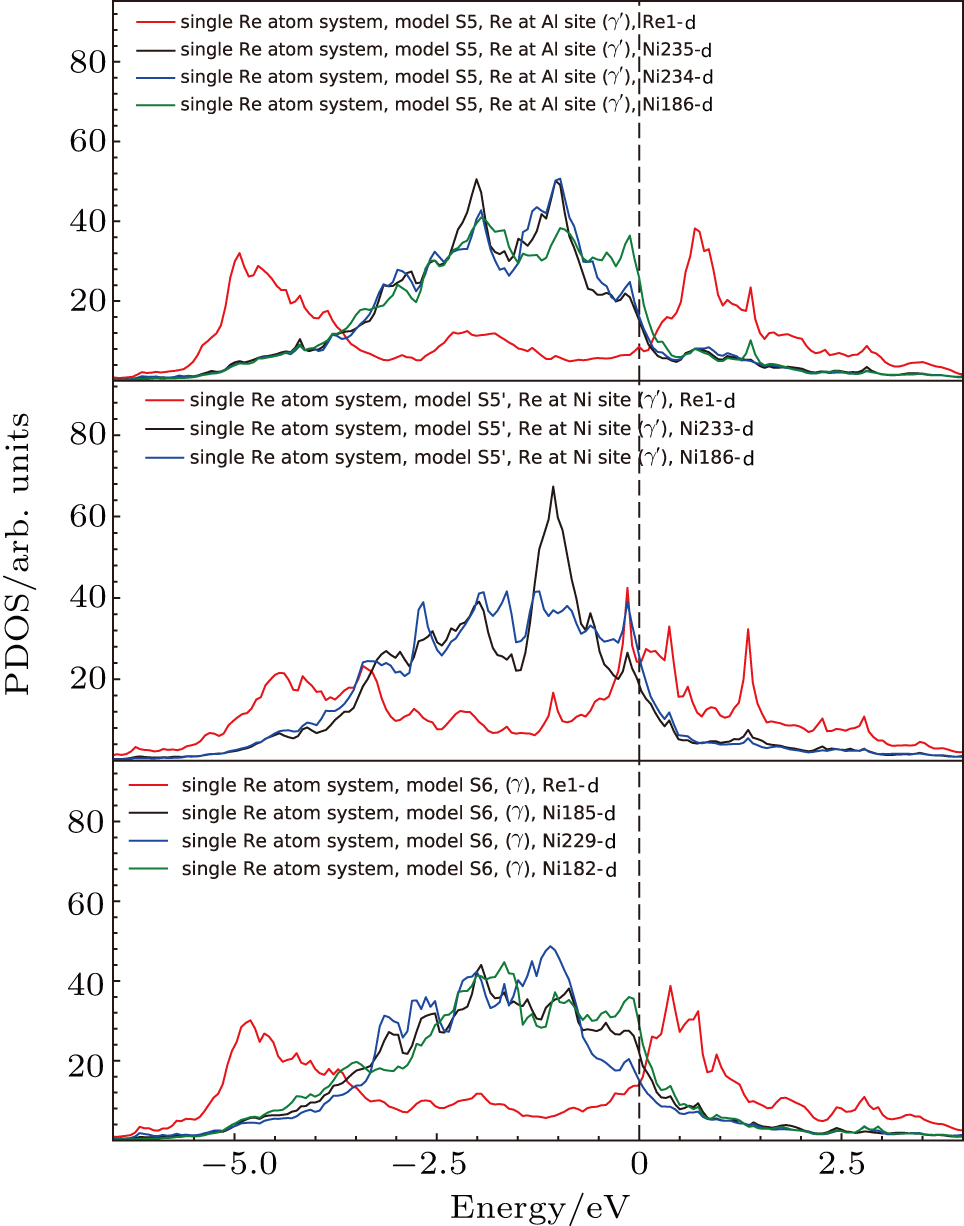
Three positions of Re atoms at interface are considered to analyze the interfacial electronic states. The first system is the system with Re atom at Al site in γ′ side near the interface (model S5 in Fig. 2); the second system is the system with Re atom at Ni site in γ′ side near the interface (model S5′ in Fig. 2); the third system is the system with the Re atom in γ side near the interface (model S6 in Fig. 2). The three systems are shown in Fig. 12.

Fig. 12. The Re atoms and their NN Ni atoms in the models with single Re atoms near the interface. (a) the system with Re atom at Al site in γ′ side near the interface, which corresponds to system S5 in Fig. 2; (b) the system with Re atom at Ni site in γ′ side near the interface, which corresponds to system S5′ in Fig. 2; (c) the system with Re atom in γ side near the interface, which corresponds to system S6 in Fig. 2.

The electronic states of d orbitals for the S5, S5′, and S6 systems with Re atoms are shown in Fig. 13. The Fermi energies for models S5, S5′, and S6 are −6.767, −6.770, and −6.770 eV, respectively and the Fermi levels are shifted to zero in Fig. 13. More and stronger peaks of the Re-d states in deep energy levels are observed for S5 and S6 systems than that of S5′ system. Additionally, the Re-d states of system S5 at or near the Fermi energy level shows the lowest valley, followed by that of system S6 and that of system S5′.

Fig. 13. Partial density of states for the Re atoms near the interface. The models S5, S5′, and S6 correspond to the models in Fig. 2. The Re1 atoms in the plot denotes the Re1 atoms in Fig. 12. The Fermi energies are shifted to zero.

The d states of Re atoms and their inequivalent NN Ni atoms of the three systems are shown in Fig. 14. The strong d–d hybridization between Re atom and the host Ni atoms can be observed in Fig. 14. Two features can be seen in Fig. 14. First, in deep energy levels, the d–d hybridization states of Re atom and the NN Ni atoms in model S5 mainly located at −4.94 eV and −4.19 eV; the d–d hybridization states of Re atom and NN Ni atoms in model S5′ mainly located at −4.45 eV and −4.16 eV; the d–d hybridization states of Re atom and NN Ni atoms in model S6 mainly located at −4.80 eV and −4.23 eV. This indicates that the system S5 has stronger Ni-d and Re-d hybridizations than other systems in deep energy levels. Second, for the Re-d state of S5 system with Re doped at Al sites in γ′ side near the interface, the bonding region and the anti-bonding region of d states are separated by a valley near the Fermi level,[39,40] which also indicates the configuration of the model S5 is preferred.

Fig. 14. Partial density of states for Re atoms and their NN Ni atoms near the interface. The models S5, S5′, and S6 correspond to the models in Fig. 2. The Re1, Ni235, Ni234, Ni186, Ni233, Ni185, Ni229, and Ni182 correspond to the atoms in Fig. 12. The Fermi energies are shifted to zero.
3.3.5. Effects of doping Re atoms from the density of state analysis

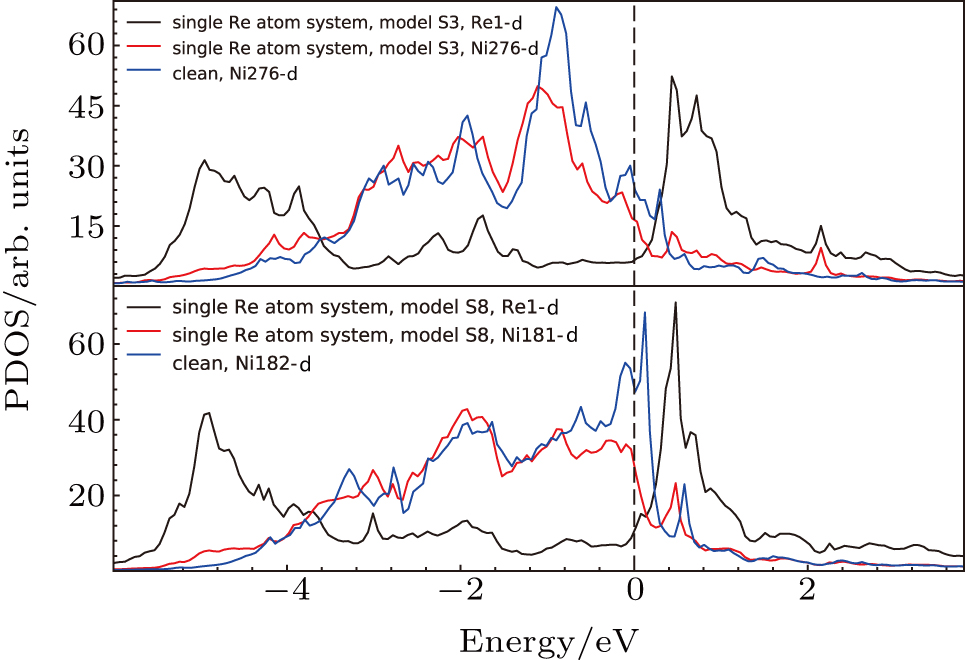
We investigated the effects of doping Re atoms on the system. From the above charge density analysis, the localized interaction feature of the doping atoms with their surrounding atoms can be seen. The above analysis on s, p, and d states showed the important contribution of d states of Re atom and Ni atom to the system. Thus, we focus on the effects of doping atoms on electronic states of their NN atoms and the PDOS of d states. The system without doping elements, the system with single Re atom at Al site in γ′ phase (model S3) and the system with single Re atom in γ phase (model S8) are compared and the PDOS are given in Fig. 15.

Fig. 15. Partial density of states for Re atoms and their NN Ni atoms in models S3 and S8 (cf., Fig. 2), respectively. Re1, Ni181, Ni182, and Ni276 atoms marked in the plots correspond to Re and Ni atoms in Fig. 5. The Fermi energies are shifted to zero.

The PDOS’s of Ni276 in model S3 and that of Ni276 in the system without Re are compared in Fig. 15. When Re1 atom is introduced to occupy Al site in γ′ phase (model S3), and acting as the nearest neighbor atom of the Ni276 atom, the Ni276-d states in deep energy levels increase. In the relatively higher energy levels below the Fermi energy, an apparent shift of the Ni-d states to lower energies is observed. The hybridized states of Ni276-d and Re1-d states are seen to mainly located at −4.95, −2.26, −1.74, and −0.60 eV after the doping of the Re1 atom. Especially, the formation of d–d hybridization states of Ni276 atom and Re1 atom is observed. The d state peak of Ni276 atom located at −1.92 eV in the Re-free system (without Re atoms) are observed to vanish, and the formation of two d–d hybridization states between the Ni276 and the Re1 atom (−2.26 eV and −1.74 eV) after the doping of Re atom are observed. Additionally, the d state peak of Ni276 atom located at −0.56 eV in the Re-free system slightly is shifted to −0.60 eV to form the d–d hybridization states with Re-d state after the doping of Re atom. A prominent feature of the doping effect of Re atom is also observed. The d states of Ni atom at or near the Fermi energy in Re-free system are decreased after doping Re atom and the Fermi energy is located close to a valley.

The d states of Ni and Re atoms in γ phase (model S8) have also been analyzed, and compared with those in the system without Re atoms (the system marked with “clean” in Fig. 5) in Fig. 15. It can be clearly seen that at or near the Fermi level in Fig. 15, the d states of Ni181 atom in model S8 are reduced compared with those of Ni182 atom in Re-free system. The formation of the d–d hybridization states of Ni181 atom and Re1 atom is also seen after Re atom substituted Ni atom in γ phase. The d–d hybridization states of Ni181 and Re1 are mainly located at −4.90, −4.21, −3.01, and −1.92 eV. Especially, the merge of d-state peaks of Ni atom into a hybridization state peak between Ni atom and Re atom is found. The strength of the peaks located at −3.28 eV and −2.77 eV of Ni atom decreased and the new peak is formed at −3.01 eV, which is found to be a d–d hybridization state between Ni181 and Re1 atoms. The decrease of the d state of Ni atom at or near the Fermi level is seen, and the valley located near the Fermi level is also seen in model S8.

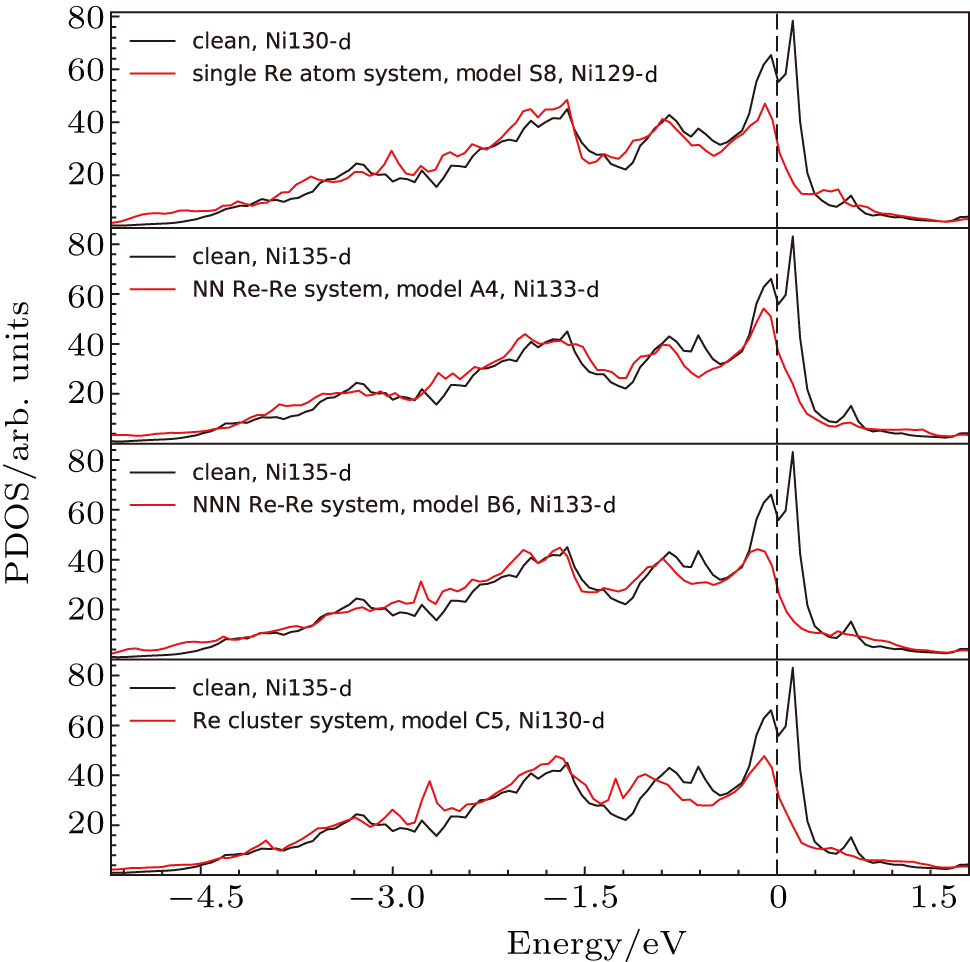
The d states of the Ni atoms in γ phase after doping (the systems marked with “single Re”, “NN Re–Re”, “NNN Re–Re”, and “Re cluster”in Fig. 5) are compared with that of the Ni and Re atoms in the system without Re atoms (the system marked with “clean” in Fig. 5) in Fig. 16. It is apparent to see that after doping Re atoms to the system, the d state of the Ni atom at the Fermi level and near the Fermi level decreased.

Fig. 16. Partial density of states for Re atoms and their NN Ni atoms in the models. Model clean, S8, A4, B6, and C5 marked in the plot correspond to the systems in Fig. 2, respectively. Ni129, Ni130, Ni133, and Ni135 atoms marked in the plot correspond to Ni atoms in Fig. 5. The Fermi energies are shifted to zero.

These results showed the effects of doping Re atoms on electronic structures of systems.

4. Conclusions

The first-principles method with the atom probe experiment is used to study the Re occupation behavior, Re distributions, and Re doping effects in the Ni-based superalloys. The Re partition behavior, site occupancy behavior, and favored existing configurations are systematically explored based on the model containing both γ and γ′ phases. The first-principles calculation results and the atom probe experiment results showed that Re atoms prefer γ′ phase and occupy Al sites in Ni–Al–Re ternary alloy. The isolated Re atoms are energetically preferred in γ′ phase of ternary Ni–Al–Re alloy. The electronic states and the electronic structures are analyzed. The results of electronic structure analyses showed that there exist strong NN Ni–Re interactions and the strong interaction of Ni–Re is mainly contributed by the d–d electron interactions. The formation of d–d hybridizations between NN Ni atoms and Re atoms after doping Re atoms is observed and validated. The density of states at or near the Fermi level and the d–d hybridizations of NN Ni–Re are found to be important in the systems. The energetics and the electronic structure analyses also showed that near the interface, the Re atom prefers Al site in γ′ side and it can be seen to be natural.

Reference
[1] Reed R C 2006 The Superalloys: Fundamentals and Applications Cambridge University Press 10.1017/CBO9780511541285
[2] Tin S Zhang L Hobbs R A Yeh A C Rae C M F Broomfield B 2008 Superalloys 2008 Reed R C Green K A Caron P Gabb T P Fahrmann M G Huron E S Woodard S A Warrendale, PA The Minerals, Metals & Materials Society 81 https://www.tms.org/superalloys/10.7449/2008/Superalloys_2008_81_90.pdf
[3] Murakumo T Kobayashi T Koizumi Y Harada H 2004 Acta Mater. 52 3737
[4] Erickson G L 1996 Superalloys 1996 Kissinger R D Deye D J Anton D L Cetel A D Nathal M V Pollock T M Woodford D A Warrendale, PA The Minerals, Metals & Materials Society 35 https://www.tms.org/superalloys/10.7449/1996/Superalloys_1996_35_44.pdf
[5] Blavette D Caron P Khan T 1986 Scr. Metall. 20 1395
[6] Giamei A F Anton D L 1985 Metall. Trans. 16 1997
[7] Murakami H Harada H Bhadeshia H K D H 1994 Appl. Surf. Sci. 76�?7 177
[8] Yu X X Wang C Y Zhang X N Yan P Ze Zhang 2014 J. Alloys Compd. 582 299
[9] Chen K Zhao L R Tse J S 2003 Mater. Sci. Eng. 360 197
[10] Peng L Peng P Liu Y G He S Wei H Jin T Hu Z Q 2012 Comput. Mater. Sci. 63 292
[11] Liu F H Wang C Y 2017 RSC Adv. 7 19124
[12] Wanderka N Glatzel U 1995 Mater. Sci. Eng. 203 69
[13] Rüsing J Wanderka N Czubayko U Naundorf V Mukherji D Rösler J 2002 Scr. Mater. 46 235
[14] Zhu T Wang C Y Gan Y 2010 Acta Mater. 58 2045
[15] Mottura A Finnis M W Reed R C 2012 Acta Mater. 60 2866
[16] Lu B K Wang C Y Du Z H 2018 Chin. Phys. 27 097102
[17] Ding Q Q Li S Z Chen L Q Han X D Ze Zhang Yu Q Li J X 2018 Acta Mater. 154 137
[18] Zhu T Wang C Y 2005 Phys. Rev. 72 014111
[19] Srinivasan R Banerjee R Hwang J Y Viswanathan G B Tiley J Dimiduk D M Fraser H L 2009 Phys. Rev. Lett. 102 086101
[20] Hwang J Y Nag S Singh A R P Srinivasan R Tiley J Fraser H L Banerjee R 2009 Scr. Mater. 61 92
[21] Reed R C Yeh A C Tin S Babu S S Miller M K 2004 Scr. Mater. 51 327
[22] Kresse G Furthmüller J 1996 Phys. Rev. 54 11169
[23] Hohenberg P Kohn W 1964 Phys. Rev. 136 B864
[24] Kohn W Sham L J 1965 Phys. Rev. 140 A1133
[25] Blöchl P E 1994 Phys. Rev. 50 17953
[26] Kresse G Joubert D 1999 Phys. Rev. 59 1758
[27] Perdew J P Burke K Ernzerhof M 1996 Phys. Rev. Lett. 77 3865
[28] Monkhorst H J Pack J D 1976 Phys. Rev. 13 5188
[29] Miller M K 2000 Atom Probe Tomography: Analysis at the Atomic Level New York Springer Science & Business Media 10.1007/978-1-4615-4281-0
[30] Hellman O C Vandenbroucke J A Rüsing J Isheim E Seidman D N 2000 Microsc. Microanalysis 6 437
[31] Wang S Y Wang C Y Sun J H Duan W H Zhao D L 2001 Phys. Rev. 65 035101
[32] Sun M Li Z Zhu G Z Liu W Q Liu S H Wang C Y 2016 Commun. Comput. Phys. 20 603
[33] Wang C Y Feng A Gu B L Liu F S Chen Y 1988 Phys. Rev. 38 3905
[34] Wang C Y Zhao D L 1993 MRS Proc. 318 571
[35] Wang F H Wang C Y 1998 Phys. Rev. 57 289
[36] Momma K Izumi F 2011 J. Appl. Crystallogr. 44 1272
[37] Ellis D E Painter G S 1970 Phys. Rev. 2 2887
[38] Delley B Ellis D E Freeman A J Baerends E J Post D 1983 Phys. Rev. 27 2132
[39] Xu J H Oguchi T Freeman A J 1987 Phys. Rev. 36 4186
[40] Wen M R Wang C Y 2016 RSC Adv. 6 77489