Re effects in model Ni-based superalloys investigated with first-principles calculations and atom probe tomography
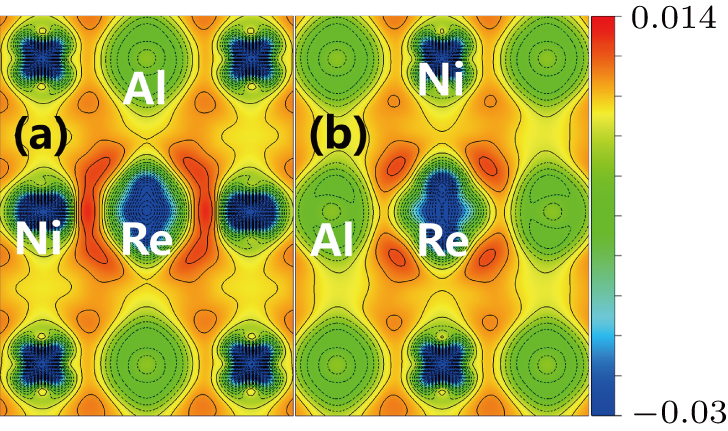
Charge density difference in (
Re effects in model Ni-based superalloys investigated with first-principles calculations and atom probe tomography |
Charge density difference in ( |
| |