† Corresponding author. E-mail:
In this paper, we present a highly efficient structure determination pipeline software suite (X2DF) that is based on the “Parameter space screening” method, by combining the popular crystallographic structure determination programs and high-performance parallel computing. The phasing method employed in X2DF is based on the single-wavelength anomalous diffraction (SAD) theory. In the X2DF, the choice of crystallographic software, the input parameters to this software and the results display layout, are all parameters which users can select and screen automatically. Users may submit multiple structure determination jobs each time, and each job uses a slightly different set of input parameters or programs. Upon completion, the results of the calculation performed can be displayed, harvested, and analyzed by using the graphical user interface (GUI) of the system. We have applied the X2DF successfully to many cases including the cases that the structure solutions fail to be yielded by using manual approaches.
It has been reported that single-wavelength anomalous diffraction (SAD) is an indispensable technique in x-ray crystallography for the structure determination of biological macromolecules. Heavy-atom sites searching and phasing, density modification, and model building are the main steps in SAD structure solution. Many programs are available for automatic structure determinations, for instance, Phenix.autosol[1] and SHELXC/D/E[2,3] are the most commonly used programs for heavy-atom sites searching and phasing based on automatic interpretation of Patterson maps or by direct method (DM);[4] Parrot[5] is widely used for modifying the initial electron density maps using solvent flattening,[6] histogram matching, and non-crystallographic symmetry averaging methods; ARP/wARP,[7] Buccaneer,[8] and Phenix.autobuild[9,10] are highly automated tools for building the iterative model based on the density-weighted score function, statistical chain tracing method, automatic templates matching algorithm, etc. Further, CRANK,[11] Auto-Rickshaw,[12,13] and IPCAS[14–17] are highly automated and widely used pipelines for the SAD method. All these methods have been widely employed with great success, however, for some difficult cases, it may be necessary to fine-tune the settings or adjustable parameters and run more trials. Moreover, in some special cases, only a specific combination of parameters can realize an accurate structure solution, and there exists even no significant correlation between the combination of parameters and the final result. Therefore, relying solely on experience and trial and error analysis is time-consuming and has no guarantee to obtain ideal results.
To solve this problem, we develop a highly efficient structure determination pipeline software suit, X2DF. The X2DF is an automated SAD phasing, density modification, and model building pipeline. The X2DF is constructed based on the “Parameter space screening” method proposed by Liu et al.[18] The X2DF can be used to screen dozens or hundreds of different combinations of input parameters and programs such as high-resolution limits for the heavy-atom sites searching and phasing, the number of heavy-atom sites to be searched, the space groups, etc. The X2DF then spawns the multiple jobs in parallel on a Linux cluster by using various combinations of programs and input-parameter values. The X2DF is successfully applied to many cases including some special and difficult cases which will be presented in Section
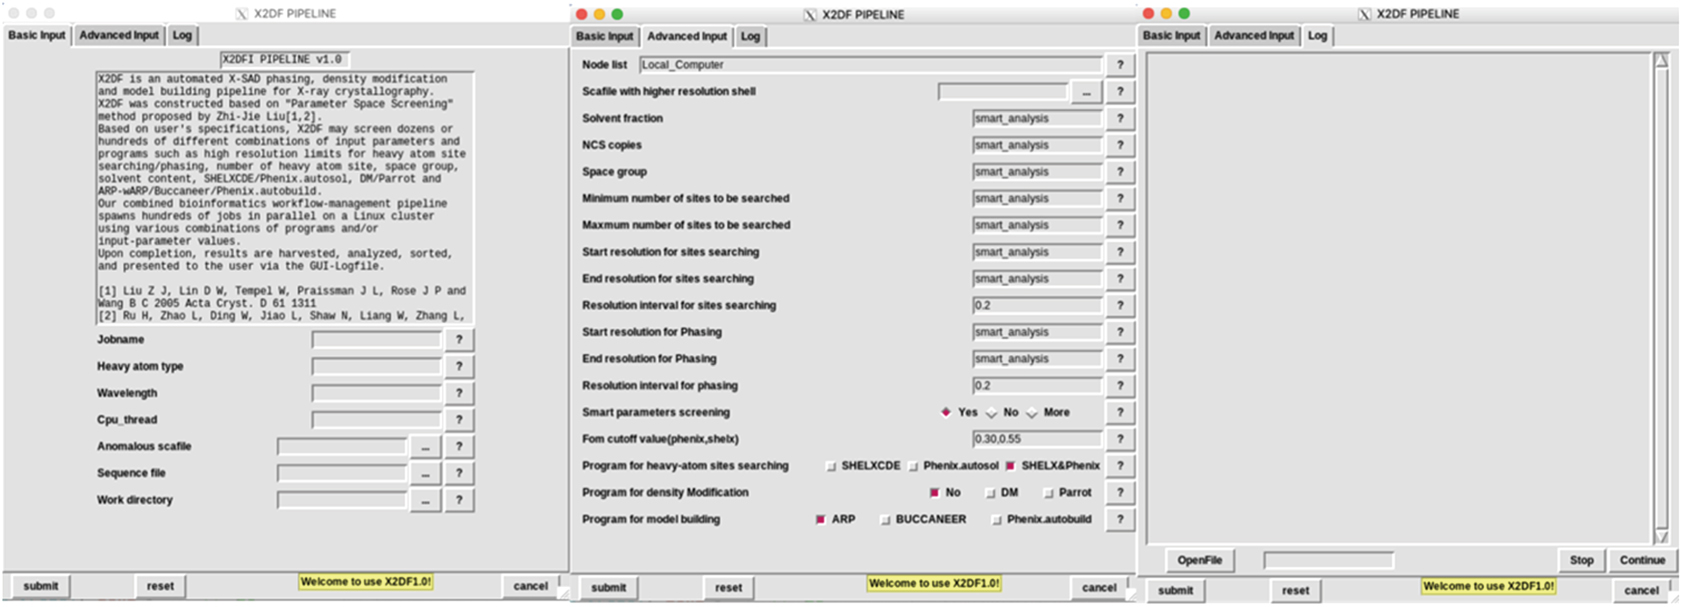
The X2DF has a stand-alone interface written in Perl/tk. The X2DF GUI window (Fig.
The X2DF GUI contains three Panel bars, i.e., “Basic Input Panel”, “Advanced Input Panel”, and “Log Panel”. The “Basic Input Panel” can be used to fill in the required information and upload the necessary data, including “Heavy-atom type”, “Wavelength”, “CPU_thread”, “Anomalous diffraction data”, “Sequence file”, and “Work directory”.
Other parameters and experimental data can be input or uploaded by using an “Advanced Input Panel”. In this panel, “Node list” item can be used for assigning the node name of the high-performance computing cluster. “Scafile with higher resolution shell” item can be used for uploading the high-resolution diffraction data. The “Minimum number of sites to be searched” and “Maximum number of sites to be searched” items are used to specify the search range of heavy-atom sites number. The “Start resolution for sites searching”, “End resolution for sites searching”, and “Resolution interval for sites searching” items are used for specifying the resolution screening range and interval for the heavy-atom sites searching. Similarly, The “Start resolution for phasing”, “End resolution for phasing”, and “Resolution interval for phasing” can be used to set the resolution screening range and interval for initial phases calculation. The “Program for heavy-atom sites searching” term, “Program for density modification” term, and “Program for model building” item list the candidate programs to be used in structure determination. The “figure-of-merit (FOM) cutoff value” is a constrained parameter used to limit the number of jobs. If the FOM value of the initial phases is less than the “FOM cutoff value,” this job will be killed and deleted. The user may change any default control parameter in this panel, but in most cases using the default parameters will produce the desired results.
The “Log Panel” allows the user to monitor the progress of a running job and to analyze the final results.
The workflow chart of the X2DF (shown in Fig.
For SAD phasing, the SAD data need inputting in reflection intensity SCA format. Other required parameters are the sequence, wavelength, and heavy-atom type. The optional parameters described in Subsection
When the users complete data entry and click the “submit” button, the number of jobs will be calculated by using a parameter space screening method;
 |
Then, the X2DF can be used to create a series of independent jobs with the combination of unified parameter and program and to submit these jobs to the Linux cluster for further processing involved in structure determination.
Substructure information is essential for SAD phasing. The SHELXC/D or/and Phenix.autosol can be used for heavy-atom sites searching with different resolutions and the number of the expected sites, which have been screened as discussed in Step 2.
Once the substructure is determined, the initial phases of the anomalous data can be calculated by using SHELXE or/and Phenix.autosol, and a set of the initial phases with FOM is written in a new MTZ file.
If the FOM value of the initial phases is less than the “FOM cutoff value” (input using the “Advanced Input Panel” and the default value for SHELXE is 0.55, for Phenix.autosol, it is 0.35), the jobs are terminated, and the outputted files are deleted.
After Job-analysis, the remaining electron density map calculated in Step 4 can be further refined by DM and/or Parrot. New MTZ files with a set of improved phases will be created. This step is optional and can be skipped by selecting “No” in “Density modification” item in the “Advanced Input Panel.”
Based on the selected programs in “Model building” item, the model building step is carried out by using ARP/wARP, Buccaneer or/and Phenix.autobuild. Further, if the user provides high-resolution diffraction data in Step 1, its amplitude is used for building high-resolution model in this step.
After model building, the final coordinate and MTZ files are stored in the “Result” folder, and the structure information of the outputted models (Rfree/Rwork/Residues Built/Residues Placed) is written in a log file, which can be presented in the “Log Panel” in real-time.
The X2DF is freely available to academic users and has been tested on Linux (Centos, Fedora, and Ubuntu) platforms. Users can download the latest version from the website:
All calculations presented in this paper were performed on a T7910 (DELL) with a 3.40 GHz, 24 processors Intel Xeon E5-2643 v4 CPU, and 64 GB RAM. The versions of the supported programs are CCP4-7.0.075, PHENIX-1.15.2-3472, ARP/wARP-8.0, and cbuccaneer version 1.6.5, SHELXC/D/E-version 2016/1.
The general applicability of the X2DF is tested with many unknown structures by using various protocols; however, only four typical and intractable cases are presented in this paper. The resolutions of the test cases range from 2.70 Å to 3.21 Å. The quantity of residues ranges from 164 to 952. The types of heavy-atoms used are S and Se. The mean anomalous difference ranges from 0.0349 to 0.0716. Detailed information about the x-ray diffraction data is summarized in Table
| Table 1. Diffraction data used in the case studies. Four typical cases are selected. T1 denotes a typical low-resolution SeMet-SAD case used in revealing effects of resolution limit on final result; T2 denotes a typical case of low redundancy of SeMet-SAD and low crystal symmetry, which presents the influence of the combination of different programs; and T3 denotes a typical case of long-wavelength Sulphur SAD, showing the crucial role of screening heavy-atom sites. T4 denotes a typical case of long-wavelength native Sulphur SAD with high-resolution data. . |
The quality of the output models is measured by using two indicators, Rwork and Rfree.[21–24] If the Rfree/Rwork is less than 0.40/0.40, it is regarded as a “Good Result” and the lowest Rfree/Rwork ratio is seen as the “Best Result.” The resolution of the “Best Result” is considered as the “Best Resolution.” An overview of the results of the test cases is presented in Table
| Table 2. Input parameters and solutions of test cases. R1–R3 corresponding to the test cases T1–T3 in Table |
Test case 1 (T1) represents a typical case of SeMet-SAD with a resolution lower than 3.00 Å. It is the structure of STING adaptor protein with five SeMet sites and 265 amino acid residues per asymmetry unit (PDB entry 4EF5[26]). The anomalous diffraction data are collected at a wavelength of 0.98 Å and indexed, integrated, and scaled at 3.10 Å with the space group of C2221 and the mean anomalous difference of 0.0716.
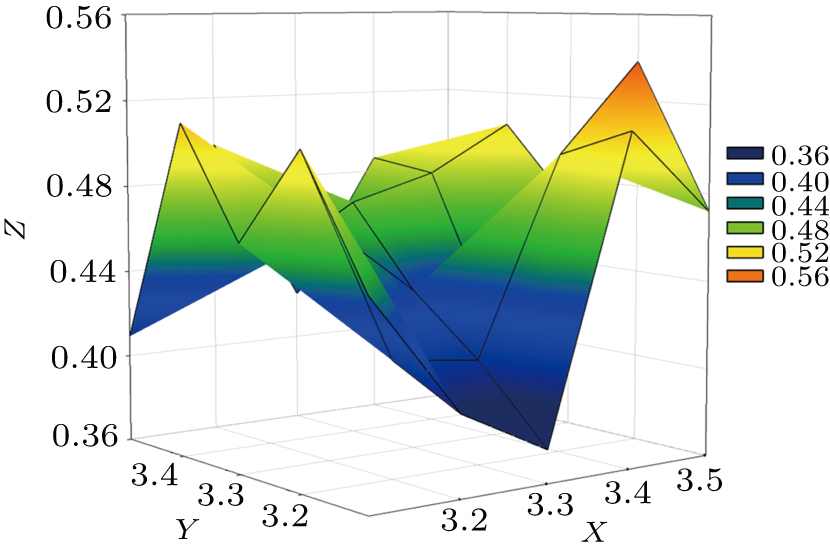
Normally, the “Signal-to-Noise” and “Measurability” of the anomalous diffraction data increase with resolution decreasing,[27] while too low resolution will reduce the phase accuracy. Thus, in heavy-atom sites searching and phasing steps, a compromise selection of resolution limit is necessary. So, in this case, the resolution screening range for heavy-atom sites searching and phasing is set to be from 3.10 Å to 3.50 Å with an increasing interval of 0.05 Å. The 100 jobs are created by using the X2DF, but yield only one “Good Result.” The “Best resolution” is 3.40 Å/3.20 Å, not the highest resolution of the diffraction data (as shown in Table
Similar resolution limits are recommended based on “Measurability” and “Anisotropy” analysis.[28] The “Measurability” can be defined as the fraction of Bijvoet related intensity difference, and it is a function of resolution. When its value is greater than 0.10, the anomalous signal will be strong enough for identifying the anomalous substructure sites. “Anisotropy” can be defined as the difference in resolution limit along the reciprocal space axes. In this case, when the “Measurability” is greater than 0.10, the resolution can extend to 3.43 Å. Further, there is a slight resolution anisotropy” in T1 data. The resolution limits along the reciprocal space axes (a*, b*, and c*) are 3.17 Å, 3.19 Å, and 3.11 Å, respectively. The resolution limit (3.40 Å/3.20 Å) used in this case is evaluated, and can guarantee the strength of the anomalous signal for searching the substructure sites and also avoid influencing the building of the final model by crystal anisotropy.
Test case 2 (T2) represents a typical case of SeMet-SAD with low redundancy and low crystal symmetry. It is the structure of the Leanyer orthobunyavirus nucleoprotein-RNA complex, with 24 SeMet site and 952 amino acid residues per asymmetry unit (PDB entry 4J1G[29]). The anomalous diffraction data are collected at a wavelength of 0.98 Å and indexed, integrated, and scaled at 3.07 Å with the space group of P1, the redundancy of 3.8, and the mean anomalous difference of 0.0702. In this case, all the programs described in Subsection
In this case, 18 different combinations of programs are used for determining the structure, however, only one combination (Phenix.autosol + DM + Phenix.autobuild) yields “Good Result” (as shown in Table
| Table 3. Screening program for T2 in heavy-atom sites searching/phasing, density modification, and model building steps. Eighteen jobs are created by using X2DF with different program combinations, but only one combination yields “Good Result.” . |
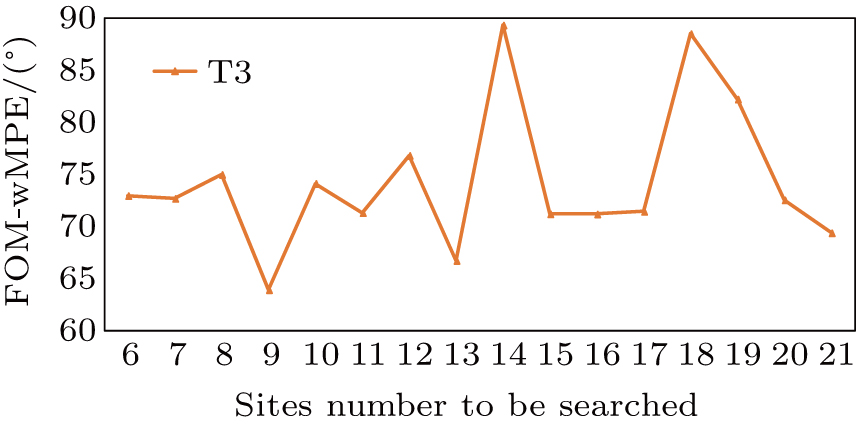
Test case 3 (T3) represents a typical case of long-wavelength native Sulphur SAD. It is the structure of the ectodomain of Death Receptor 6 consisting of 164 residues, of which 18 are cysteine and 3 are methionines (PDB entry 3U3S[30]). The anomalous diffraction data are collected at a wavelength of 2.00 Å and then indexed, integrated, and scaled at 2.70 Å resolution with the P6122 space group and the mean anomalous difference of 0.0349. In general, the number of heavy-atom sites can be analyzed by using the protein sequence and the anomalous difference Patterson map. However, the anomalous signal of the sulphur atoms is always weaker than that of the mental atoms; therefore, it is difficult to distinguish the signal peak from the background noise in the anomalous difference Patterson map. In this case, the screening range for heavy-atom sites is set to be from 6 to 21.
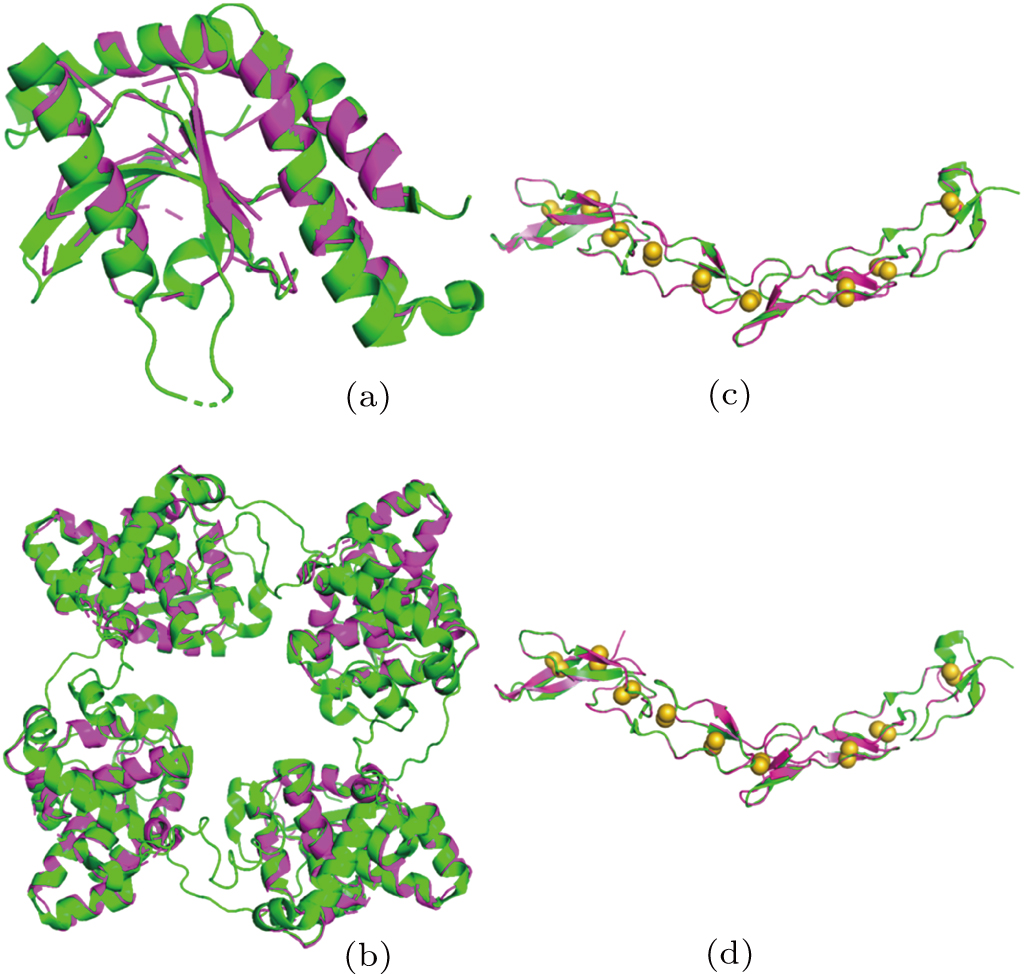
It can be seen from the results that the optimal number of the heavy-atom sites is 9, which is not the same as the quantity of cysteine and methionines in the sequence. However, when we analyze the deposited structure of T3, we find nine disulfide bonds in the structure as shown in Fig.
In this curve, the difference in heavy-atom sites yields the drastic variation of the FOM–wMPE value, and when the number of the sites is 9, the FOM–wMPE has the lowest value, which is consistent with the previous analysis. Above all, an accurate estimation of heavy-atom sites number can play a crucial role in “Substructure determination” and the “Initial phases calculation” step.
Test case 4 (T4) represents a typical case of long-wavelength Sulphur SAD with high-resolution data. Two sets of data are used in this case. They are the same protein of T3 but from other two different crystals (PDB entry 3U3P, 3U3T[30]).
For Sulphur SAD method, long-wavelength x-ray is used to enhance the anomalous signal of the diffraction data; however, we observe that the longer the wavelength, the lower the resolution will be. Therefore, two kinds of diffraction data are used together in this case. The anomalous diffraction data of 3U3T are collected at a wavelength of 2.70 Å with 3.21 Å resolution and the mean anomalous difference of 0.0592. The native diffraction data of 3U3P are collected at a wavelength of 0.98 Å with 2.09 Å resolution.
The results of this case are shown in Table
As of July 2019, about 90% of the macromolecular structures deposited in the PDB (
| [1] | |
| [2] | |
| [3] | |
| [4] | |
| [5] | |
| [6] | |
| [7] | |
| [8] | |
| [9] | |
| [10] | |
| [11] | |
| [12] | |
| [13] | |
| [14] | |
| [15] | |
| [16] | |
| [17] | |
| [18] | |
| [19] | |
| [20] | |
| [21] | |
| [22] | |
| [23] | |
| [24] | |
| [25] | |
| [26] | |
| [27] | |
| [28] | |
| [29] | |
| [30] |


