Enhanced thermoelectric performance in p-type Mg3Sb2 via lithium doping
Wang Hao1, 2, Chen Jin1, 2, Lu Tianqi2, Zhu Kunjie1, Li Shan2, Liu Jun1, †, Zhao Huaizhou2, ‡
School of Materials Science and Engineering, Central South University, Changsha 410083, China
Beijing National Laboratory for Condensed Matter Physics, Institute of Physics, Chinese Academy of Sciences, Beijing 100190, China


† Corresponding author. E-mail: liujun4982004@csu.edu.cn Hzhao@iphy.ac.cn

Abstract

The Zintl compound Mg3Sb2 has been recently identified as promising thermoelectric material owing to its high thermoelectric performance and cost-effective, nontoxicity and environment friendly characteristics. However, the intrinsically p-type Mg3Sb2 shows low figure of merit (zT=0.23 at 723 K) for its poor electrical conductivity. In this study, a series of Mg3−xLixSb2 bulk materials have been prepared by high-energy ball milling and spark plasma sintering (SPS) process. Electrical transport measurements on these materials revealed significant improvement on the power factor with respect to the undoped sample, which can be essentially attributed to the increased carrier concentration, leading to a maximum zT of 0.59 at 723 K with the optimum doping level x = 0.01. Additionally, the engineering zT and energy conversion efficiency are calculated to be 0.235 and 4.89%, respectively. To our best knowledge, those are the highest values of all reported p-type Mg3Sb2-based compounds with single element doping.

PACS: ;72.20.Pa;;73.50.Lw;
1. Introduction

To recover the massive global-existing waste heat dissipated from industrial or civilian sources to useful energies, thermoelectric (TE) has been one of the most desirable solutions owing to their capability to convert energy between heat and electricity reversibly and directly.[14] The performance of TE materials is primarily governed by its dimensionless figure of merit (zT), which is defined as follows: , where S represents the Seebeck coefficient, σ is the electrical conductivity, K is the thermal conductivity, and T is the absolute temperature.[510] Thus, a good TE material should not only possess high power factor ( but also low thermal conductivity. However, because of the interrelated relationship between electrical and thermal transports through heat-carrying charge carriers, itʼs extremely difficult to decouple these transports and achieve desirable enhancements on zT property.

The “phonon–glass, electron–crystal” (PGEC) concept introduced by Slack[11] has been an effective way to partially decouple those electrical and thermal parameters for optimizing thermoelectric properties. According to this concept, ideal TE materials prone to have independent functional modules to modulate electron and phonon transport separately. Through optimization on these modules, materials with electron transport characteristics of crystal and phonon transport characteristics similar to glass can be obtained. Among notable families of TE materials such as lead telluride,[12] skutterudites,[13] half-heuslers,[6] MgAgSb,[14] and so on, Zintl phase compounds are found to meet such criterions. It consists of anions (post-transition elements from group 13–15) and cations (alkali metal or alkaline earth metal elements) which exhibits large electronegativity difference.[15,16] During the formation of ionic bonds, the cations donate electrons to the anions while the latter would further build covalent bonds among themselves to satisfy valence balance, thus leading to formation of complicated lattice structure. The stable covalent-bond lattice contributes to the characteristic of “electron crystal”, which would dominate the electrical conductivity of the material. In addition, anions in the weak ionic bonding area would form locally disordered structure, offering it the characteristics of the “phonon glass”.

Over the past decade, significant progresses have been made on Zintl phase thermoelectric materials, a large number of high performance Zintl phase bulk materials such as Yb14MnSb11,[17] BaGa2Sb2,[18] CaxYb1−xZn2Sb2,[19] Ba24InxGe100−x,[20] and NaGaSn2[21] have been reported. However, they are restricted in the practical applications for their toxic or expensive constituent elements. Recently, a cheap and nontoxic Zintl phase compound, Mg3Sb2, has greatly attracted the attentions. The Bi and Te co-doped n-type Mg3Sb2 bulk material was prepared with good reproducibility using ball milling and SPS method, in which zT value achieved 1.5 at 723 K.[22] Thus indicates the Mg3Sb2-based bulk material might be promising thermoelectric materials with potential application in the middle temperature ranges.[2327] However, the practical application is severely limited by the poor thermoelectric performance of p-type Mg3Sb2 materials, which is the direct motivation of this study.

For undoped Mg3Sb2, it shows a persistent p-type characteristic since the thermally activated vacancies at Mg-sites with negative charges. However, its low carrier concentration results in a poor electrical conductivity. A variety of approaches have been used to solve this problem, such as doping Pb,[28] Bi[29] at the Sb site, or doping Na,[30] Ag,[31] Mn,[32] Zn[33] at the site of Mg. Among them, Na doping seems to be the most effective way to increase the carrier concentration, but this also increased the lattice thermal conductivity of the material. Other dopants could reduce the thermal conductivity, while the improvement on electrical transport is less satisfactory.

In this work, the alkali metal lithium is used to dope at cationic site in Mg3Sb2 to tune the carrier concentration. Experimental results reveal that the doping operation effectively improved the electrical transport performance of the Li-doped samples. Meanwhile, a slightly decrease of the lattice thermal conductivity is observed, which should be attributed to the increased point defects scattering on phonon. As a result, improved TE properties have been achieved in a broad range of temperatures. The peak zT of Mg2.99Li0.01Sb2 bulk material reached 0.59 at 723 K, increased by 158% compared with the undoped sample. Moreover, the calculated engineering zT and efficiency are 0.235 and 4.89%, respectively, indicating that Li-doped Mg3Sb2 compound could be a good p-type thermoelectric material.

2. Experimental methods
2.1. Synthesis

The Mg3−xLixSb2 (x = 0, 0.005, 0.01, 0.02) bulk samples were prepared by ball milling and spark plasma sintering (SPS). In a typical method, magnesium (Mg, Alfa Aesar, 99.8%, turnings), lithium (Li, Sigma Aldrich, 99.9%, ribbon), and antimony (Sb, Alfa Aesar, 99.999%, pieces) were weighed according to the stoichiometry in an Ar-filled glove box. Then the raw materials were loaded into a stainless steel jar and ball milled for 10 h by using a SPEX Sample Prep 8000 Mixer/Mill. Finally, the obtained powder was put into a graphite die (diameter, 12.7 mm) and treated by SPS process at 1023 K for 10 min under a pressure of 50 MPa. The density of those as-pressed samples was measured by using Archimedes method to be in the range of 96% to 98% of the theoretical density.

2.2. Phase and microstructure analysis

The x-ray diffraction (XRD) patterns of as-prepared samples were collected by a diffractometer (PANalytical X’Pert Pro) operated at 40 kV and 40 mA with Cu Kα radiation (λ =1.542 Å). The measurement was carried out in the 2θ range of 20°–80° in air. The microstructures of samples were characterized by a scanning electron microscopy (SEM, XL30S-FFG) on the samples’ cross sections. More details were obtained on a transmission electron microscopy (TEM, JEM-2100 Plus).

2.3. Thermoelectric transport measurement

The temperature dependence of electrical resistivity and Seebeck coefficient were measured on a commercial system (LSR-3, Linseis) in the atmosphere of high purity helium. The temperature dependence of total thermal conductivity was defined as . Where D represents the thermal diffusivity, is the specific heat capacity calculated by the Dulong–Petit law , where R is the gas constant, N is the ratio of atomic number to molar mass, d is the density which is measured by Archimedes method. The thermal diffusivities of all samples were measured by the laser flash method using a commercial system (LFA-1000, Linseis). The room-temperature carrier concentration and mobility of all samples were collected by using the van der Pauw method under a magnetic field of 0.5 T.

3. Results and discussion
3.1. Structures and morphologies analysis

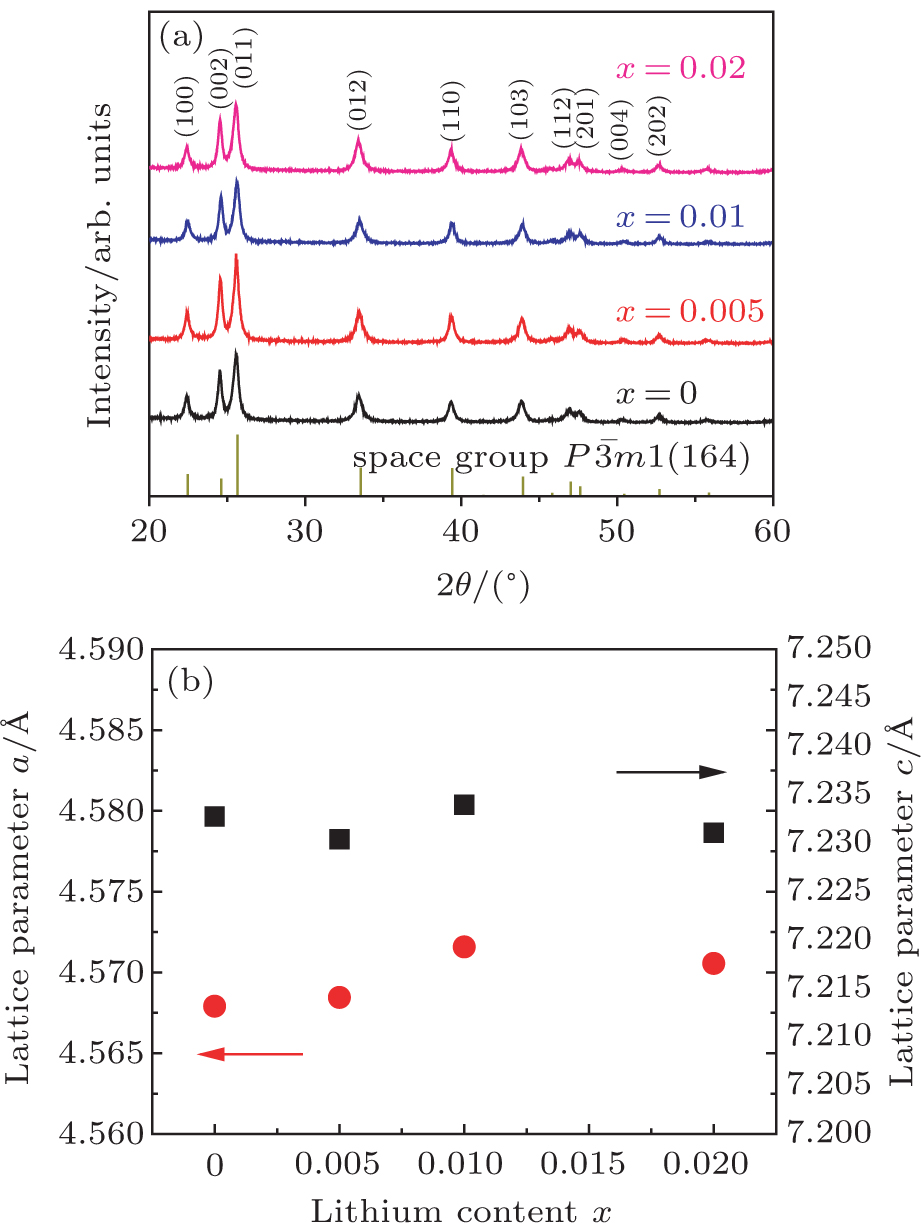
As shown in Fig. 1(a), the XRD patterns of as prepared Mg3−xLixSb2 compounds can be indexed to the pure Mg3Sb2 phase with a space group of (NO. 164). Besides, no obvious peak position shift is observed, which indicates the changes of lattice parameters by lithium doping are negligible. To identify this, the lattice parameters of the doped Mg3−xLixSb2, as a function of the various lithium contents, are displayed in Fig. 1(b). The minor change between the doped and undoped samples is attributed to the very small content of dopants, which is consistent with previous reports.[30,31]

Fig. 1. (color online) (a) XRD patterns and (b) lithium doping dependence of lattice parameters for series of Li-doped Mg3−xLixSb2 (x = 0, 0.005, 0.01, 0.02) compounds.

Figure 2 shows the typical microstructure of the optimal Mg2.99Li0.01Sb2 sample. The SEM image is displayed in Fig. 2(a), it can be seen that the prepared bulk sample is dense without obvious preferred orientation, and the grain sizes are in the tens of macrons. Figure 2(b) shows the highresolution transmission electron microscopy (HRTEM) image for the same sample, revealing the randomly orientated grains with the interplanar distance of the planes (011) (0.351 nm), (012) (0.266 nm), and (110) (0.23 nm) of Mg3Sb2 phase (JCPDS 36-1180). The nano domains of crystallites in the grain should be favorable for the heating-carrying phonon scattering in this material, as discussed in the following content.

Fig. 2. (a) SEM and (b) high resolution TEM image of as-synthesized Mg2.99Li0.01Sb2 sample.
3.2. Electrical transport analysis

The temperature dependence of electrical resistivity and Seebeck coefficient are shown in Fig. 3. Among them, figure 3(a) reveals that the electrical resistivity of the Li-doped materials has been reduced drastically even though small amounts of lithium were doped in. To explain this phenomenon, the results of room-temperature Hall measurements are displayed as shown in Fig. 4(a). Carrier concentration (n) of undoped sample is , while it can be increased to (about 14 times higher than the former) when doped only 0.2 at.% (x = 0.005) Li at Mg site. Nevertheless, the carrier mobility ( of this doped sample decreases only by 12.5% compared to the undoped one. For electrical conductivity , the improved electronic property of doped samples can be ascribed to their higher carrier concentration. More details can be found from Fig. 3(b) which shows the electrical resistivity of these doped materials. As can be seen, the electrical resistivity decreases in the whole temperature range with increasing Li content. In addition, the temperature dependence of electrical resistivity for all samples can be separated into two regimes. From 323 K to 573 K, it is characterized by heavily degenerated semiconductor, then change into semiconductor features during 573 K–723 K owing to the intrinsic thermal excitation at high temperature. Figure 3(c) and 3(d) show the Seebeck coefficient as a function of temperature for all samples. The positive value suggests that they are p-type semiconductors which are consistent with the results of Hall measurement. It also exhibits the similar temperature dependent characteristic as the electrical resistivity discussed above. Figure 3(e) is the temperature-dependent power factor of all samples. Apparently, the power factor can be effectively enhanced through a lithium doping process. Besides, for the optimized composition Mg2.99Li0.01Sb2, its power factor reaches at 723 K, which is a relatively high value among all p-type Mg3Sb2 materials.

Fig. 3. (color online) Temperature dependence of (a) electrical resistivity and (c) Seebeck coefficient for all prepared samples; (b) electrical resistivity and (d) Seebeck coefficient for Li-doped samples.
Fig. 4. (color online) (a) Room-temperature Hall carrier concentration and Hall mobility of Mg3−xLixSb2 (x = 0, 0.005, 0.01, 0.02), (b) the Seebeck coefficient versus carrier concentration at room temperature. The black solid curve is the calculated relation between Seebeck coefficient and carrier concentration using an SPB model with , while the scatters represent the experimental data of Mg3−xLixSb2 (x = 0, 0.005, 0.01, 0.02) compounds.

In the approximation of energy independent scattering, the Seebeck coefficient can be described using a single parabolic band (SPB) model: where is Boltzmannʼs constant, h is Planckʼs constant, is the effective mass, n is the carrier concentration, and e is the charge of an electron.[34] The Pisarenko relation at room temperature can be plotted given that the effective mass represents the mass of an electron) as previous work mentioned.[33] As figure 4(b) shows, the experimental room-temperature carrier concentration and Seebeck coefficient of Mg3−xLixSb2 (x = 0), 0.005) compounds are fitted well with the calculated Pisarenko curve, while a little deviation appears for samples with x = 0.01 and 0.02 which caused by the increased effective mass leading by higher doping ratio. Since the change is small, SPB model is still appropriate to describe the electronic transport of those samples.

3.3. Thermal transport analysis

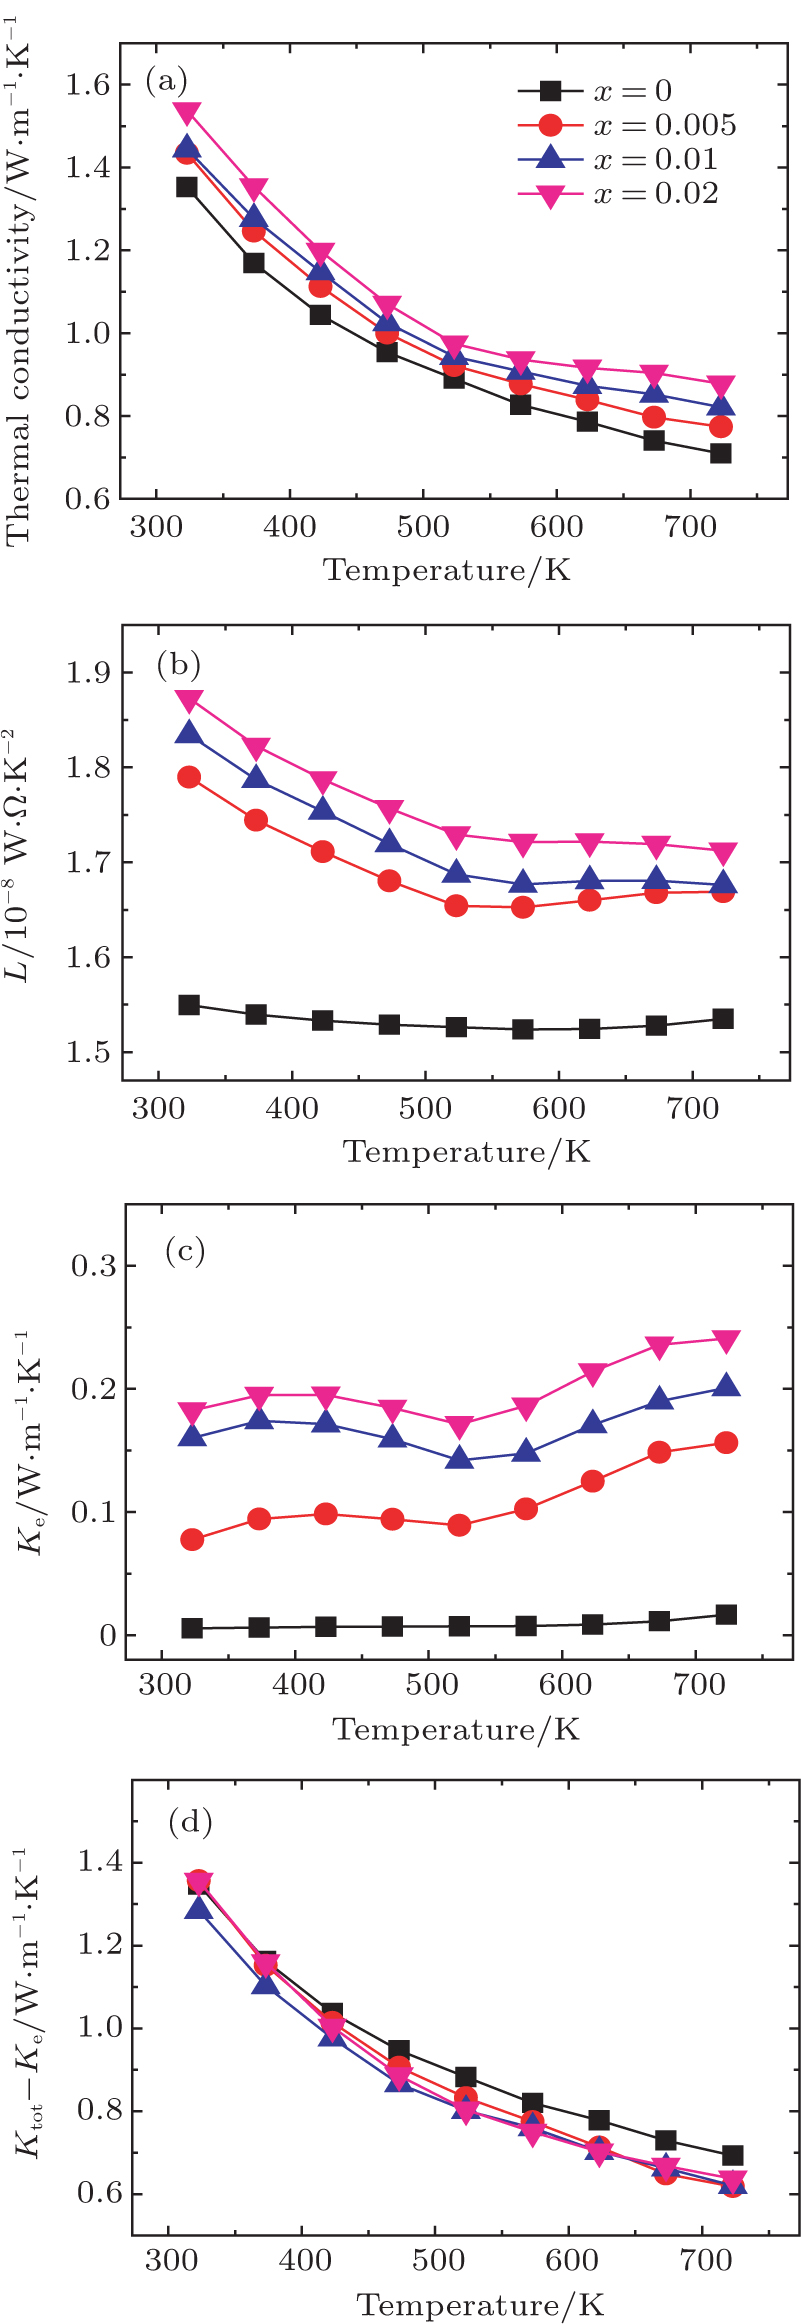
Figure 5(a) shows the temperature dependence of total thermal conductivity ( for the studied samples, it decreases with the increase of temperature. Additionally, it is proportional to the doped Li ratio. Generally, in a TE material is mainly composed of three parts: lattice thermal conductivity ( , carrier thermal conductivity ( , and bipolar thermal conductivity ( . In order to understand the thermal transport mechanism more clearly, the carrier thermal conductivity is given by the Wiedemann–Franz law . L is the Lorenz number which can be calculated by employing the SPB model as follows:[35] where represents the Fermi integral, χ is the reduced Fermi level, and ε is the reduced carrier energy. The value of scattering factor λ is set as zero by assuming that the carrier relaxation time is limited by acoustic phonon scattering.[36] Consequently, the Lorenz number L and Seebeck coefficient S are connected through the Fermi integral. However, searching the Fermi integral seems to be a complicated operation. Kim et al. simplified the above process to an expression:[37] where the unit of L and S are and , respectively. The accuracy is over 95% for single parabolic band model where acoustic phonon scattering is the dominant scattering mechanism. Considering the typical error range of total thermal conductivity is about 10%, the result of above calculation is credible.

Fig. 5. (color online) Temperature dependence of (a) total thermal conductivity; (b) Lorenz number; (c) carrier thermal conductivity; and (d) lattice thermal conductivity for Mg3−xLixSb2(x = 0, 0.005, 0.01, 0.02) samples.

The obtained L and carrier thermal conductivity are shown in Figs. 5(b) and 5(c), respectively. The bipolar thermal conductivity originates from the excitation of minority carriers at a finite temperature and plays a more and more important role with the increase of temperature. In this study, the bipolar effect is not obvious because there is little reduction of Seebeck coefficient caused by it in high temperature. So, as plotted in Fig. 5(d), the lattice thermal conductivity can be estimated roughly by subtracting from the total thermal conductivity , showing a -type behavior which means it is dominated by the Umklapp process. Among the four plots in Fig. 5, the carrier thermal conductivity of doped samples increases substantially with increasing Li content, while the lattice thermal conductivity of them are lower than that of the undoped sample. This is mainly ascribed to the increased point defects scattering produced by Li dopants. Therefore, the increased total thermal conductivity of Li-doped samples is contributed by the higher carrier thermal conductivity resulted from their enhanced electrical properties. Compared with the Na-doped materials (in which lattice thermal conductivity increased anomalously with increasing Na content),[30] the smaller value of total thermal conductivity for Li-doped samples is reasonable owing to its lower lattice thermal conductivity.

3.4. Calculation of zT and efficiency

The calculated Figure of merit (zT) is shown in Fig. 6(a). Owing to the optimized electrical transport performance, the peak zT of optimal Mg2.99Li0.01Sb2 bulk material reaches 0.59 at 723 K, about 2.58 times higher than that of the undoped sample. Furthermore, in terms of the global TE performance over a wide temperature range, the engineering zT (( proposed by Kim et al.[38] can be used to reflect the practical efficiency of a TE material since the TE devices always works under a temperature gradient, which is defined as: where , is the hot-side temperature, is the cold side temperature. , , and are measured temperature-dependent Seebeck coefficient, electrical resistivity, and total thermal conductivity, respectively. Figure 6(b) shows the dependence of engineering zT with for all samples. It can be clearly seen that the values of the doped samples are substantially enhanced compared with that of the pristine sample, especially for the Mg2.99Li0.01Sb2 compound which arrives 0.235 when . Moreover, the related energy conversion efficiency ( is expressed as: where represents Carnot efficiency, is a dimensionless intensity factor of the Thompson effect, is the Seebeck coefficient at the hot-side. Thus, there is a positive correlation between η and . From Fig. 6(c), the efficiency of Mg2.99Li0.01Sb2 approaches 4.89% at , about 190% higher than that of the undoped sample.

Fig. 6. (color online) Calculated thermoelectric performance of Mg3−xLixSb2 (x = 0, 0.005, 0.01, 0.02) compounds: (a) zT; (b) engineering zT; and (c) energy conversion efficiency.

To further evaluate the impact of different dopants (such as Li, Na, Ag, Pb, Bi) on the TE performance of Mg3Sb2, figure 7 shows the zT and of those doped samples. It is observed that the zT (shown in Fig. 7(a)) of Li-doped sample increases linearly with temperature and exhibits the highest value in a broad of test temperature range (except for the Pb-doped sample over 630 K and Ag-doped sample below 400 K). Besides, the Li-doped compound also exhibits the highest (when , ) among them, as shown in Fig. 7(b). Therefore, it is reasonable to conclude that Li is a more effective acceptor dopant.

Fig. 7. (color online) Comparison of (a) temperature-dependent zT and (b) engineering zT of Mg2.99Li0.01Sb2 and those of previous reported p-type Mg3Sb2 compounds (Mg2.985Ag0.015Sb2, Mg2.9875Na0.0125Sb2, Mg3Sb1.8Pb0.2, and Mg3Sb1.8Bi0.2).
4. Conclusions

In summary, a series of Li-doped p-type Mg3−xLixSb2 (x = 0, 0.005, 0.01, 0.02) bulk material has been prepared by combination of ball milling and SPS process. The thermoelectric performance was greatly improved in comparison to that of undoped Mg3Sb2 sample. For the optimized Mg2.99Li0.01Sb2 sample, the peak zT and maximum reaches to 0.59 and 0.235, respectively. This enhancement can be mainly ascribed to the improved electrical transport properties by optimizing carrier concentration via effective Li doping at Mg site. In addition, Li-doped sample shows the best global TE performance among other single-element-doped Mg3Sb2 materials, thus pushing the practical application of Mg3Sb2 based Zintl compounds one step further.

Reference
[1] Bell L E 2008 Science 321 1457
[2] Disalvo F J 1999 Science 285 703
[3] Harman T C Taylor P J Walsh M P LaForge B E 2002 Science 297 2229
[4] Kraemer D Poudel B Feng H-P Caylor J C Yu B Yan X Ma Y Wang X Wang D Muto A McEnaney K Chiesa M Ren Z Chen G 2011 Nat. Mater. 10 532
[5] Pei Y Shi X LaLonde A Wang H Chen L Snyder G J 2011 Nature 473 66
[6] Zhao H Z Cao B L Li S M Liu N Shen J W Li S Jian J K Gu L Pei Y h Snyder G J Ren Z F Chen X L 2017 Adv. Energy Mater. 7 1700446
[7] Zhao L D Tan G Hao S He J Pei Y Chi H Wang H Gong S Xu H Dravid V P 2016 Science 351 141
[8] Wu Z H Xie H Q Wang Y Y Xing J J Mao J H 2015 Chin. Phys. Lett. 32 131
[9] Xu Y 2016 Chin. Phys. B 25 54
[10] Zhang X Liu J Li Y Su W B Li J C Zhu Y H Li M K Wang C M Wang C L 2015 Chin. Phys. Lett. 32 113
[11] Slack G A 1995 CRC Handbook of Thermoelectrics Boca Raton CRC Press 407
[12] Ruan L Luo J Zhu H Zhao H Liang J 2015 J. Electron Mater. 44 3556
[13] Shi X Kong H Li C P Uher C 2008 Appl. Phys. Lett. 92 407
[14] Li D D Zhao H Z Li S M Wei B P Shuai J Shi C L Xi X K Sun P J Meng S Gu L Ren Z F Chen X L 2015 Adv. Func. Mater. 25 6478
[15] Kauzlarich S M Brown S R Jeffrey Snyder G 2007 Dalton Transactions 21 2099
[16] Toberer E S May A F Snyder G J 2010 Chem. Mater 22 624
[17] Brown S R Kauzlarich S M Gascoin F Snyder G J 2006 Chem. Mater. 18 1873
[18] Kim S J Kanatzidis M G 2001 Inorg. Chem. 40 3781
[19] Gascoin F Ottensmann S Stark D Haïe S M Snyder G J 2005 Adv. Func. Mater. 15 1860
[20] Kim J H Okamoto N L Kishida K Tanaka K Inui H 2007 J. Appl. Phys. 102 094506
[21] Yamada T Yamane H Nagai H 2015 Adv. Mater. 27 4708
[22] Tamaki H Sato H K Kanno T 2016 Adv. Mater 28 10182
[23] Jing S Mao J Song S Zhu Q Sun J Wang Y He R Zhou J Singh D J Chen G 2017 Energy Environ. Sci. 10 799
[24] Mao J Shuai J Song S Wu Y Dally R Zhou J Liu Z Sun J Zhang Q Dela C C 2017 Proc. Natl. Acad. Sci. USA 114 10548
[25] Mao J Wu Y Song S Shuai J Liu Z Pei Y Ren Z 2017 Mater. Today Phys. 3 1
[26] Mao J Wu Y Song S Zhu Q Shuai J Liu Z Pei Y Ren Z 2017 Acs Energy. Lett. 2 2245
[27] Zhang J Song L Pedersen S H Yin H Hung L T Iversen B B 2017 Nat. Commun. 8 13901
[28] Bhardwaj A Misra D K 2014 RSC Adv. 4 34552
[29] Bhardwaj A Rajput A Shukla A K Pulikkotil J J Srivastava A K Dhar A Gupta G Auluck S Misra D K Budhani R C 2013 RSC Adv. 3 8504
[30] Shuai J Wang Y Kim H S Liu Z Sun J Chen S Sui J Ren Z 2015 Acta Mater. 93 187
[31] Song L Zhang J Iversen B B 2017 J. Mater. Chem. 5 4932
[32] Kim S Kim C Hong Y K Onimaru T Suekuni K Takabatake T Jung M H 2014 J. Mater. Chem. 2 12311
[33] Bhardwaj A Chauhan N S Goel S Singh V Pulikkotil J J Senguttuvan T D Misra D K 2016 Phys. Chem. Chem. Phys. 18 6191
[34] Cutler M Leavy J F Fitzpatrick R L 1964 Phys. Rev. 133 A1143
[35] May A F Toberer E S Saramat A Snyder G J 2009 Phys. Rev. 80 125205
[36] Wood C 1988 Rep. Prog. Phys. 51 459
[37] Kim H S Gibbs Z M Tang Y Wang H Snyder G J 2015 APL Mater. 3 041506
[38] Kim H Liu W Chen G Chu C Ren Z 2015 Proc. Natl. Acad. Sci. USA 112 8205